State Retiree Health Care Liabilities: An Update
Increased obligations in 2015 mirrored rise in overall health care costs
Editor's note: This brief was updated on Oct. 1, 2018, to reflect additional information provided by states.
Overview
States paid a total of $20.8 billion in 2015 for non-pension worker retirement benefits, known as other post-employment benefits (OPEB). Almost all of this money was spent on retiree health care. The aggregate figure for 2015, the most recent year for which complete data are available, represents an increase of $1.2 billion, or 6 percent, over the previous year. The 2015 payments covered the cost of current-year benefits and in some states included funding to address OPEB liabilities. These liabilities—the cost of benefits, in today’s dollars, to be paid in future years—totaled $692 billion in 2015, a 5 percent increase over 2014.
This brief provides an update to a 50-state analysis by The Pew Charitable Trusts detailing state OPEB assets and liabilities, “State Retiree Health Care Liabilities: Multiple Factors Contribute to Improving Picture in Many States,” released in 2016 and based on 2013 data. The update explores the varied structures of state OPEB programs and the cost of benefits across states. It also reviews the methods that they use to manage OPEB costs. Future analyses will examine the effectiveness of those efforts, including the impact of states’ pre-funding strategies and the potential legal issues facing those considering OPEB reforms.
OPEB funded ratios
In 2015, states had $46 billion in assets to meet $692 billion in OEB liabilities, yielding a funded ratio of 6.7 percent. The total amount of assets was slightly higher than the reported $44 billion in 2014, though the funding ratio did not change. The average state OPEB funded ratio is low because most states pay for retiree health care benefits on a pay-as-you-go basis, appropriating revenue annually to pay retiree health care costs for that year rather than pre-funding liabilities by setting aside assets to cover the state’s share of future retiree health benefit costs.
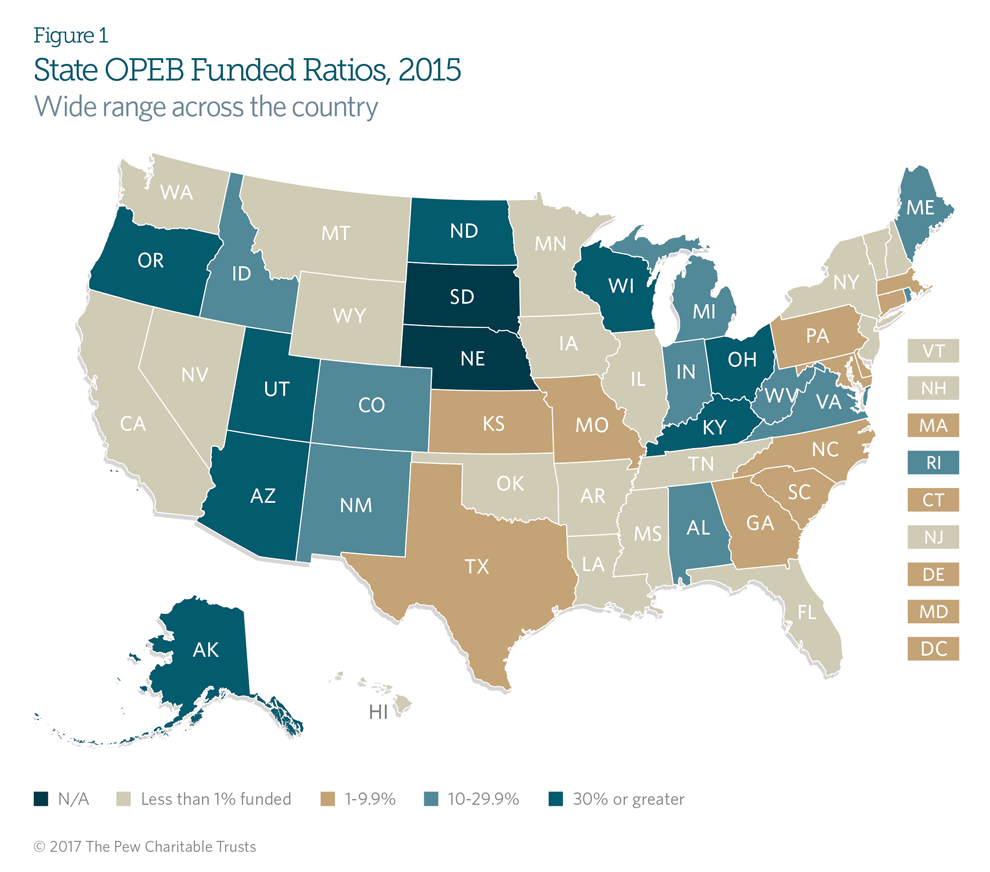
State OPEB funded ratios vary widely, from less than 1 percent in 19 states to 92 percent in Arizona. As Figure 1 shows, only eight have funded ratios over 30 percent. These states typically follow pre-funding policies spelled out in state law. Many of them also make use of the expertise of staff from the state pension system to invest and manage plan assets.
Variation in OPEB liabilities
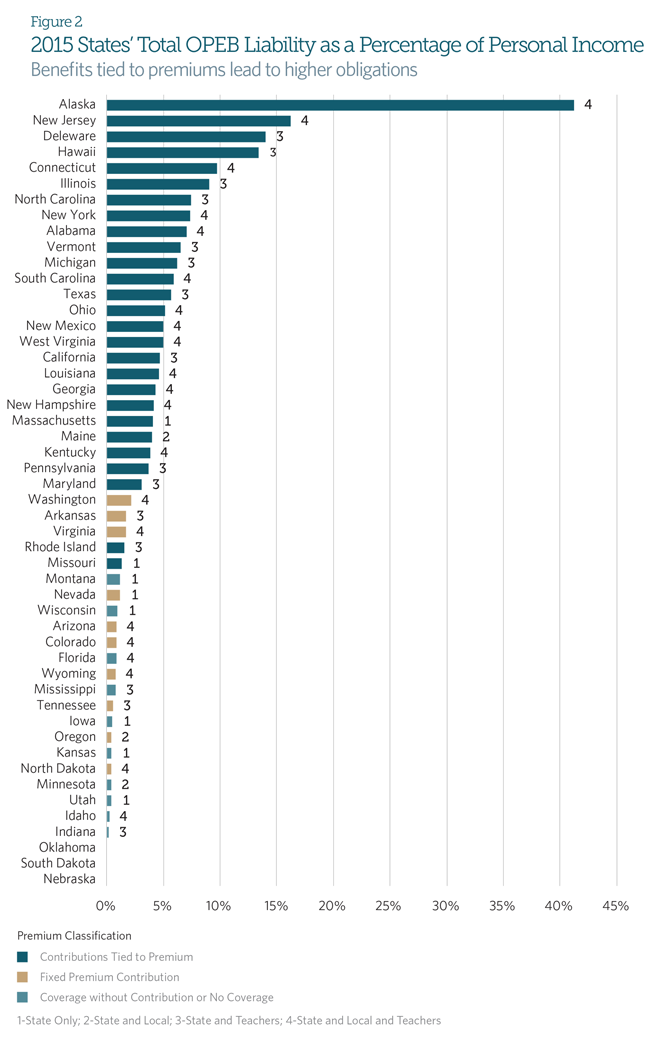
Pew compared states 2015 OPEB liabilities with 2015 state personal income to show these liabilities in relation to the potential resources that states could draw on to cover the liabilities. The major ratings agencies and other financial research organizations commonly use personal income as a metric to illustrate untapped revenue sources and as an indicator of how flexible states can be in meeting their obligations under changing budget conditions. The research shows significant overall reported OPEB liabilities, but the relative size varies widely. (See Figure 2).
The primary driver for the variation in OPEB liabilities is the difference in how states structure health care benefits for retirees. As a percentage of personal income, the liabilities range from less than 1 percent in 16 states to 16 percent in New Jersey. Alaska, which has the highest ratio of liabilities to personal income at 42 percent, is a clear outlier among the 50 states because of generous benefit levels that can reach up to 90 percent of premiums for some retired workers. States that provide eligible retirees a monthly contribution equal to a flat percentage of the health insurance coverage premium report the largest liabilities—and could face the greatest fiscal challenges because their costs automatically increase as plan premiums do.
Conversely, those states with fixed-dollar premium subsidies provide a smaller benefit and report lower liabilities. Their exposure to health care cost inflation is also lower, because a fixed-dollar subsidy does not rise with the plan premium. Lastly, the states that only provide access to a retiree health plan, with no subsidy, have the lowest liabilities as a percentage of personal income. Although these plans do not make an explicit monthly premium contribution to retirees, many offer retirees a reduced premium through a group rate, which is an implicit subsidy. The Governmental Accounting Standards Board (GASB), the private, independent organization that sets accounting and financial reporting standards for U.S. state and local governments, requires plans to recognize these implicit subsidies in plan financial reporting.
The number of employee groups covered by state OPEB plans also affects the size of retiree health liabilities reported in state comprehensive annual financial reports (CAFRs). For example, while some states may cover only employees working for state-level agencies, others also include municipal or school district employees in state-funded plans (workers who are typically covered at the local level). However, variations in employee eligibility do not appear to be the primary cause for differences in OPEB liability size.
As Figure 2 shows, states that provide retirees with a monthly contribution set at a flat percentage of the insurance premium rank highest in a comparison of OPEB liabilities as a percentage of state personal income, regardless of the number of employees covered. Fixed-dollar states that provide a small cash subsidy to be applied toward monthly plan premiums generally fall in the middle, and states that provide coverage without contributions rank at the low end of the scale. So although some of the variation in the funded ratio may be attributed to the number of retirees covered by OPEB benefits, most of the difference appears to be linked to the level of benefits provided.
Cost trends
The National Health Expenditure Accounts, the official estimate of health care spending produced by the Centers for Medicare & Medicaid Services, reported an increase of 5.8 percent in health expenditures nationwide as a percentage of gross domestic product in 2015 over 2014. That is roughly in line with the overall increase in reported costs and liabilities. This increase in national health expenditures closely mirrors state actuaries’ common assumption of a long-term health care cost trend rate of 5 percent increases per year.
Recent year-over-year changes in reported liabilities vary by state, however, with 37 reporting liability increases of less than 5 percent in 2014 and 27 reporting similarly low increases in 2015. Ten states in 2014 and 21 in 2015 reported liability increases greater than 5 percent. States that experienced liability increases below 5 percent—such as Hawaii, Illinois, and Louisiana—commonly attributed these changes to lower-than-expected claims values, as opposed to lower health care costs.
In contrast, a number of states with higher premium contributions—including California and New Jersey—reported significantly greater liabilities beginning in 2014, reflecting increases in assumed future costs. California’s plan actuary attributed $7.1 billion of the state’s $7.9 billion liability increase to changing demographic assumptions to account for longer retiree life expectancy in that year.New Jersey’s 2014 hike included a 5 percent increase in liabilities caused by changes in its mortality assumptions and a 9 percent jump linked to changes in health care cost assumptions. For states with the largest year-over-year change in OPEB liabilities, changes in assumptions were the largest driver in increasing costs.
While changes in long-term assumed investment return rates—often used to discount the cost of future liabilities into present value—did not play a significant role in annual liability fluctuations, Hawaii was a notable exception. Hawaii reported a 37 percent decline in its total liability since 2013, in part because of an increase in its plan discount rate from 4 percent to 7 percent in 2014.
Conclusion
Although overall OPEB liabilities increased in 2015, some individual state plans experienced lower projected liabilities, which were attributable to lower-than-expected claims values or changes in demographic assumptions. Still, for many states, the gap remains significant between the retiree health care benefits that these governments have promised workers and the funding to pay for them.
Multiple factors could affect reported liabilities in coming years, including future changes to benefits or funding policies, as well as health care inflation or demographic changes that differ from expectations. Policymakers should closely monitor future retiree health care liabilities, and many should consider ways to better manage these costs. Future analyses will examine state approaches to managing OPEB costs while maintaining the ability to pay for promised benefits, the impacts of pre-funding strategies, and the potential legal issues facing states seeking reforms.
Glossary
Discount rate. The discount rate is the assumed interest rate used to account for the fact that money invested now will accumulate interest and be worth more in the future.
Other post-employment benefits. In addition to pension benefits, state governments offer other post-employment benefits. Expenditures for these benefits consist primarily of retiree health insurance expenses but may also include a small percentage of expenditures for other insurance coverage such as dental, vision, life, or disability.
OPEB liabilities. OPEB liabilities reflect the expected cost of these benefits for current workers and retirees over the course of their lives. These liabilities are self-reported and calculated by each state’s actuary according to the standards set forth by the GASB.


