State Retiree Health Care Liabilities
Multiple factors contribute to improving picture in many states
 Stocksy
Note: This brief was updated on May 11 to clarify the description of Figure 2.
Overview
States paid $18.4 billion in 2013 for worker retirement benefits other than pensions, which are known as other post-employment benefits (OPEB). Almost all of this total was spent on retiree health care.1 The payments covered the cost of current-year benefits and, in some states, included funding to address OPEB liabilities—the cost in today’s dollars of benefits to be paid in future years. These liabilities for covered workers totaled $627 billion in 2013.
On aggregate, states had enough assets set aside to fund 6 percent of these liabilities, although there are large variations in both funded status and liabilities. Setting funds aside for future benefits can both make costs more predictable for taxpayers and make benefits more secure for retirees. This may be particularly important for states with higher levels of benefits and liabilities. The aggregate OPEB liabilities reported by states nationwide declined by 10 percent between 2010 and 2013, adjusted for inflation.
This brief provides an analysis by The Pew Charitable Trusts indicating that changes in state health plan provisions and funding policies, along with lower than expected health care inflation, drove this reduction in liabilities. It also includes an examination of state OPEB assets and liabilities.
The research is part of a larger look at how states handle OPEB costs. State Retiree Health Spending: An Examination of Funding Trends and Plan Provisions, a joint report released by Pew’s State Health Care Spending and Public Sector Retirement Systems projects, explores the issues more broadly. Future analyses will provide recommendations on pre-funding strategies, consider the current and projected costs of workers’ benefits, and examine the goal of ensuring that the cost of benefits is sustainable over the long term.
OPEB funded ratios
In 2013, states had $40 billion in assets in trusts to meet OPEB liabilities, with the level of assets on hand in proportion to OPEB costs—the funded ratio—at 6 percent. Each figure represents a small increase over the $35 billion in assets and 5 percent funded ratio reported for 2010. The aggregate ratios for each year are small because most states pay for retiree health care benefits on a pay-as-you-go, or pay-go, basis. These states appropriate revenue annually to pay that year’s retiree health care costs, in contrast to pre-funding liabilities by setting aside assets to cover a state’s share of future retiree health benefit costs.
State OPEB funded ratios vary widely, from less than 1 percent in 22 states to 73 percent in Arizona.2 As Figure 1 shows, Arizona is one of only seven states with funded ratios over 30 percent; the others are Alaska, North Dakota, Ohio, Oregon, Utah, and Wisconsin. These states typically follow explicit pre-funding policies written in state law. Many of these states also leverage the expertise of personnel from the state pension system to invest and manage plan assets.

Variation in OPEB liabilities
Pew compared states’ 2013 OPEB liabilities to 2013 state personal income to show these liabilities in relation to the potential resources states have on hand to pay for these costs. Although the research indicates significant overall reported OPEB liabilities, the relative size varies widely among states (Figure 2). OPEB liabilities range from zero percent of personal income in Oklahoma and Nebraska to 22 percent in Hawaii and 47 percent in Alaska.
While some of this variation in the funded ratio can be attributed to the number of retirees, most of the difference appears to be the result of the level of benefits provided.3 State retiree health care benefits vary widely. Some states provide contributions equal to a flat percentage of the premium for eligible retirees. Massachusetts, for example, pays 80 percent of the health premium for those who retired after Oct. 1, 2009, but other states prorate their contributions, often by years of service. Other states, such as Arizona and Colorado, provide a fixed-dollar contribution (that can be prorated) and is typically lower than the benefit provided by states that contribute a percentage of premiums. Still others, such as Nebraska and Montana, offer access to health care coverage to retirees but do not contribute toward the cost. Age and years-of-service requirements for retiree health coverage also vary.
Changes to liabilities over time
Since 2010 some states have made changes to health plan provisions and funding policies. These changes, along with lower rates of growth in health care costs, have resulted in a 10 percent decrease in states’ aggregate OPEB liabilities from 2010, to $627 billion in 2013, adjusting for inflation. (See Appendix C.) A wide variety of factors affect whether states’ reported OPEB liabilities rise or fall, including health care inflation, changes to retiree health plan design and eligibility criteria, and changes to actuarial assumptions.
Impact of changes to eligibility and contribution policies
Several states changed the criteria for eligibility and premium contributions for retiree health plan coverage and saw subsequent reductions in OPEB liabilities. For example, in 2012, Ohio raised the minimum years of service required to become eligible for benefits from 10 to 20, starting in December 2014, and reduced the state’s future premium contributions. Ohio also has increased pre-funding efforts.4 In 2011, Maryland decreased its liabilities, in part by moving to end Medicare prescription drug coverage for retirees in 2020.5 In 2011, West Virginia capped the growth of the per-retiree employer contribution for health premiums at 3 percent for eligible retirees, lowering its liabilities by $2.6 billion.6 If health care costs grow faster, retirees there will have to pick up the difference. In addition, many states adopted changes in recent years that primarily affect new hires and will result in lower retiree health care costs and OPEB liabilities over time.

Impact of retiree health plan design changes
Some states also reduced their liabilities as a result of changes to their retiree prescription drug benefits. Before the Patient Protection and Affordable Care Act went into effect, many employers, including governments, used the federal Retiree Drug Subsidy (RDS) program—which provides incentives for employers to continue prescription drug coverage—to support retirees. However, the enactment of the Affordable Care Act in 2010 made the Employer Group Waiver Plan (EGWP) a more attractive choice for many employers by providing greater subsidies and more favorable accounting treatment in calculating OPEB liabilities.
Under Governmental Accounting Standards Board (GASB) accounting rules, receipts from RDS programs are considered general revenue to the state or city government and therefore cannot be used to reduce future costs when calculating the OPEB liability. By contrast, those accounting rules allow the direct cost savings expected in the future from the EGWP to factor into OPEB liability calculations.
In 2012, New Jersey switched to an EGWP and reduced its reported liabilities by $11 billion.7 Louisiana also saw liability reductions totaling $2 billion as a result of adopting a group waiver plan in 2012.8 In 2011, Connecticut made changes to its plan design and funding policy that included new eligibility requirements and adoption of an EGWP. These steps cut Connecticut’s total retiree health care liability by $4.9 billion.9
Change in health care cost trends
States’ health care cost inflation in recent years proved lower than expected, which contributed to reduced liabilities. In financial reports for the years leading up to 2013, most states projected near-term annual health care cost inflation averaging about 7 to 8 percent a year when calculating OPEB liabilities.10 However, U.S. health care per capita spending grew by less than 2 percent a year between 2010 and 2013,11 so states typically paid out less in benefits in 2013 than they had projected in 2010. Lower actual costs then provide a lower starting point for the longer-term cost projections used to calculate OPEB liabilities. Indeed, in recent valuation reports, California, Georgia, and Massachusetts all cite lower than expected health care claims costs12 as a reason that their reported OPEB liabilities were reduced or grew at less than the rate of inflation.
Moody’s Investors Service projects future increases in health care inflation rates,13 and state actuaries are projecting that future growth in health care inflation costs will be higher than in recent years. In 2013 reporting, Hawaii projected near-term health inflation growth of 9 percent for one plan, California projected near-term inflation of 7 to 8.5 percent, Louisiana projected growth of 5 to 8 percent, Connecticut and Georgia projected growth of 5 to 7 percent, and Massachusetts projected growth rates of 5 to 6 percent. All of these states projected that the rate of growth would be 4.5 or 5 percent by 2030.14 If health care inflation falls below the assumed amounts, liabilities will drop again; if it is higher, however, liabilities will increase.
Changes to actuarial assumptions
Even small changes to actuarial assumptions can have a significant impact on reported liabilities. One relevant actuarial assumption is the discount rate, which is used to convert future benefit payments into current dollars when calculating the OPEB liability. When states pre-fund benefits, they can generally increase their discount rates. Higher discount rates can significantly reduce liabilities.
Pay-Go or Pre-Funding?
While most states pay for retiree health care on a pay-as-you-go, or pay-go, basis, some set aside assets to pre-fund these costs. Pre-funding requires additional resources in the near term but can lower long-term costs by generating investment returns on the money set aside.
State and local governments calculate other post-employment benefits (OPEB) liabilities using their own accounting assumptions when pre-funding these liabilities. States that pre-fund can use a higher discount rate—a measure used to convert future benefit payments into current dollars—than states with pay-go policies. As a result, governments that adopt pre-funding policies can expect decreases in their reported OPEB liabilities. Despite these benefits, some states indicated they may shy away from pre-funding to avoid recognizing the OPEB liability,* on the assumption that creating a trust might limit the state’s flexibility to change benefits in the future. *
* Laura Porter et al., “U.S. State OPEB Liabilities: Liability Limited for Most; Uncertain Assumptions Drive Calculations,” Fitch Ratings Special Report (June 11, 2014), 8 adip.
For example, Michigan began pre-funding in fiscal 2012 and raised the discount rate for large plans from 4 to 8 percent,15 which contributed to the state’s overall 46 percent drop in reported liabilities from 2010 to 2013. West Virginia dedicated $30 million annually for 20 years to OPEB, starting in fiscal 2016.16 The state also increased the discount rate from 3.56 to 6.10 percent, a step that was estimated to reduce liabilities by $1.3 billion.17 The discount rate used by West Virginia increased again in 2013 to 6.7 percent.18 Hawaii began pre-funding its OPEB obligations in fiscal 2014.19
Still, most states continue to pay for OPEB benefits on a pay-as-you-go basis, and many lowered their discount rates slightly to reflect changes in market interest rates. Based on available data, the discount rate for state plans in aggregate increased only slightly over this period—from an average of 4.75 percent in 2010 to 4.82 percent in 2013. This small net change indicates that adjustments to assumptions attributed to pre-funding are not the main factor in reducing liabilities. Changes in actuarial assumptions, such as life expectancy and retirement ages, also would affect future reported unfunded liabilities.
Conclusion
Many states have taken actions that have helped reduce their reported liabilities by changing their benefits and plan design, or by pre-funding their OPEB costs. These changes, combined with lower than expected health care inflation, led to a drop in liabilities from 2010 to 2013. Still, for many states, the gap remains significant between the health care benefits that state governments have promised workers and the funding to pay for them. Multiple factors could affect reported liabilities moving forward, including future benefit changes or changes in funding policies, and health care inflation or demographic changes that differ from current expectations.
Appendix A: Methodology
Data sources
The main data source for this analysis was the Comprehensive Annual Financial Report produced by each state for fiscal 2008 through 2013. Each CAFR details a state’s financial situation and key data. The independent Governmental Accounting Standards Board stipulates that the CAFR should include certain disclosures regarding OPEB finances. Because the financial reports contain standard information in a consistent format, they are a valuable source of data on state-run retirement systems. In addition, many states separately release the actuarial valuation for their OPEB plans.20 In many cases, Pew found the actuarial valuations offered more
detailed data than did the state CAFRs and used the valuations when available.
States primarily report retiree health insurance benefit costs in the OPEB statements but may also include financial data on nonhealth benefits such as life and disability insurance. Structures for managing state and local government health care and OPEB liabilities vary from state to state. State CAFRs report OPEB liabilities for health care plans that are run, managed, or financed by the state, which may or may not include local government retiree health care benefits.21
Accuracy and comprehensiveness
To ensure the accuracy of the information presented in this report, Pew used numerous quality control measures. Researchers identified and double-checked all instances where data changed significantly over time in the OPEB finance documents. Retirement and finance officials in each state were given the opportunity to review OPEB data for accuracy and in many cases offered useful feedback that was then incorporated into the analysis. This combined approach ensures this research is based on vetted, accurate numbers.
Data analyses
Pew collected data on 167 OPEB plans, including multiple plans in many states. But each state’s plans were aggregated to provide one set of OPEB numbers. That means Massachusetts, which runs one OPEB plan, can be easily compared with Arkansas, which runs 22 plans. As a result, the analysis was able to show broad national trends. When making comparisons across years, data were adjusted for inflation using the gross domestic product (GDP) deflator.22
Funded ratios by state
Pew aggregated data to get one value for each state’s OPEB liabilities and assets. By dividing the value of plan assets by the total liability, Pew arrived at each state’s OPEB funded ratio.
OPEB liabilities to personal income
To calculate each state’s aggregate OPEB liabilities as a percentage of state personal income, Pew compared the total actuarial accrued liabilities for all of a state’s OPEB plans in fiscal 2013 to the personal income data available online through the U.S. Bureau of Economic Analysis, adjusted to match each state’s fiscal year.
Percentage of annual required contribution paid
Pew used states’ aggregate actual expenditures to OPEB and the annual required contributions to OPEB reported in state and plan documents to calculate each state’s actual expenditures as a percentage of the annual required contribution.
Appendix B: GASB update on standards
Starting with fiscal years beginning after June 15, 2016, the Governmental Accounting Standards Board will implement new requirements for reporting on the financial standing of state OPEB programs.23 The changes will make comparative analysis of plans more feasible, improve transparency surrounding liabilities, and better public officials’ understanding of the financial health of OPEB plans. These new requirements include:
- Greater uniformity in actuarial assumptions. New standards will increase comparability across states’ financial statements by requiring actuaries to use standard actuarial methodologies when projecting costs and calculating liabilities. For instance, the new rules require all states to use a standard method of calculating the present value of benefits. Today, states use a variety of methods. That can result in difficulties comparing states’ liabilities and funded ratios. The discount rate, one of the most important economic assumptions used in the valuation, will now be determined by reference to a specific methodology, improving comparability.
- New disclosures on OPEB investment trust practices and governance. States will be required to report descriptive information on OPEB plan governance (including the composition of the boards that oversee the plans), the types of state retirees covered by each plan, and the benefits provided by each. States also will be required to disclose OPEB plan investments, their rate of return, and the state policies governing those investments.
- Additional financial statements. GASB will require state governments to publish additional financial statements in the state Comprehensive Annual Financial Report to more closely align with industry-accepted reporting standards for pension plans and to provide researchers with better OPEB plan data. This will include detailed OPEB financial data as well as investment gains and losses for the 10 most recent fiscal years. That will allow researchers to have longitudinal data in one place to better study trends.
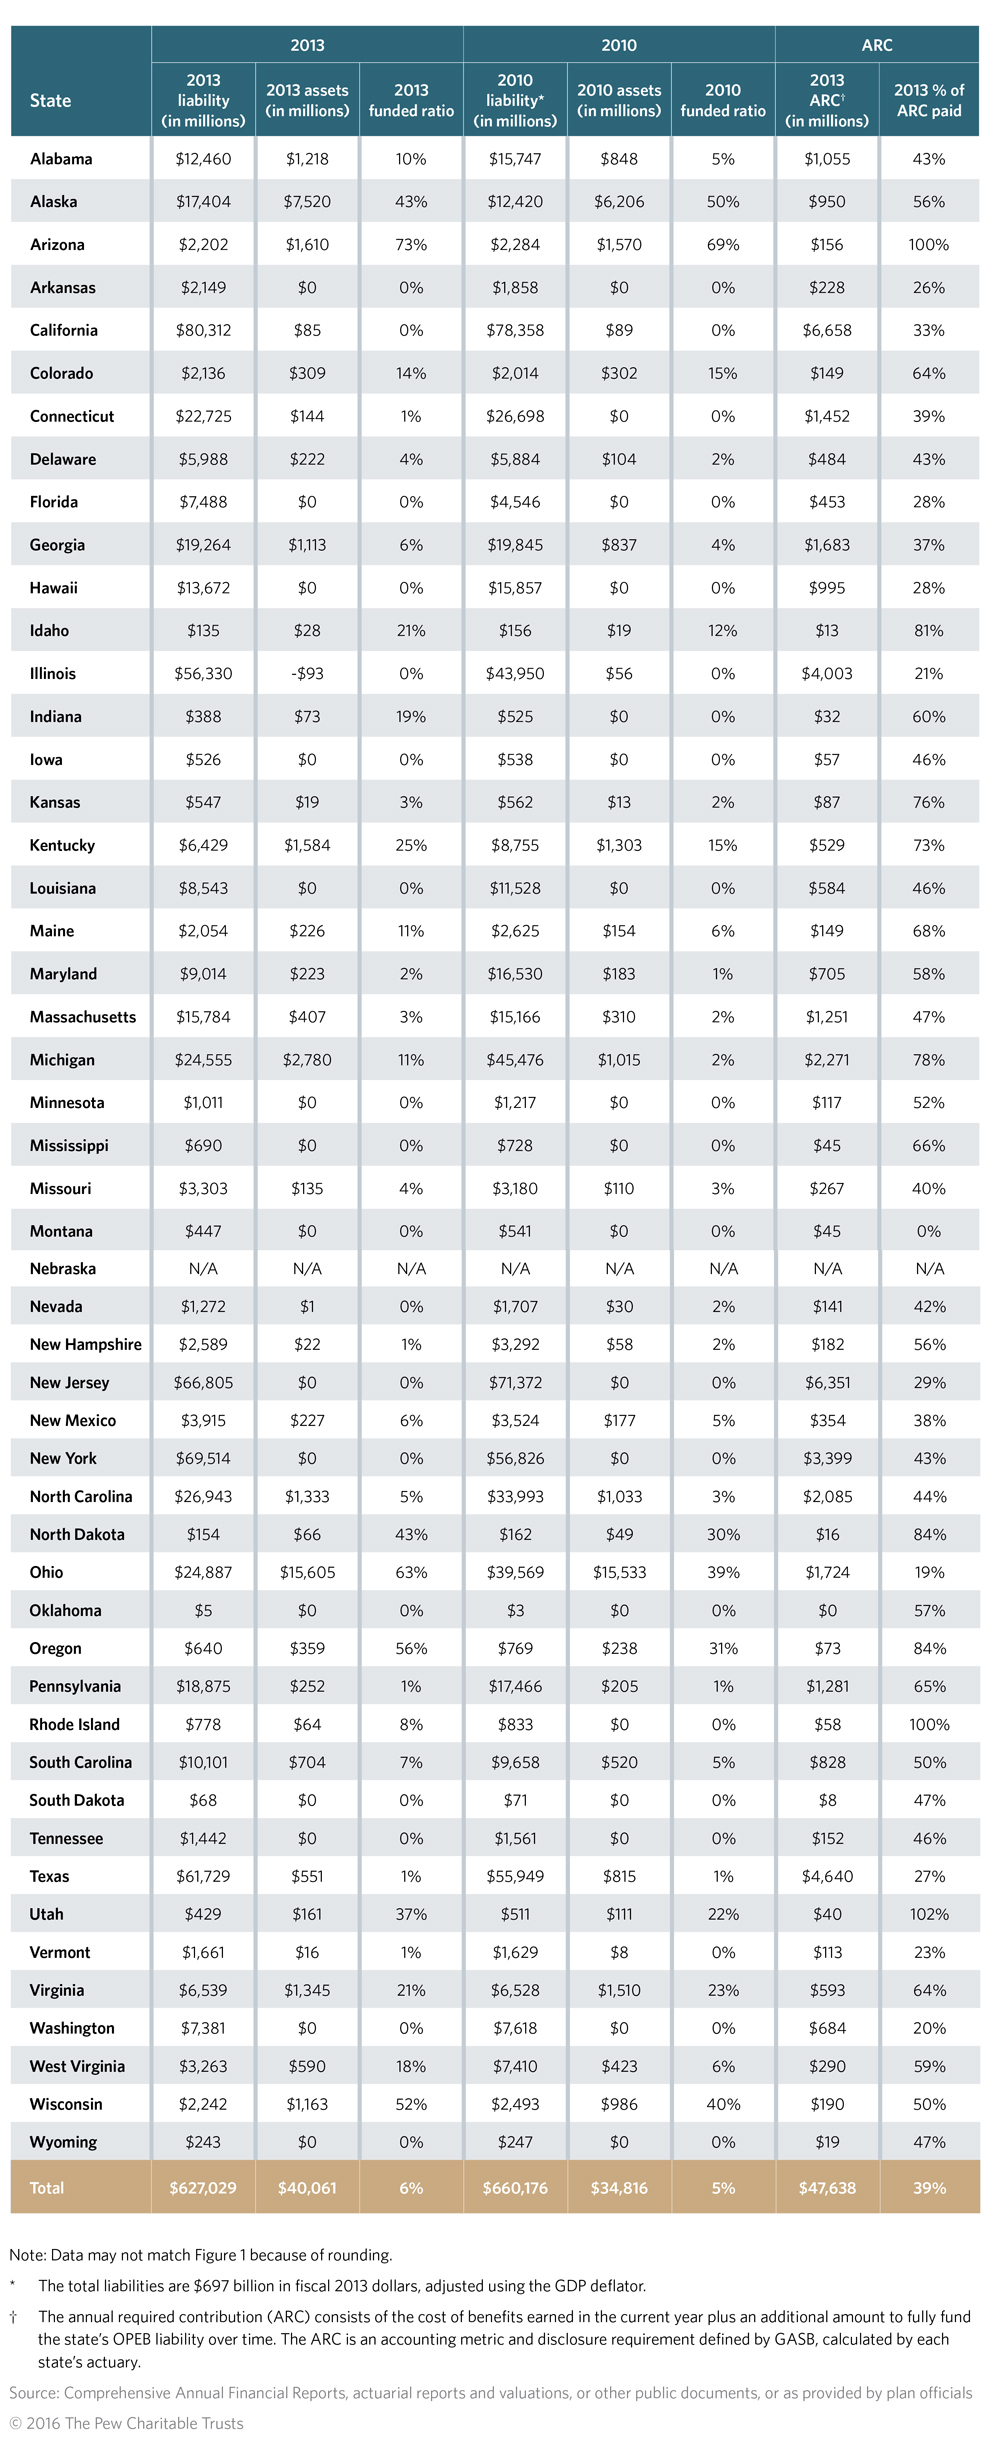
Appendix C: State OPEB liabilities and funded ratios, 2010-13
Endnotes
- Retiree health care accounts for the vast majority of other post-employment benefits, though it can also include coverage for life insurance, disability, vision, and dental care.
- Data may not match Appendix C because of rounding.
- Most states report obligations related to retiree health care coverage for state workers and teachers. Some report liabilities only for state workers, while others also include local workers other than teachers. For more on the inclusion of local workers in state reports, see Table A1 in Byron Lutz and Louise Sheiner, The Fiscal Stress Arising From State and Local Retiree Health Obligations (October 2013), http://www.netspar.nl/files/Evenementen/2014-01-9%20tm%2031%20IPW/papers/045%20sheiner.pdf.
- Ohio Public Employees Retirement System, “OPERS Health Care Preservation Plan” (January 2015), https://www.opers.org/pubs-archive/news/HCPP Summary 12 13.pdf; “Ohio PERS News” (Spring 2006), 7, https://www.opers.org/pubs-archive/members/newsletters/Ohio pers%20news%20spring%2006 member%20for%20web.pdf; and Sussan S. Corson, John A. Sugden, and David G. Hitchcock, Standard & Poor’s Ratings Services, “Diverging Trends Underlie Stable Overall U.S. OPEB Liability” (2014), 18, http://www.nasra.org/Files/Topical%20Reports/OPEB/SandP State OPEB report%2011-17-14.pdf.
- Laura Porter et al., “U.S. State OPEB Liabilities: Liability Limited for Most; Uncertain Assumptions Drive Calculations,” Fitch Ratings (June 11, 2014), 9; and Department of Legislative Services, Maryland General Assembly, The 90 Day Report: A Review of the 2011 Legislative Session (April 15, 2011), C-21 to C-22, http://dlslibrary.state.md.us/publications/dls/2011rs-90-day-report.pdf.
- Ernst & Young LLP, Financial Statements, Required Supplementary Information, and Other Financial Information: West Virginia Retiree Health Benefit Trust Fund Years Ended June 30, 2013 and 2012 With Report of Independent Auditors, 12, http://www.peia.wv.gov/Forms-Downloads/Documents/financial_reports/independent auditors reports/rhbt/Basic_Financial_Statements_Required_Supplementary_ Information_Other_Financial_Information_Fiscal_Years_2012-2013.pdf; and CCRC Actuaries LLC, State of West Virginia Public Employees Insurance Agency: Analysis of State of West Virginia Defined Benefit Cost-Sharing Multiple Employer Other Postemployment Benefit Plans, GASB 43 and GASB 45 Compliance as of June 30, 2011, 5, http://www.peia.wv.gov/Forms-Downloads/Documents/financial_reports/opeb/OPEB_Report_6-30-11.pdf.
- Aon Hewitt, State of New Jersey Postemployment Benefits Other Than Pension Actuarial Valuation (July 24, 2012), 2, http://www.state.nj.us/treasury/pensions/pdf/financial/gasb-43-july2011.pdf.
- Buck Consultants, GASB 45 Actuarial Valuation at 7/1/2011 of the State of Louisiana Post-Retirement Benefit Plan for the Office of Group Benefits (June 2012), ii, http://www.doa.la.gov/osrap/library/afr_packetts/ 2012OGB_OPEBValuationReport.pdf.
- The Segal Group Inc., State of Connecticut Other Post-Employment Benefits Program: Actuarial Valuation and Review of Other Postemployment Benefits (OPEB) as of June 30, 2011 in Accordance With GASB Statements No. 43 and No. 45, 2, http://www.osc.ct.gov/empret/OPEBActuarialReports/OPEBReport2012.pdf.
- Gabriel Roeder Smith & Co., State of California Retiree Health Benefits Program: GASB Nos. 43 and 45 Actuarial Valuation Report as of June 30, 2009, 56, http://sco.ca.gov/Press-Releases/2010/OPEB_February_2010.pdf; The Segal Group Inc., State of Connecticut Other Post-Employment Benefits Program, 29; Cavanaugh Macdonald Consulting LLC, Georgia State Employees Post-Employment Health Benefit Fund & Georgia School Personnel Post-Employment Health Benefit Fund: Report of the Actuary on the Retiree Medical Valuations—Prepared as of June 30, 2011, 17 and 46, https://dch.georgia.gov/sites/dch.georgia.gov/files/related_files/document/ GA_DCH_06-30-2011_Report-FINAL_06-07-2012.pdf; Aon Hewitt, State of Hawaii Employer-Union Trust Fund, Postemployment Benefits Other Than Pensions: Actuarial Valuation Study (valuation date July 1, 2011), 24, http://files.hawaii.gov/eutf/news/aon-hewitt/2011%20EUTF%20Ret%20Med%20Rpt%202012-06-30%20-rev for%20VB.pdf; Buck Consultants, GASB 45 Actuarial Valuation at 7/1/2011 of the State of Louisiana, 4; and Aon Hewitt, Commonwealth of Massachusetts Postemployment Benefits Other Than Pensions: Actuarial Valuation Fiscal Year Ending June 30, 2011, January 1, 2011 Valuation Date (September 2011), 31, http://www.mass.gov/osc/docs/reports-audits/opeb/2011-opeb-valuation-final.pdf.
- Executive Office of the President of the United States, White House Council of Economic Advisors, Trends in Health Care Cost Growth and the Role of the Affordable Care Act (November 2013), 1, https://www.whitehouse.gov/sites/default/files/docs/ healthcostreport_final_noembargo_v2.pdf.
- Gabriel Roeder Smith & Co., State of California Retiree Health Benefits Program: GASB Nos. 43 and 45 Actuarial Valuation Report, as of June 30, 2011, 14, http://www.sco.ca.gov/Files-EO/CaliforniaGASB45_2011ReportFinal.pdf; Gabriel Roeder Smith & Co., State of California Retiree Health Benefits Program: GASB Nos. 43 and 45 Actuarial Valuation Report, as of June 30, 2012, 14; Gabriel Roeder Smith & Co., State of California Retiree Health Benefits Program GASB Nos. 43 and 45 Actuarial Valuation Report as of June 30, 2013, 14, http://www.sco.ca.gov/Files-EO/CalSCO_GASB45_AVReport_2013_Final.pdf; Cavanaugh Macdonald Consulting LLC, Georgia State Employees Post-Employment Health Benefit Fund (2011), 10 and 41; Cavanaugh Macdonald Consulting LLC, Georgia State Employees Post-Employment. Health Benefit Fund & Georgia School Personnel Post-Employment Health Benefit Fund Report of the Actuary on the Retiree Medical Valuations—Prepared as of June 30, 2012, 11 and 43, https://dch.georgia.gov/sites/dch.georgia.gov/files/related_files/ site_page/GA DCH%2006-30-2012%20Report%2008-08-2013.pdf; Cavanaugh Macdonald Consulting LLC, Georgia State Employees Post-Employment Health Benefit Fund & Georgia School Personnel Post-Employment Health Benefit Fund: Report of the Actuary on the Retiree Medical Valuations—Prepared as of June 30, 2013, 9 and 40, https://dch.georgia.gov/sites/dch.georgia.gov/files/related_files/site_page/GA DCH%2006-30-2013%20Report%20.pdf; and Aon Hewitt, Commonwealth of Massachusetts Postemployment Benefits Other Than Pensions: Actuarial Valuation (2011), 2, http://www.mass.gov/osc/docs/reports-audits/opeb/2011-opeb-valuation-final.pdf; Aon Hewitt, Commonwealth of Massachusetts Postemployment Benefits Other Than Pensions: Actuarial Valuation Fiscal Year Ending June 30, 2012, January 1, 2012 Valuation Date (October 2012), 2, http://www.mass.gov/osc/docs/reports-audits/opeb/2012-opeb-valuation.pdf; and Aon Hewitt, Commonwealth of Massachusetts Postemployment Benefits Other Than Pensions: Actuarial Valuation Fiscal Year Ending June 30, 2013, January 1, Valuation Date(December 2013), 2, http://www.mass.gov/osc/docs/reports-audits/opeb/2013-opeb-valuation.pdf.
- Marcia Van Wagner, Nicholas Samuels, and Emily Raimes, “U.S. State Retiree Health Costs: States Controlling Retiree Health Costs But Teacher Benefits Are Costly for Some,” Moody’s Investors Service Special Comment (Nov. 10, 2014), 7, https://www.moodys.com/research/Moodys-Most-US-state-retiree-health-care-costs-becoming-more--PR_312471.
- Gabriel Roeder Smith & Co., State of Hawaii Retiree Health Care Plan Actuarial Valuation Report as of July 1, 2013, 38, http://eutf.hawaii.gov/wp-content/uploads/2015/04/StateOfHawaiiOPEBFY15-rh.pdf; Gabriel Roeder Smith & Co., State of California Retiree Health Benefits Program (as of June 30, 2013), 61; Buck Consultants, GASB 45 Actuarial Valuation at 7/1/2013 of the State of Louisiana Post-Retirement Benefit Plan for the Office of Group Benefits
(July 2014), 4, http://www.doa.la.gov/osrap/2014OGB_OPEBValuationReport.pdf; The Segal Group Inc., State of Connecticut Other Post-Employment Benefits Program: Actuarial Valuation and Review of Other Postemployment Benefits (OPEB) as of June 30, 2013, in Accordance With GASB Statements No. 43 and No. 45, 30, http://www.osc.ct.gov/empret/OPEBActuarialReports/OPEBReport2014.pdf; Cavanaugh Macdonald Consulting LLC, Georgia State Employees Post-Employment Health Benefit Fund—Prepared as of June 30, 2013, 15 and 45; Aon Hewitt, Commonwealth of Massachusetts Postemployment Benefits Other Than Pensions: Actuarial Valuation (2013), 31. - Standard & Poor’s Ratings Services, “Diverging Trends Underlie Stable Overall U.S. OPEB Liability,” 3.
- CCRC Actuaries LLC, State of West Virginia Public Employees Insurance Agency, 5; and Ernst & Young LLP, Financial Statements, Required Supplementary Information, and Other Financial Information: West Virginia Retiree Health Benefit Trust Fund Years Ended June 30, 2013 and 2012, 5, 12.
- CCRC Actuaries LLC, State of West Virginia Public Employees Insurance Agency, 5.
- Ernst & Young LLP, Financial Statements, Required Supplementary Information, and Other Financial Information: West Virginia Retiree Health Benefit Trust Fund Years Ended June 30, 2014 and 2013 With Report of Independent Auditors, 45, http://www.peia.wv.gov/Forms-Downloads/Documents/financial_reports/independent auditors reports/rhbt/Basic_Financial_Statements_Required_Supplementary_ Information_Other_Financial_Information_Fiscal_Years_2013-2014.pdf.
- Hawaii Department of Budget & Finance, “State of Hawaii Begins Paying Down Retiree Benefits Liability,” news release, June 23, 2014, http://budget.hawaii.gov/wp-content/uploads/2014/07/RELEASE-State-of-Hawaii-Begins-Paying-Down-Retiree-Benefits-Liability-6-23-14.pdf; and Hawaii Department of Accounting and General Services, State of Hawaii Comprehensive Annual Financial Report for the Fiscal Year Ended June 30, 2014, 94, http://ags.hawaii.gov/wp-content/uploads/2012/09/soh-cafr-20140630.pdf.
- Actuarial valuations are financial accounting reports produced by state OPEB plans that use actuarial methods and assumptions to calculate OPEB liabilities and fulfill GASB reporting requirements.
- For more on the inclusion of local workers in state reports, see Table A1 in Lutz and Sheiner, The Fiscal Stress Arising From State and Local Retiree Health Obligations.
- Bureau of Economic Analysis, “Table 1.1.9: Implicit Price Deflators for Gross Domestic Product,” accessed May 7, 2015, http://www.bea.gov/iTable/iTable.cfm?reqid=9&step=3&isuri=1&903=13#reqid=9&step=3&isuri=1&903=13.
- GASB statements 74 and 75—Financial Reporting for Postemployment Benefit Plans Other Than Pension Plans and Accounting and Financial Reporting for Postemployment Benefits Other Than Pensions, respectively—will replace GASB statements 25, 43, 45, 50, and 57.


ADDITIONAL RESOURCES

Fact Sheet

Article


