More Federal Funding Needed to Improve Drinking Water, EPA Study Finds
Deteriorating infrastructure and need for lead abatement drive rising costs for cities and states

Water utilities throughout the United States will need to spend $625 billion over the next 20 years to fix, maintain, and improve the country’s drinking water infrastructure, according to the results of a periodic assessment done by the Environmental Protection Agency (EPA).
That key finding of the survey, completed in 2021 and finalized in a report to Congress in September, represents a 33% increase, not accounting for inflation, from the almost $469 billion reported in the 2015 version of the Drinking Water Infrastructure Needs Survey and Assessment (DWINSA). The growth highlights a rapidly escalating need that far exceeds recent federal investments provided through the 2021 Infrastructure Investment and Jobs Act (IIJA). Distribution and transmission needs, which include replacing or repairing deteriorating or aging pipelines, increased more than the other categories from the last DWINSA—from $310 billion to $421 billion, a 36% increase, not accounting for inflation.
The EPA is using the results of this latest assessment to distribute federal funds targeting improvements to the nation’s drinking water systems. The money includes the remainder of the nearly $12 billion that was to be allocated between fiscal years 2022 and 2026 in the IIJA General Supplemental fund as well as $4 billion over the same period for projects that address emerging contaminants in drinking water.
Figure 1
Estimated 20-Year Cost of Drinking Water Upgrades Has Risen Sharply
Latest EPA assessment shows big increase in national need compared with previous survey
| Total National Need (Current Year Dollars) | Total National Need (2021 Dollars) | Nominal Percent Change From Previous Assessment | |
|---|---|---|---|
| 1st- 1995 | $137.1B | $292.8B | - |
| 2nd - 1999 | $148.7B | $288.2B | 8.5% |
| 3rd- 2003 | $274.3B | $484.6B | 84.5% |
| 4th - 2007 | $331.9B | $489.7B | 21.0% |
| 5th - 2011 | $380.9B | $495.5B | 14.8% |
| 6th - 2015 | $468.8B | $546.6B | 23.1% |
| 7th - 2021 | $625.0B | $625.0B | 33.3% |
|
Notes: The totals reflect the expected costs of infrastructure work on the drinking water system over the next 20 years. Total National Need adjusted to 2021 dollars with the Construction Cost Index, as done by the Environment Protection Agency in previous Drinking Water Infrastructure Needs Survey and Assessment reports. Sources: EPA's 6th Drinking Water Infrastructure Needs Survey and Assessment done in 2015 and the 7th Drinking Water Infrastructure Needs Survey and Assessment |
Under the Safe Drinking Water Act, amended in 1996, the EPA has been required to conduct a detailed analysis periodically, typically every four years, to assess each state’s 20-year drinking water infrastructure need.
The survey collects data across four major categories critical to the availability of safe drinking water: source, storage, distribution and transmission, and treatment. The agency then uses the findings to develop an allocation formula to distribute Drinking Water State Revolving Fund allotments.


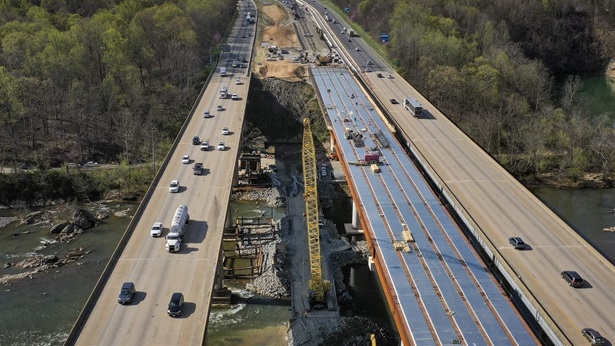
Failing infrastructure likely explains much of increased need in many states. For example, the city of Baltimore, which provides drinking water to nearly 2 million people in the metropolitan area, averages 1,000 pipe and water main breaks a year, owing to aging infrastructure that makes the water system unreliable. As a result, more than half of the city’s water budget is consumed by infrastructure repairs and replacements. In California, meanwhile, a state auditor report published in 2022 found that more than 300 water systems in the state could be classified as “failing” every year since 2017, affecting more than 1 million residents. Similarly, a 2017 New York comptroller’s report detailed issues with several of that state’s water infrastructure systems, including excessive water loss, and estimated that nearly $40 billion in repairs would be needed over the next 20 years.
As localities delay repairs because of budget shortages, the problems continue to grow and become more expensive. And although water utilities do not typically affect state balance sheets directly (most U.S. water systems are owned and maintained at the local level), the cost of mitigating water emergencies has increasingly become an issue in the nation’s statehouses. For example, the Flint water crisis cost the state of Michigan $87 million between 2017 and 2020 for identification and replacement of lead and galvanized steel lines, plus more than $600 million in settlements with residents. And in Texas, following a year of drought and statewide depleted water supplies, lawmakers passed a series of bills that could divert $1 billion of the state’s budget surplus to new water projects and infrastructure repairs. The state lost around 130 billion gallons of water in 2021 due to failing infrastructure, further increasing the strain on an already shrinking water supply. The EPA released a fact sheet in 2016 projecting that Texas could lose more than $115 billion a year if water supply concerns continue through 2060, further demonstrating that states will increasingly be left to grapple with failing local infrastructure.


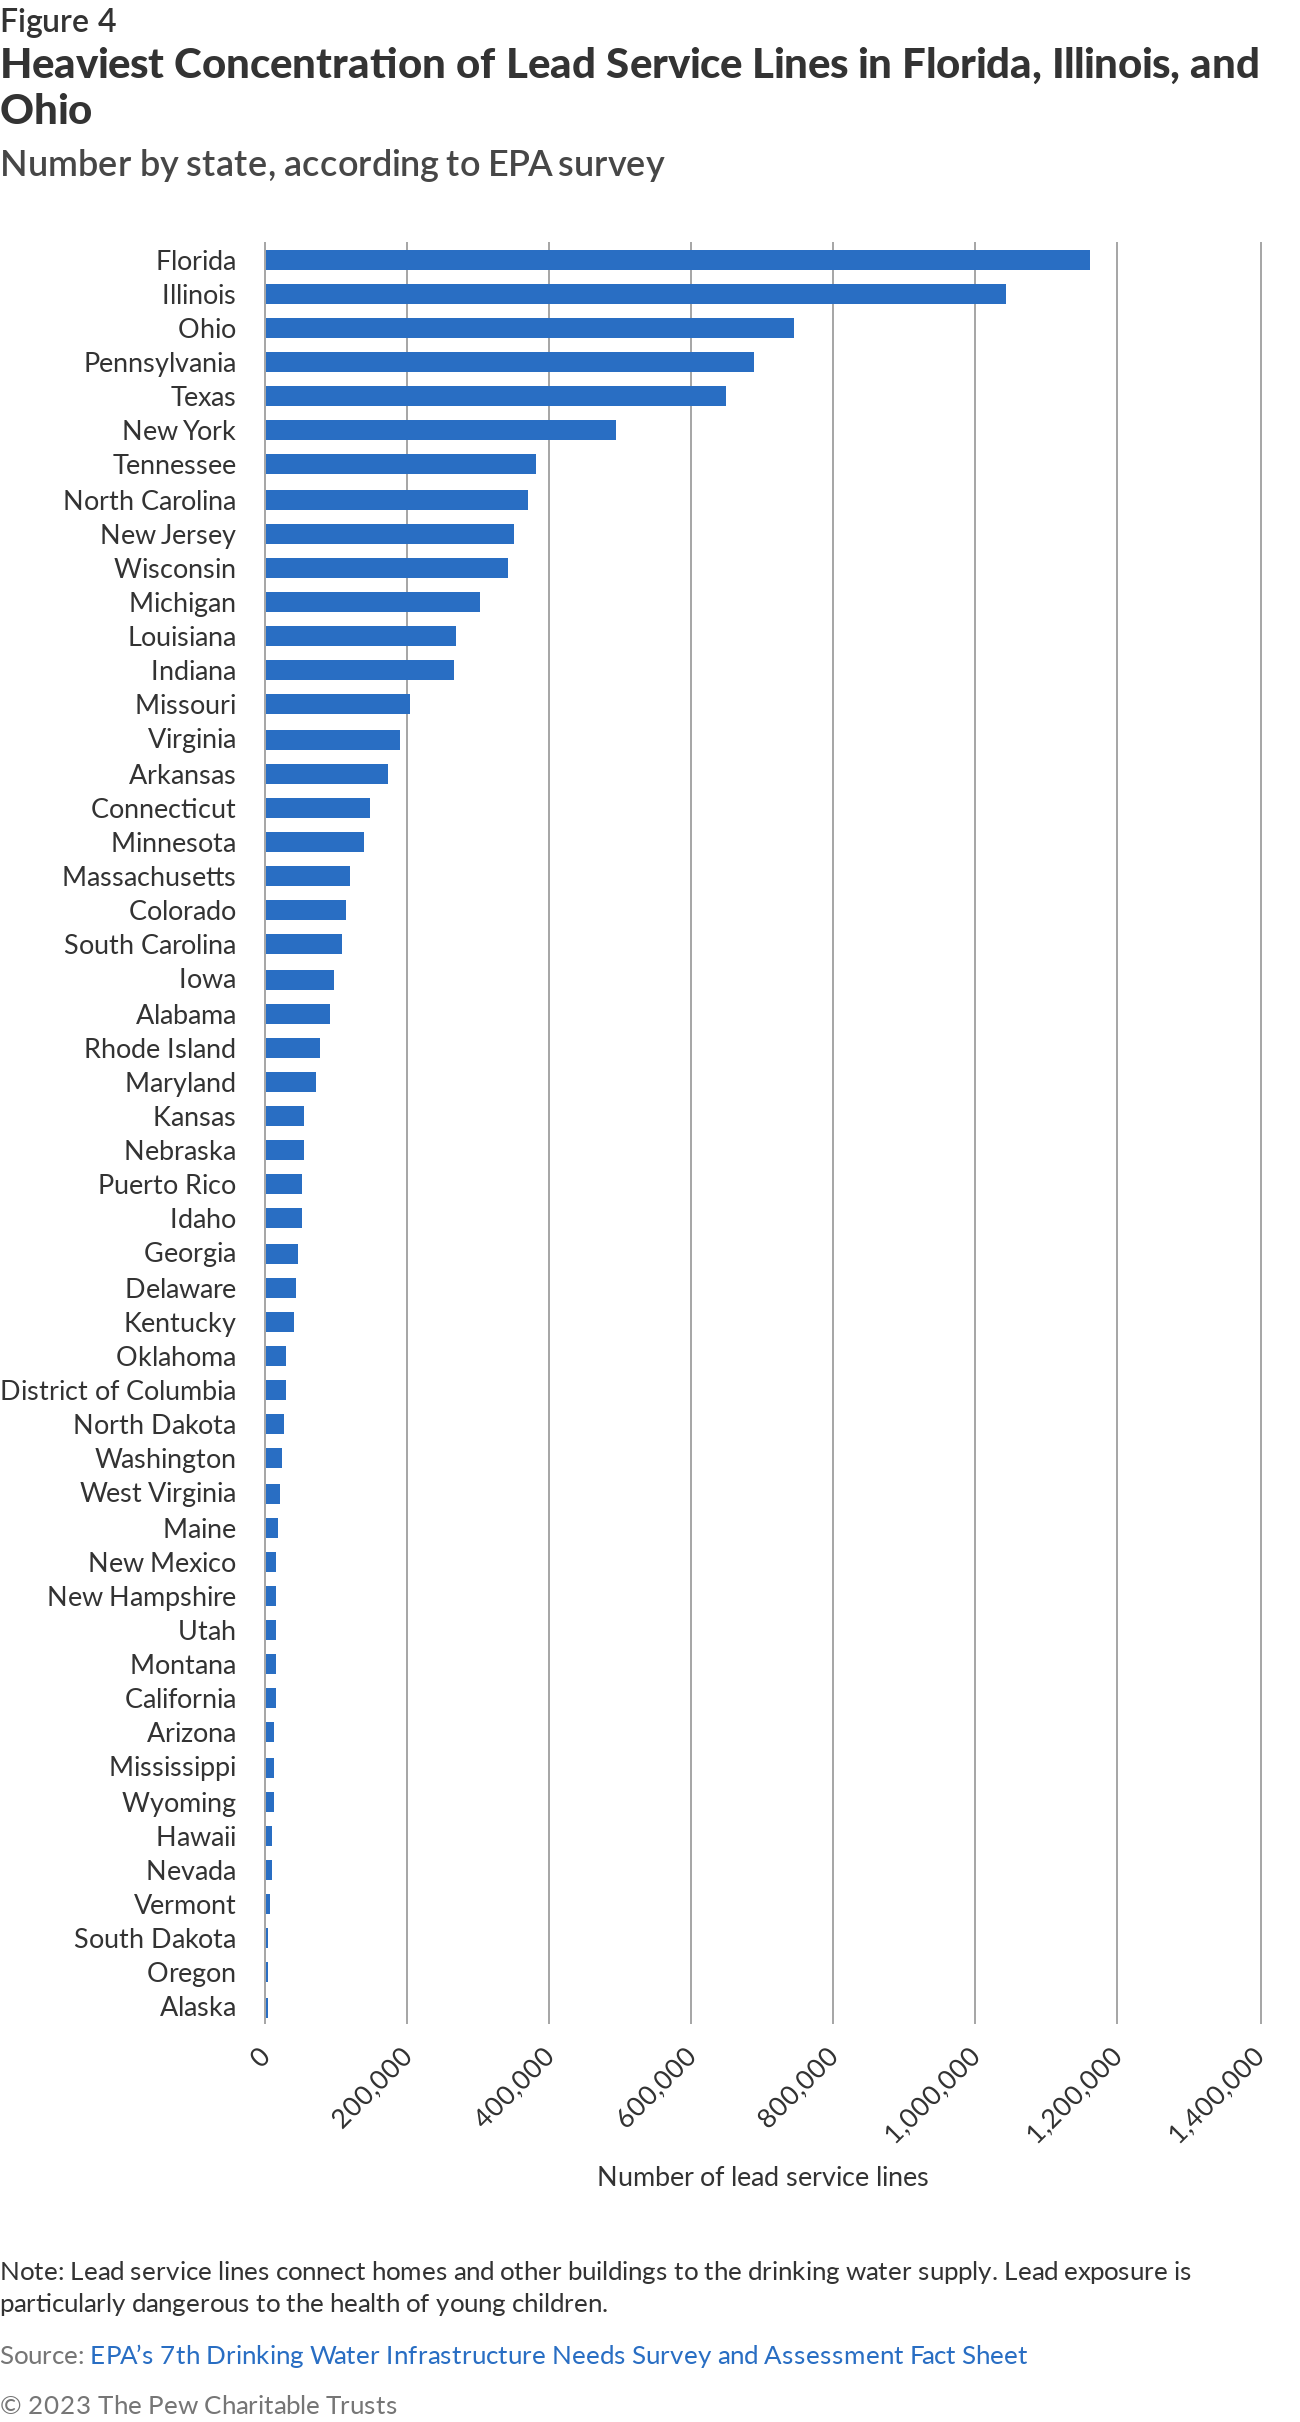
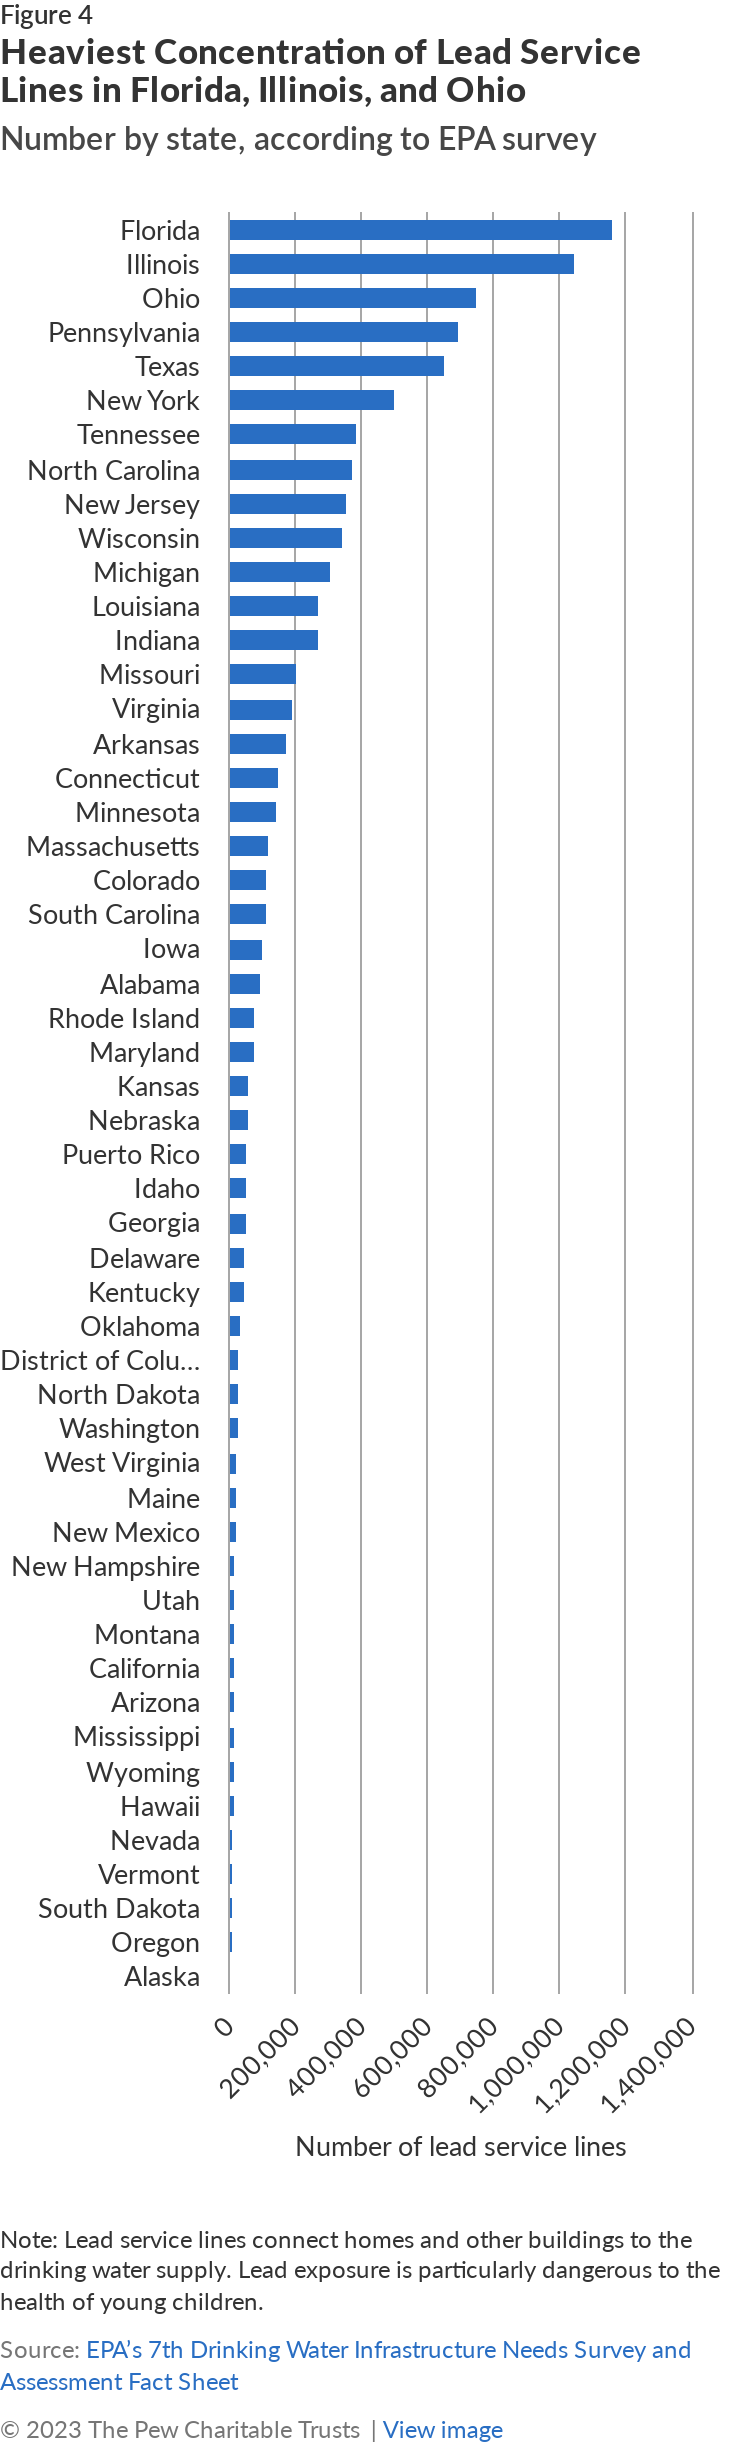
Importantly, the new DWINSA survey includes detailed information on lead service lines for the first time. These lines, which connect homes and other buildings to the water supply, are dangerous particularly because of the hazard that lead exposure poses to children. The EPA plans to use the new data to allocate about $12 billion provided in the IIJA for lead service line identification and replacement between fiscal years 2023 and 2026, to complete the distribution of the $15 billion Congress allocated -- with $3 billion having already been distributed in fiscal 2022. But the data suggests that this amount is unlikely to eliminate the problem: The survey found that there are nearly 9.2 million lead service lines in the U.S., with the heaviest concentration in Florida, Illinois, and Ohio. The EPA estimates that the average cost of replacing a line is $4,700, meaning that public water systems would need more than $43 billion to replace all of their lead service lines.
The latest DWINSA indicates that the financial needs of U.S. water systems are growing rapidly, in large part because of aging infrastructure and a growing backlog of necessary repairs. Although the water funding provided through the IIJA may help close the gap for some water systems, the 20-year drinking water need identified in the EPA survey points to a long-term problem that will be solved only through consistent investment by already cash-strapped water systems. And even though these systems are managed at the local level, states may increasingly be on the hook for helping solve drinking water infrastructure problems that—if not addressed—will turn into statewide issues.
Mollie Mills works on Pew’s state fiscal policy project.


America’s Overdose Crisis
Sign up for our five-email course explaining the overdose crisis in America, the state of treatment access, and ways to improve care
Sign up
State Infrastructure Financing


Public Infrastructure Investment Challenges Persist

States Using Pandemic Funds to Boost Critical Infrastructure
ADDITIONAL RESOURCES
Article

Fact Sheet