Business Recovery Dashboard Illustrates Philadelphia's Pandemic Pain and Rebound
9 interactive charts provide a freeze-frame picture of the economic recovery

The interactive dashboard on Philadelphia businesses and jobs produced by The Pew Charitable Trusts for leaders and citizens during the COVID-19 pandemic offered a quarterly look at the city’s struggles and recovery progress. Now that the data is no longer being updated, one of the dashboard’s top takeaways was a positive one: Smaller businesses led the city’s job recovery and ultimately increased their share of total employment.
With the official end of the federal COVID-19 emergency in May 2023, the dashboard now serves as a statistical freeze frame on Philadelphia jobs and businesses through most of the roller-coaster period that started in March 2020 and lasted for about three years.
In nine interactive charts, the dashboard shows when jobs plummeted and recovered in various sectors, what kind of firms ran late on bills, and how much employers boosted wages to retain and attract workers, among other things. Additional analyses of the underlying data, plus other metrics, show how Philadelphia’s business and labor landscape looks a little different today than it did before the pandemic.
Smaller businesses can and often do react to economic downturns/turmoil faster than larger businesses. During the pandemic, Philadelphia’s smallest businesses cut jobs deepest but also restored them fastest. By September 2022, the latest data available, Philadelphia businesses with 499 or fewer employees were providing 41% of all jobs in the city, their highest share since 2017. Although still below the share nationally for businesses of that size, the uptick reversed, at least so far, the city’s pre-pandemic weakness in small-business employment.
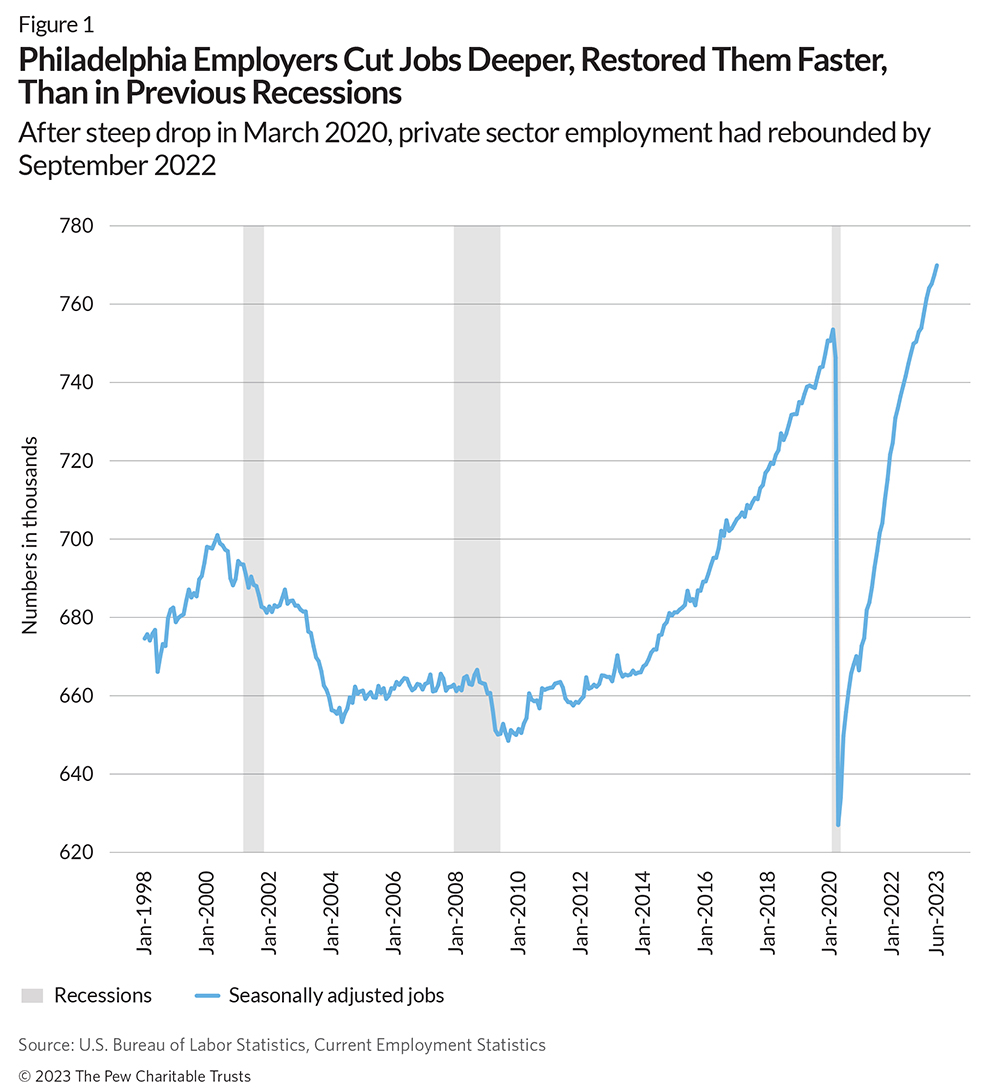
The dashboard also shows that total employment recovered quicker after the short pandemic-related recession than after two prior, longer recessions. (See Figure 1.) According to data from the jobs-by-sector chart, the period between the initial deep cuts in March 2020 and return to the pre-pandemic total (750,400 nonfarm jobs, not seasonally adjusted) was 31 months—March 2020 to September 2022. Attaining that kind of rebound took 35 months after the start of the 2007-2009 Great Recession, and 175 months following the start of the “dot com” recession of 2001-2003. Philadelphia’s job recovery pace was similar to the pace in other big cities but slower than the nation as a whole.
Economic shocks typically affect not just total jobs, but also the distribution of jobs across industry sectors. During the pandemic period, Philadelphia’s biggest job sector, health care and social assistance, grew slightly from annual averages of 23% of all jobs in 2019 to 24% in 2023. Government remained the second biggest. The city’s professional and technical sector added enough jobs to nearly tie educational services for third largest, each representing around 9% of all jobs. But the pandemic bumped the accommodations and food sector down to fifth from fourth, accounting for below 8% of all jobs as of mid-2023. That sector is still recovering.
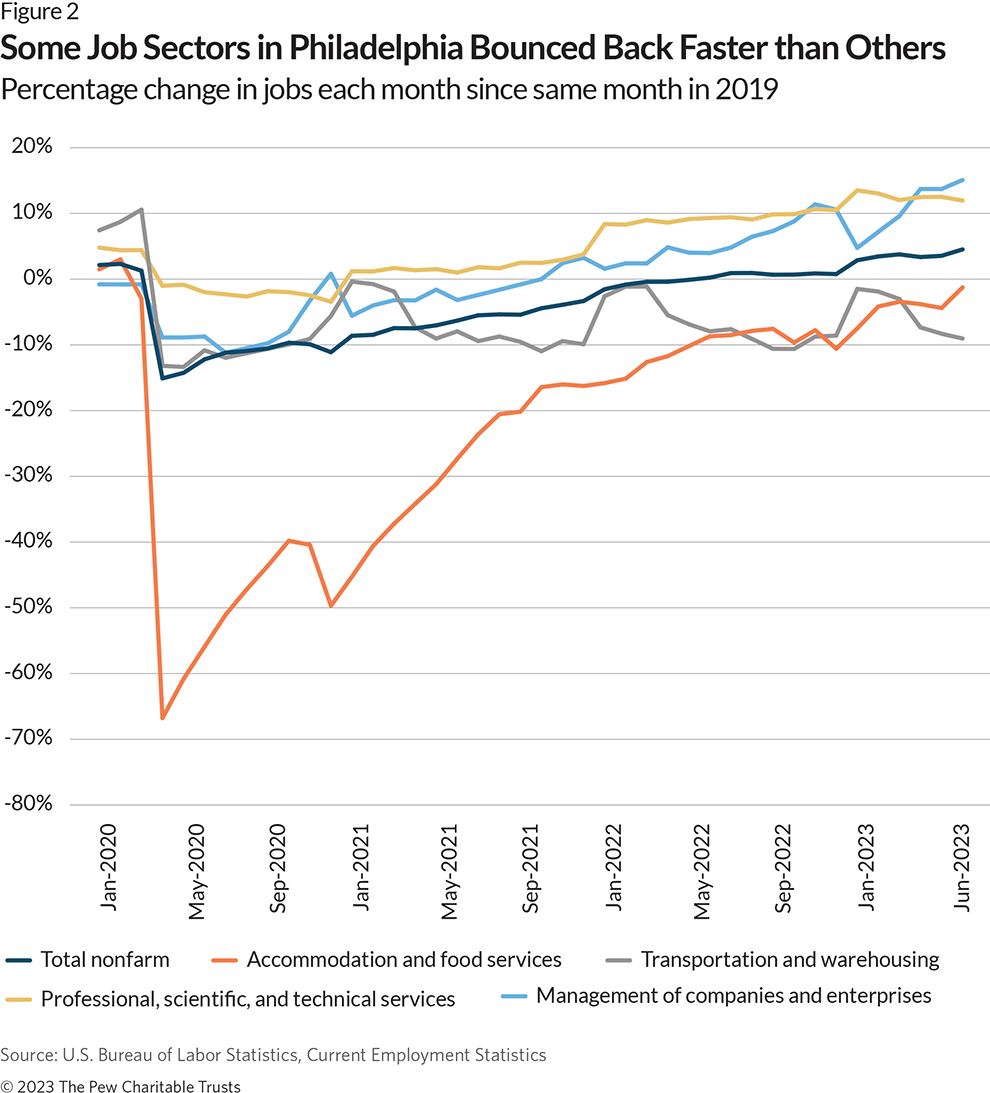
Businesses that could adapt to remote work tended to restore the most jobs. The biggest were finance and insurance; professional, technical, and scientific services; and management of companies (for example, bank holding companies). Those relying on in-person services were still below pre-pandemic employment as of mid-2023, including accommodations and food, and transportation and warehousing. (See Figure 2.)
For workers, the pandemic brought health and job risks, burnout, and eventually raises. From December 2019 to December 2022, the last period in dashboard data, the average hourly pay for private-sector hourly and salaried Philadelphia jobs rose 11% from $34.95 to $38.80, slightly below the pace of raises over a three-year period before the pandemic. Restaurant and hotel workers got the biggest raise, 24.7%, which may be helping to buoy the sector’s ongoing recovery. The smallest raise over the time period, 3.3%, which was below the rate of inflation, went to workers in the arts, entertainment, and cultural sector.
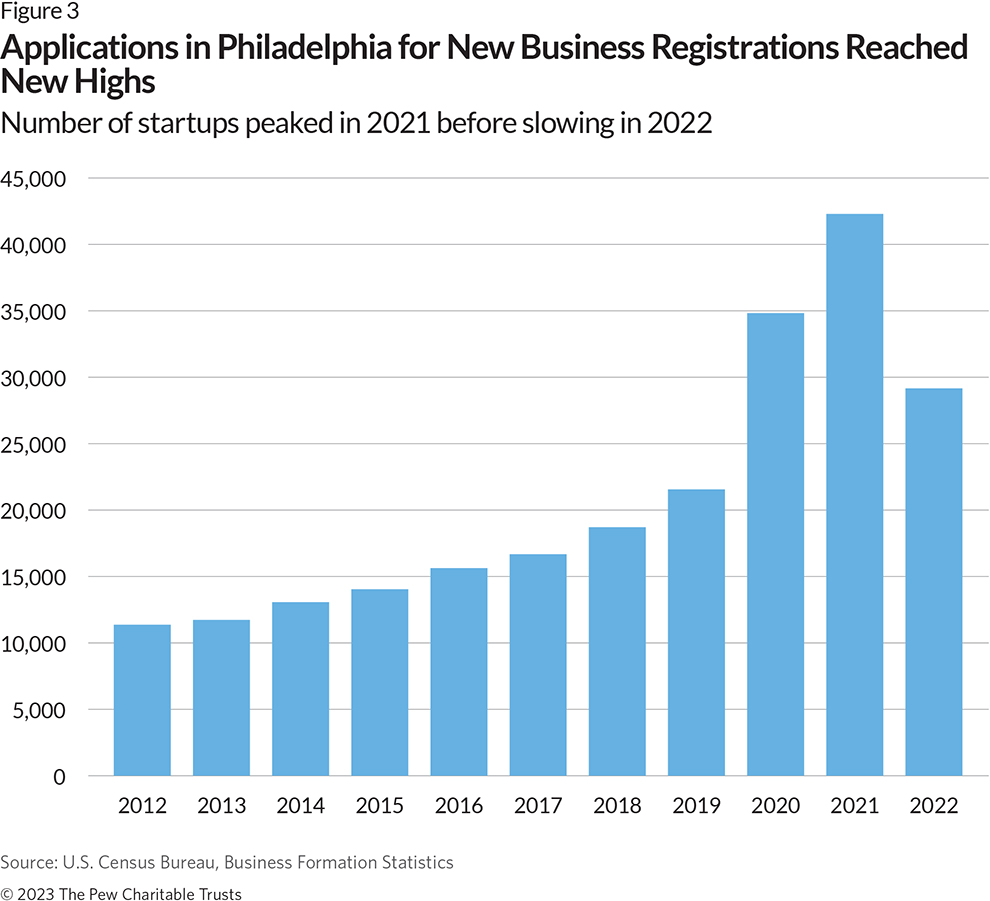
By December 2022, Philadelphia firms were operating 35,336 worksites with employees, 1.4% more than in March 2020. The data does not make clear how many were wholly new companies, or just new offices or divisions. At least some were startups: The number of applications for employer identification numbers in Philadelphia rose 35% from 2019 to 2022, a surge mirroring national trends and much bigger than typical following a recession, according to Census data not in the dashboard. Past research suggests that businesses launched during a recession are particularly vulnerable to failure, start smaller, and experience lower growth trajectories than businesses launched in better economic times. (See Figure 3.)
Through the pandemic, the credit health of Philadelphia businesses swung through ups and downs. The percentage seriously late on their bills soared in late 2020—when government aid started to become more limited—but then sloped down for two years, falling below pre-pandemic levels. Meanwhile, the median balance on credit accounts rose over most of the period, as companies revved up for growth, or took on more debt to survive, or both. The dashboard provides details on these credit levels during the pandemic period.
In summary, the 38-month public health emergency and the initial three-month recession brought a lot of pain and some transformation to Philadelphia jobs and businesses. Pew’s dashboard, although no longer being updated, remains available online to provide insights about this unprecedented period.
Thomas Ginsberg researches topics including businesses, jobs, the economy, and demographics for The Pew Charitable Trusts’ Philadelphia research and policy initiative.


America’s Overdose Crisis
Sign up for our five-email course explaining the overdose crisis in America, the state of treatment access, and ways to improve care
Sign up

The Pandemic's Effects on Philadelphia's Economy and Jobs


How Philadelphia's Economy Is Recovering
