Migration in America

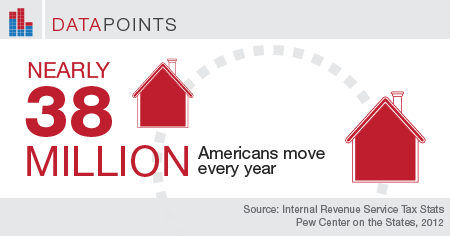
Forbes magazine recently updated its excellent American Migration interactive map, which uses data from the Internal Revenue Service Tax Stats to illustrate that approximately 37.5 million Americans move homes every year.

Geographic mobility is one of the main challenges election officials face when trying to maintain the most up to date and accurate voter registration lists possible. Having the most current information about how many people are living in the jurisdiction and their demographic characteristics helps election officials better allocate resources during an election season.

The Forbes map, which details how many people are migrating into and out of every county in the nation, where they are moving to, and their per-capita income, offers a unique picture of this constant mobility.

Spotlight on Mental Health

Composite image of modern city network communication concept

Learn the Basics of Broadband from Our Limited Series

Sign up for our four-week email course on Broadband Basics

Quick View

How does broadband internet reach our homes, phones, and tablets? What kind of infrastructure connects us all together? What are the major barriers to broadband access for American communities?

Pills illustration
Pills illustration

What Is Antibiotic Resistance—and How Can We Fight It?

Sign up for our four-week email series The Race Against Resistance.

Quick View

Antibiotic-resistant bacteria, also known as “superbugs,” are a major threat to modern medicine. But how does resistance work, and what can we do to slow the spread? Read personal stories, expert accounts, and more for the answers to those questions in our four-week email series: Slowing Superbugs.

Explore Pew’s new and improved
Fiscal 50 interactive

Your state's stats are more accessible than ever with our new and improved Fiscal 50 interactive:

  • Maps, trends, and customizable charts
  • 50-state rankings
  • Analysis of what it all means
  • Shareable graphics and downloadable data
  • Proven fiscal policy strategies

Explore

Welcome to the new Fiscal 50

Key changes include:

  • State pages that help you keep track of trends in your home state and provide national and regional context.
  • Interactive indicator pages with highly customizable and shareable data visualizations.
  • A Budget Threads feature that offers Pew’s read on the latest state fiscal news.

Learn more about the new and improved Fiscal 50.