Case Studies of Harvest Strategies in Global Fisheries
Charting the course of future tuna management
 © The Pew Charitable Trusts
An examination of existing harvest strategies showcases the range of approaches and what success can look like.
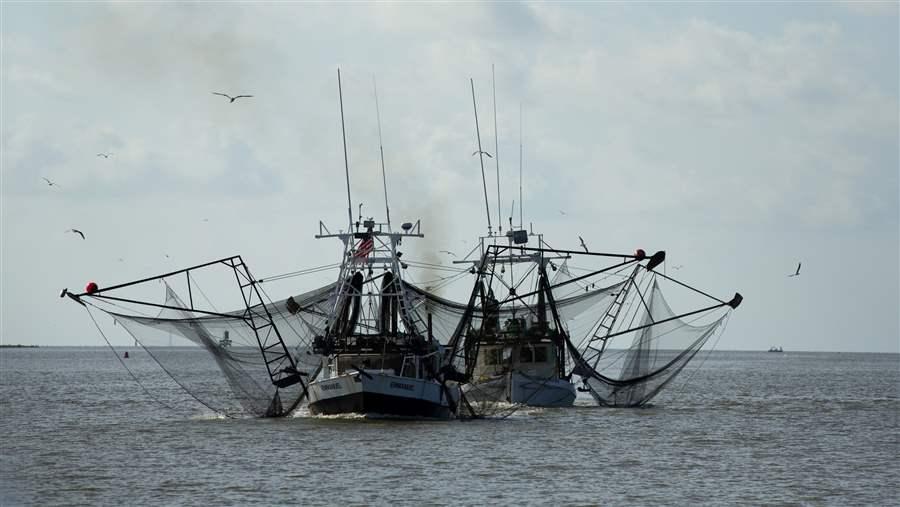
Harvest strategies, also known as management procedures (MPs), are pre-agreed frameworks for making fisheries management decisions, such as setting quotas. Although different management bodies name and define them slightly differently, all harvest strategies include the same basic elements: a monitoring program; indicators of the fishery’s status and health, with associated reference points; a method to assess the value of the chosen indicators; and harvest control rules (HCRs) that trigger management actions, depending on whether key indicators are close to or surpass the reference points.
This 21st-century fisheries management tool is already being used to improve management in international and domestic fisheries around the world. It can be used for data-poor and data-rich stocks.1 When detailed data are available, the indicators often relate to population biomass and fishing mortality, while the assessment method is a quantitative stock assessment model, and the applied HCR is model-based. For stocks with limited data, the indicators are often directly measurable, the assessment method can be a relatively simple statistical or algorithmic calculation, and the applied HCR is empirical. In an empirical HCR, data are used directly to set the quotas rather than tuning the HCR to the results of a stock assessment or other modeling exercise.
The management strategy evaluation (MSE) process allows for simulation testing to develop robust harvest strategies. These frameworks evaluate a range of candidate harvest strategies to demonstrate scientifically which one is most likely to achieve the intended management objectives, despite uncertainties in ecological understanding, monitoring and implementation of regulations. MSE relies on characterizing these uncertainties, rather than ignoring them, and finding harvest strategies that remain effective despite these uncertainties. Since not every scenario can be anticipated and tested, many harvest strategies include exceptional circumstances clauses. These provisions provide guidance on what to do when presented with situations that the MSE did not test or that go beyond the scenarios a harvest strategy was designed to manage.
Robust and precautionary harvest strategies benefit both the fish and fishermen. Paired with an effective compliance regime, harvest strategies offset scientific uncertainty, natural variability and political influence. This process helps overfished stocks recover or maintains populations and fisheries at their targets. Sound harvest strategies increase transparency and predictability of fisheries management, which promotes industry stability. They also improve market access, given that some sustainable seafood certification programs, including the Marine Stewardship Council (MSC), require that fisheries have harvest strategies in place.
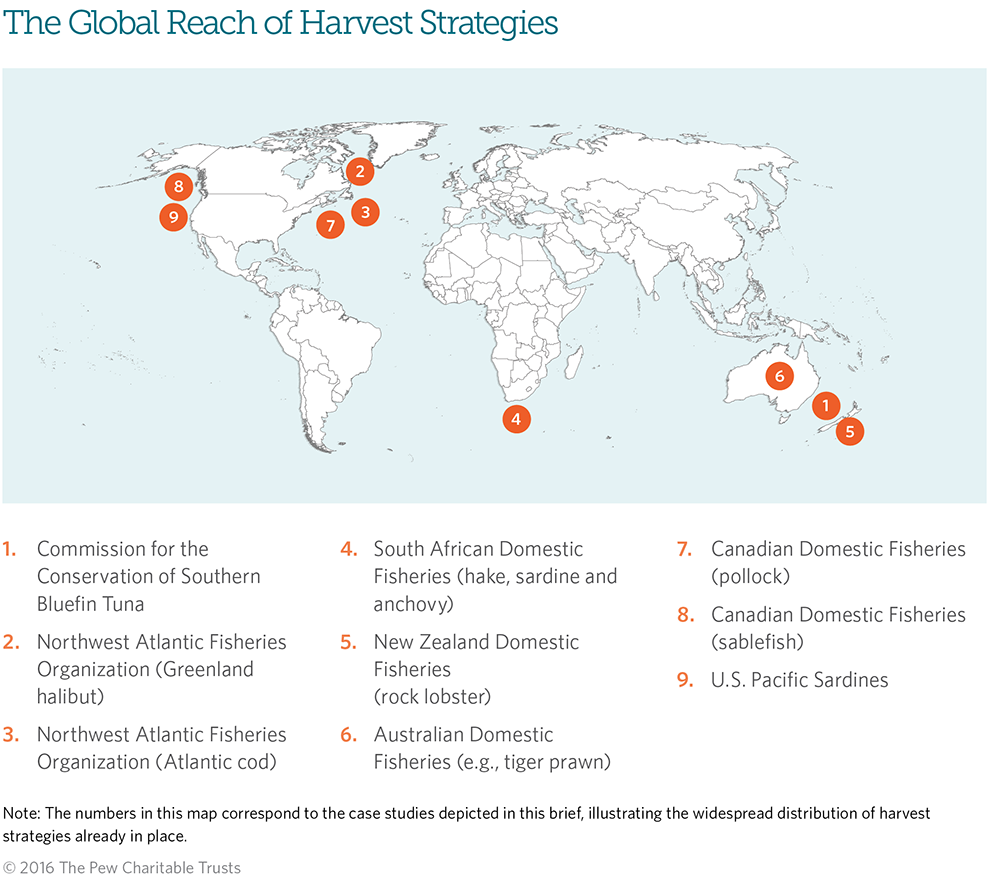
An examination of existing harvest strategies showcases the range of approaches and what success can look like. As management bodies, including the regional fisheries management organizations (RFMOs) focused on tunas, develop these strategies, policymakers, scientists and stakeholders can gain insight from reviewing the designs and implementation processes for the harvest strategies already in use.
 © CSIRO Marine Research
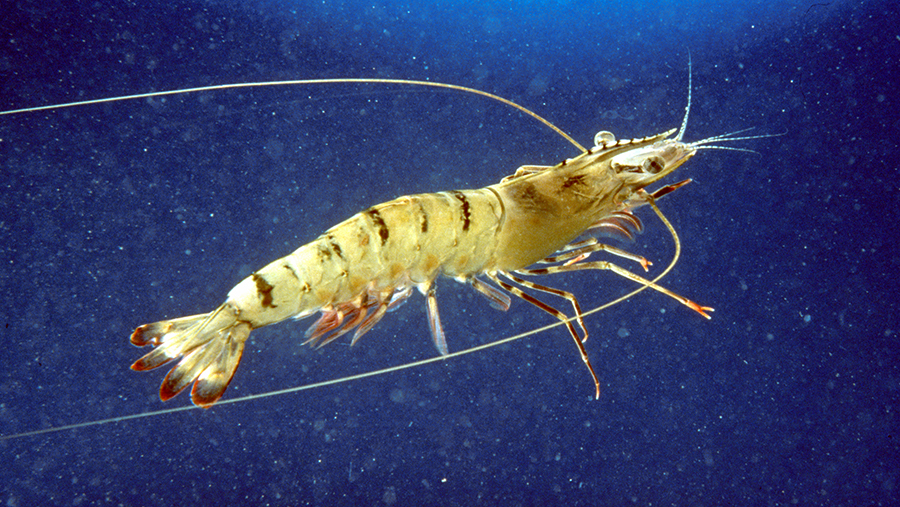
Tiger prawn (Penaeus spp).
Commission for the Conservation of Southern Bluefin Tuna (CCSBT)
The CCSBT in 2011 adopted an MP for southern bluefin tuna, which are found in waters across the southern hemisphere.2 This species is among the world’s most depleted tuna stocks, listed as Critically Endangered by the International Union for Conservation of Nature (IUCN). The organization began to develop a management procedure in 2002 after years of traditional management failed to reverse stock declines. At that time, scientists projected this species would need more than a decade to rebuild, even if all fishing stopped. The strategy took nine years to develop, and those involved had to start over halfway through after discovering significant underreporting of catches. Managers and scientists conducted the bulk of the work in less than five years, including development of a full MSE and negotiation of the MP.
They agreed that the overarching objective of the MP would be to rebuild the spawning stock biomass (SSB) to 20 percent of its unfished level (i.e., 20%SSB0) by 2035. The MP sets quotas to ensure at least a 70 percent chance of success. Importantly, once the stock is rebuilt to this interim level, 20%SSB0 will be considered the limit reference point (LRP). This will then trigger adoption of a long-term target reference point (TRP) set at SSBMSY—the spawning stock biomass that will produce maximum sustainable yield (MSY). Currently, that is estimated at 24%SSB0. This illustrates how harvest strategies can be designed and used to rebuild a stock and later shift to maintaining the population at the target level.
The MP for southern bluefin tuna contains an empirical HCR. Quotas are set for three-year periods based on two data sources: an aerial survey of juveniles and a longline catch per unit effort (CPUE) index of older immature fish. The harvest strategy also limits the annual shift up or down in the quota to 100 to 3,000 metric tons (mt), roughly equivalent to a maximum 20 percent change from one year to the next.
Since managers agreed to the strategy in 2011, quotas have increased annually, and the biomass of fish 10 years old and older has increased from 5 percent to 9 percent of the unfished level, demonstrating considerable success for this new management approach.
Northwest Atlantic Fisheries Organization (NAFO)
NAFO manages fish stocks in the northwest Atlantic Ocean. The intergovernmental body established its Joint Fisheries Commission-Scientific Council Working Group on Risk-Based Management Strategies3 in 2013. The group is guiding development of harvest strategies for NAFO stocks, including management objectives and performance statistics, in accordance with its precautionary approach framework.4 NAFO already has harvest strategies in place for Greenland halibut and Atlantic cod:
- Greenland halibut, Subarea 2, Divisions 3KLMNO, off Newfoundland and Labrador, Canada: NAFO adopted an MP for Greenland halibut based on an MSE in 2010 after a two-year development period. The objective is to maintain the biomass of fish five years old and older at 140,000 mt, on average, a level that will allow for a stable, long-term yield. The HCR is considered empirical because it stipulates that the total allowable catch (TAC) be set by a formula based on three research surveys. It also limits annual changes in quota, which can be raised or lowered by no more than 5 percent. The organization established an Exceptional Circumstances Protocol that provides an alternative process for setting the TAC if the dynamics are outside the range of possibilities tested by the MSE. It has been triggered every year since 2011 because of extreme results collected by two of the surveys. NAFO reviewed its harvest strategy in 2013 and continued it until 2017, when the next review will occur.
- Atlantic cod in 3NO Area of the southern Grand Banks off Newfoundland, Canada: An HCR for cod in the waters known as the 3NO Area has been in place since 2007, though the directed fishery has been under moratorium since 1994 to give the stock an opportunity to rebuild. LRPs have been set for adult biomass (BLIM=60,000 mt) and fishing mortality (FLIM=0.3). Since the Atlantic cod is a recovering stock, there are interim (rebuild SSB above BLIM) and long-term (maintain the stock at or near BMSY) management objectives.5 Interim TRPs are set at an SSB of 185,000 mt (BTARGET) and a fishing mortality rate of F0.1 (0.19). In addition, an intermediate stock reference point has been set at twice the BLIM (BISR=120,000 mt), providing a buffer, or security margin, during rebuilding.
The HCR sets TACs for three-year periods, though the fishery will remain closed until there is a “very low” probability—defined as less than 10 percent likelihood—of being below BLIM. Once the fishery can reopen, the catch limit will be set to result in continued SSB growth, low probability (20 percent or less) of SSB declining below BLIM in the next three years, and F less than F0.1. The HCR requires slightly different responses based on whether the population is above or below BISR and BTARGET. The current HCR has not been evaluated using MSE, but analyses of alternative rules are planned as the biomass approaches BLIM. For the Atlantic cod, adult biomass has increased considerably since 2010 but is still at just 64 percent of the LRP.6 Therefore, the fishery remains closed and bycatch is “restricted to unavoidable bycatch.”
 © NOAA/CBNMS
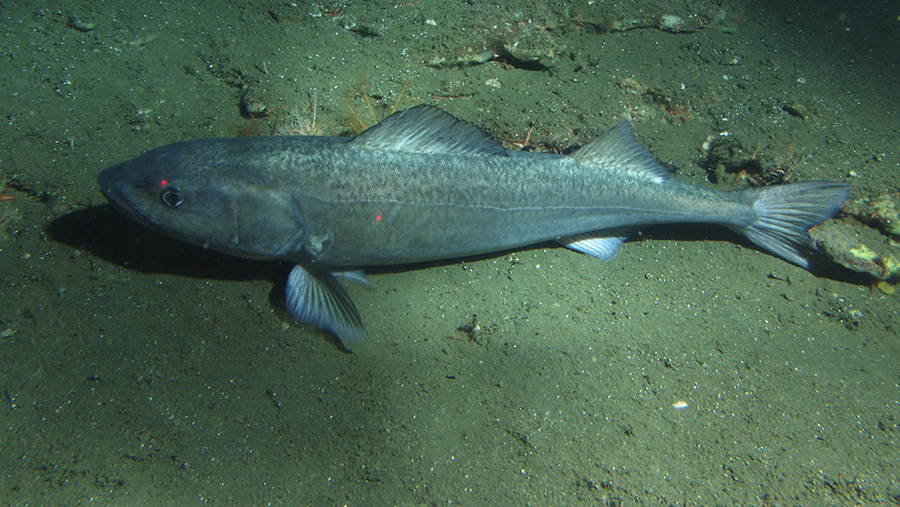
Sablefish (Anoplopoma fimbria).
South African Domestic Fisheries
South Africa uses MPs for many of its domestic fisheries and is considered a pioneer in their use. For example:
- Hake: The hake trawl fishery is the nation’s most important and is among the world’s first to be managed using an MP. The harvest strategy for hake has been revised several times since it was adopted in 1990. The current version is empirical and covers both shallow-water and deepwater species. The TAC is based on CPUE estimates and research surveys.7 Increases are limited to 10 percent per year—with the constraint that the TAC cannot exceed 150,000 mt. Decreases in allowable catch are limited to 5 percent per year unless one of the species’ biomass indices falls too low. The HCR is designed to give a median catch of 135,000 mt a year through 2024 while ensuring that the median spawning biomass of the deepwater hake does not fall below SSBMSY. The LRP for deepwater hake is set at the median 2007 biomass level. MPs for hake are reviewed every four years to ensure that they are performing as expected. To date, South Africa is seeing steadily increasing CPUE since implementation. Officials estimate that both species are fully rebuilt, with SSB greater than SSBMSY, the TRP. The hake trawl fishery is Africa’s only finfish fishery to be certified as sustainable by the MSC.
- Sardine and anchovy:8 South Africa implemented MPs for the sardine and anchovy fisheries in 1994, and both have been revised several times. The procedures contain empirical HCRs, with the TAC based on survey- estimated adult biomass and juvenile recruitment, a measure of young fish. The HCR seeks to maintain a constant fishing mortality rate but could lead to management action when the survey-estimated biomass is at high or low levels. The HCR contains limits on maximum and minimum TAC levels, as well as limits on year-to-year increases and decreases (15 or 25 percent, depending on the stock). The likelihood of the stock falling below historic biomass levels must be less than 10 percent or less than 30 percent, depending on the benchmark level. The HCR stipulates that fishing should be suspended if the survey-estimated biomass falls below 25 percent of the exceptional circumstance level, a threshold to be avoided. Interestingly, the HCR also specifies how to set total allowable bycatch (TAB).
New Zealand Domestic Fisheries
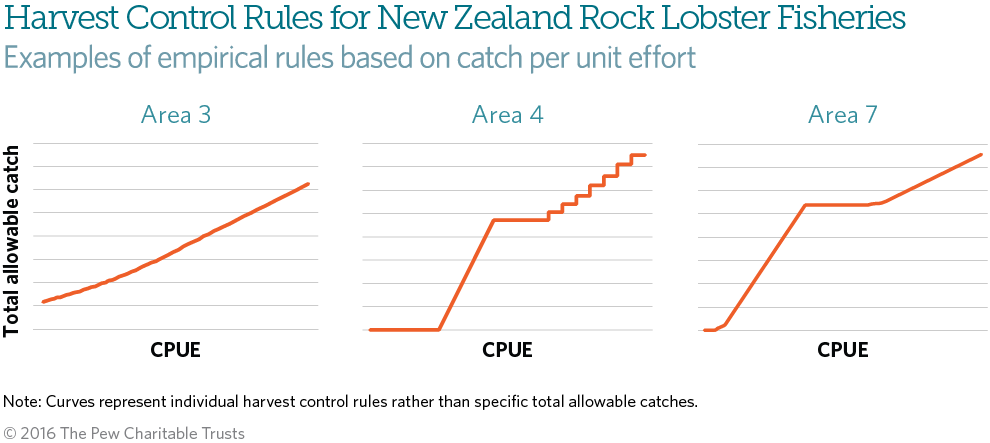
New Zealand started using harvest strategies for its rock lobster fisheries in 1997.9 After a history of boom-and- bust fisheries using traditional management approaches, the country decided to try harvest strategies to rebuild the stocks, intending to then have a high probability of maintaining the stocks above reference levels. Five of New Zealand’s 10 rock lobster areas are managed using harvest strategies, which are reviewed every five years and modified as needed. New Zealand manages its domestic fisheries using its 2008 Harvest Strategy Standard.10 That document dictates that harvest strategies be designed to ensure that the following objectives are met:
- Achieve the MSY-compatible target or better with at least 50 percent likelihood.
- Limit the risk of breaching the soft limit to no more than 10 percent; breaching a soft limit leads to a rebuilding plan. The default soft limit is not specified, but 20 percent of unfished biomass (B0) is commonly used.
- Limit the risk of breaching the hard limit to no more than 2 percent; breaching a hard limit typically leads to fishery closure. The default hard limit is 25 percent BMSY or 10 percent B0, whichever is higher.
As applied to rock lobster, the target is BMSY, or a historical stock size proxy from when the stock had “good productivity and was demonstrably safe” (BREF). BREF is always at or above BMSY. The soft limit is defined as 20 percent of unfished SSB or 50 percent of BREF proxy, whichever is greater, while the hard limit is defined as 10 percent of unfished SSB or 25 percent of BREF proxy, again whichever is greater. Including the BREF proxies is a good practice because it can make the limits more conservative than the defaults. The MPs for each of the five lobster fisheries reflect their unique circumstances. Commercial quotas are set annually based on CPUE levels, but each HCR is slightly different from the others.
Harvest strategies have performed well for New Zealand’s rock lobster stocks, with only one of the 10 areas known to be below the target. That stock is still considerably above the hard and soft limits. The nation’s other fisheries have also performed well under the Harvest Strategy Standard: 72.5 percent of stocks are above their management target, 82.8 percent are above the soft limits and 94 percent are above the hard limits.11
Australian Domestic Fisheries
Australia adopted a harvest strategy policy for management of its domestic fisheries in 2007.12 The policy aims to “maintain key commercial stocks at ecologically sustainable levels and within this context, maximise the economic returns to the Australian community.” The objectives are to:
- Maintain fish stocks, on average, at a target biomass point (BTARG) equal to the stock size required to produce maximum economic yield (BMEY), where BMEY is approximately 1.2 BMSY (or 48%B0 as a proxy).
- Ensure that fish stocks will remain above a biomass level where the risk to the stock is regarded as too high (i.e., BLIM or proxy), where BLIM is 0.5BMSY (or 20%B0 as a proxy) or higher.
- Ensure that the stock stays above BLIM at least 90 percent of the time.
For stocks above BTARG, stock-specific harvest strategies determine the rate of “fish down” to the target. For stocks between BTARG and BLIM, managers, scientists and stakeholders work to develop a strategy to rebuild the stock to BMSY and then BTARG. If a stock drops below BLIM, a rebuilding plan is required, but the management action may be more severe, such as a fishing closure—an option included in the tiger prawn harvest strategy13—or fishing limits at a level designed to rebuild the stock over a certain number of years or generations. To reinforce this approach, stocks below BLIM can be listed as “conservation dependent,” which then requires that the rebuilding plan be agreed to jointly by the Australian Fisheries Management Authority and the Minister for the Environment.
Reference points based on fishing mortality are also used in these strategies. FMSY is the default F-based LRP (FLIM), but FLIM decreases if the stock is below BTARG in order to expedite stock recovery. FTARG is set at the fishing mortality rate required to maintain the stock at BTARG.
A comprehensive review of Australia’s harvest strategy policy in 2013 concluded that the policy was “a very successful initiative for improving the management of Commonwealth fisheries.”14 Currently, no stocks fully managed under the policy are subject to overfishing, and many previously overfished stocks have recovered.
Canadian Domestic Fisheries
Canada adopted a framework for managing its domestic fisheries with harvest strategies in 2009.15 The nation manages stocks based on two biomass-related reference points: an upper stock reference (USR) point and a limit reference point, or LRP. Together these reference points divide stock status into three categories: healthy (B>USR), cautious (LRP<B<USR) and critical (B<LRP). The maximum catch rate is set at less than or equal to FMSY when in the healthy zone. Catch rates are reduced when stocks are in the cautious zone, and can reach zero in the critical zone. The USR point is not necessarily the TRP, but rather the stock status indicator. Default values for the USR and the LRP are set at 0.8BMSY and 0.4BMSY, respectively. For example:
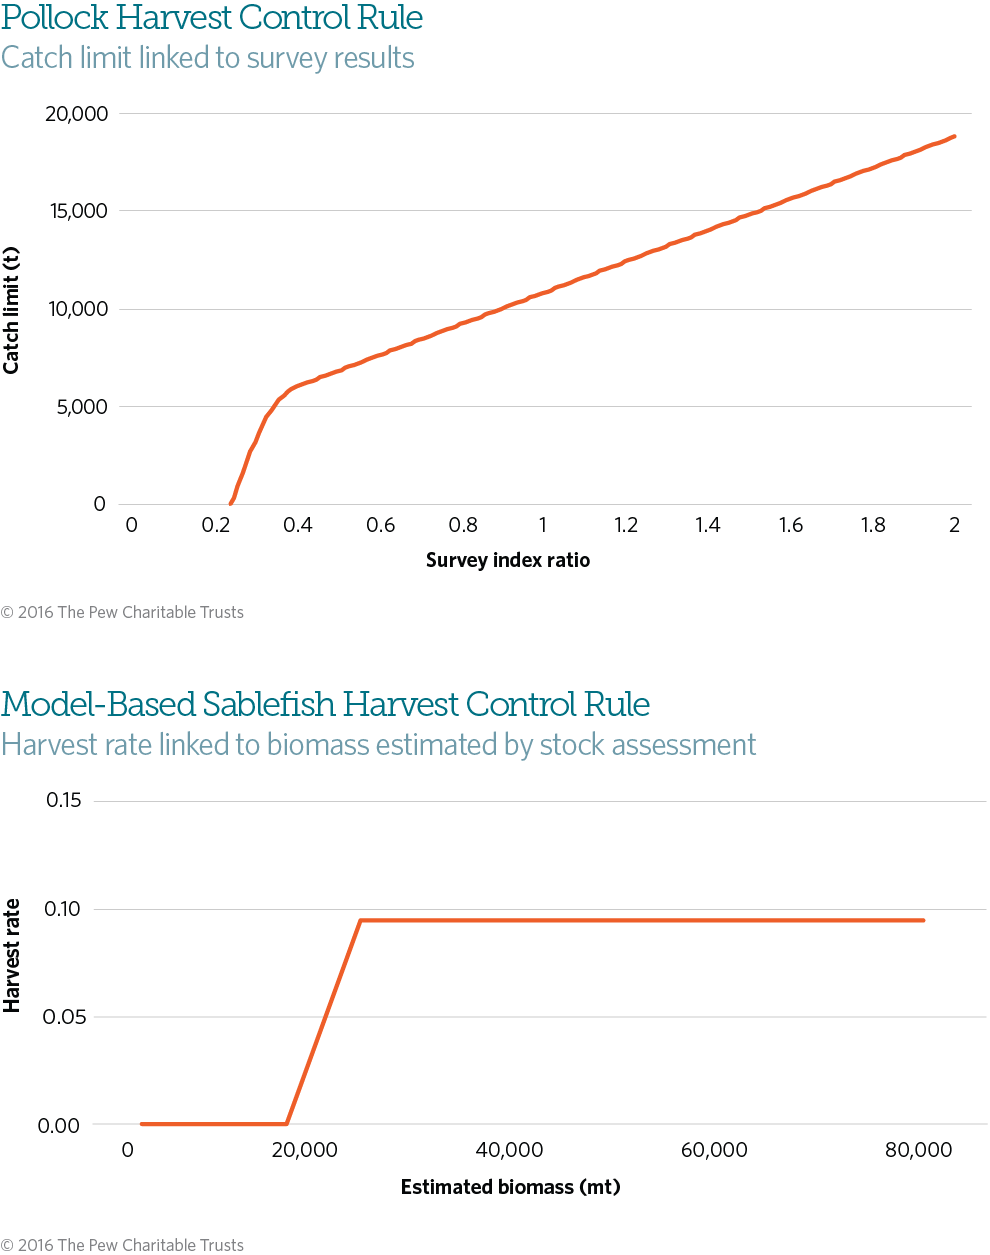
- Western Component pollock, North Atlantic: Canada adopted a harvest strategy for pollock in 2011. The development process included a full MSE and took just one year. Frustration among industry and managers about the highly variable scientific advice produced by traditional stock assessments—and the desire for more stable catch and market supply to improve business planning—resulted in an expedited development of the procedure.
The harvest strategy is designed to achieve three medium-term management objectives:16 - Stock size: A projection of the exploitable stock size in 2021 is measured against the stock size in 2000. The median stock size in 2021 must be 50 percent greater than the 2000 stock size, while the lower 25th percentile cannot be smaller than the 2000 stock size.
- Catch: Catch limits must be greater than 4,000 mt a year from 2012 through 2016.
- Restrictions on changes to annual catch and maximum catch: Catch can increase a maximum of 20 percent or 500 mt, whichever is greater, from one year to the next; the TAC can decrease up to 20 percent from one year to the next; maximum annual catch is set at 20,000 mt.
The pollock harvest strategy includes an empirical HCR, with quotas based on the three most recent years of a research survey of stock abundance, as long as no “exceptional circumstances” are observed.
The harvest strategy is re-evaluated every five years. In response to lower abundances in recent years, the quota was decreased for 2016-17, without controversy, in accordance with the MP.
- British Columbia sablefish: Canada adopted an MP for its domestic sablefish fishery in 2010. Initial TACs were set based on the MP for the 2011-12 fishing season. The approach is designed to achieve the following objectives:
- Maintain spawning stock biomass above the LRP of 0.4BMSY in 95 percent of years measured over two sablefish generations (36 years).
- When in the Cautious Zone (i.e., 0.4BMSY<B<0.8-1.0BMSY), limit the probability of decline over the next 10 years to very low (5 percent) at the LRP, increasing linearly to moderate (50 percent) at the TRP.
- Maintain the spawning biomass above BMSY, or 0.8BMSY when rebuilding from the Cautious Zone,17 in 50 percent of the years measured over two sablefish generations (this objective defines the TRP).
- Maximize the average annual catch over 10 years, subject to meeting the three objectives above.
The sablefish MP includes a model-based HCR. The HCR dictates that catches should decline linearly starting when the biomass falls below 0.6BMSY and should reach 0 at 0.4BMSY. The sablefish HCR also designates a minimum quota of 1,992 mt, approximately half the catch level just prior to adoption of the MP, which was applied in the 2015-16 fishing year. Sablefish remain overfished, but the biomass has stopped declining, with a slight uptick in 2016.
U.S. Pacific Sardines18
The Pacific Fishery Management Council has managed sardines and other coastal pelagic species using HCRs since 2000. The harvest control rule for sardines off the West Coast is:
TAC19 = (Biomass - Cutoff) x Fraction x Distribution
In this calculation, biomass is estimated annually using a stock assessment model, cutoff is the lowest level of estimated biomass at which harvest is allowed (i.e., 150,000 mt), and distribution is a factor that accounts for the percentage of the stock present in U.S. waters (i.e., 87 percent). The quota and target F are also influenced by an environmental variable: fraction is between 5 and 15 percent, depending on sea surface temperature. Although not considered a formal MSE by the management council, this HCR, including the equation with values for cutoff and fraction, was developed using a rigorous modeling exercise first conducted in 1999 and updated in 2012.
The cutoff value ensures a precautionary approach to management of the sardine fishery, given its boom-and- bust nature and the importance of sardines as forage fish. Sardines aren’t considered overfished until biomass drops below 50,000 mt, but the fishery closes under this HCR when biomass drops to 150,000 mt. In this way, the HCR triggers a “rebuilding” plan before the stock is even declared overfished. This led to closure of the fishery for the 2015-16 season, but because of the transparency and predictability of the HCR, industry expected the closure and was generally supportive. The West Coast sardine fishery had been closed from the 1950s into the 1990s, so such restrictions are not out of the ordinary, and the HCR is thought to be performing as it should.
In addition, there’s a TAC cap of 200,000 mt to promote stability in the fishery from year to year and to guard against building excess harvesting capacity in times of high biomass or inflated catch limits due to errors in estimating biomass.
A slightly modified version of this HCR is used to manage the U.S. Pacific mackerel fishery.
Conclusion
These case studies demonstrate that harvest strategies, when designed appropriately through a rigorous process employing MSE, can work for a wide range of biological and ecological situations and management structures.
The success of harvest strategies has inspired managers in additional fisheries to begin developing their own. These efforts can benefit from the lessons learned in fisheries that already use harvest strategies. The tuna RFMOs, in particular, face similar issues. As they develop harvest strategies, they could streamline the approach by coordinating and taking complementary actions. Tunas at the extremes of ecology, productivity and fishery type—from skipjack in the Indian Ocean to southern bluefin tuna—now have HCRs or full harvest strategies in place. There is no reason to think that they cannot be applied to all tunas.
Tuna managers, scientists and stakeholders should work together to expedite harvest strategy development. Doing this will promote full recovery of depleted stocks and stable markets supplied by sustainable, profitable fisheries. The time and effort invested will continue to pay dividends long into the future.
Endnotes
- Helena F. Geromont and Doug S. Butterworth, “Generic Management Procedures for Data-Poor Fisheries: Forecasting With Few Data,” ICES Journal of Marine Science 72, no. 1 (2015): 251-61, https://dx.doi.org/10.1093/icesjms/fst232; Natalie A. Dowling et al., “Empirical Harvest Strategies for Data-Poor Fisheries: A Review of the Literature,” Fisheries Research 171 (2015): 141-53, https://dx.doi.org/10.1016/j. fishres.2014.11.005.
- Richard M. Hillary et al., “A Scientific Alternative to Moratoria for Rebuilding Depleted International Tuna Stocks,” Fish and Fisheries 17, no. 2 (2016): 469-82, https://dx.doi.org/10.1111/faf.12121.
- Northwest Atlantic Fisheries Organization, Terms of Reference of the Proposed Joint Fisheries Commission-Scientific Council Working Group on Risk-Based Management Strategies, NAFO/FC Doc. 13/18 (2013), http://archive.nafo.int/open/fc/2013/fcdoc13-18.pdf.
- Northwest Atlantic Fisheries Organization, Report of the NAFO Study Group on Limit Reference Points, Lorient, France, 15-20 April 2004, NAFO SCS Doc. 04/12 (2004), http://archive.nafo.int/open/sc/2004/scs04-012.pdf.
- Northwest Atlantic Fisheries Organization, Conservation and Enforcement Measures 2016, NAFO/FC Doc. 16/01 (2016), http://archive.nafo.int/open/fc/2016/fcdoc16-01.pdf.
- Northwest Atlantic Fisheries Organization, An Assessment of the Cod Stock in NAFO Divisions 3NO, NAFO SCR Doc. No. 15/034 (2015), http://archive.nafo.int/open/sc/2015/scr15-034.pdf.
- Rebecca A. Rademeyer, “Output From the South African Hake OMP-2014 for the 2015 TAC Recommendation” (2014), http://www.mth.uct.ac.za/maram/pub/2014/FISHERIES_2014_OCT_SWG-DEM_58.pdf.
- Carryn L. de Moor and Doug S. Butterworth, “Setting the TAC for Sardine and Anchovy,” Maritime Southern Africa (November/December 2009): 29-31, http://www.mth.uct.ac.za/maram/pub/2009/ de_Moor_Maritime_Science_2009.pdf.
- National Rock Lobster Management Group, Review of Rock Lobster Sustainability Measures for 1 April 2014, Discussion Paper No: 2014/06 (2014), http://www.nzrocklobster.co.nz/assets/116090_2014_review_document_.pdf.
- New Zealand Ministry of Fisheries, Harvest Strategy Standard for New Zealand Fisheries (2008), http://www.fish.govt.nz/NR/rdonlyres/487988D0-F768-4297-ADDE-B5E1DFA53404/0/harveststrategyfinal.pdf.
- New Zealand Ministry for Primary Industries, The Status of New Zealand’s Fisheries 2015 (2016), http://fs.fish.govt.nz/Doc/24002/status-of-nz-fisheries-2015.pdf.ashx.
- Australia Department of Agriculture and Water Resources, “Commonwealth Fisheries Harvest Strategy Policy and Guidelines,” accessed May 16, 2016, http://www.agriculture.gov.au/fisheries/domestic/harvest_strategy_policy.
- Catherine M. Dichmont et al., Harvest Strategy for the Northern Prawn Fishery Under Input Controls (2014), http://www.afma.gov.au/wp-content/uploads/2014/11/Harvest-Strategy-NPF-April-2014.pdf.
- Australia Department of Agriculture, Fisheries and Forestry, Final Report on the Review of the Commonwealth Fisheries Harvest Strategy Policy and Guidelines (2013), http://www.agriculture.gov.au/SiteCollectionDocuments/fisheries/environment/ bycatch/report-harvest-strategy.pdf.
- Fisheries and Oceans Canada, “A Fishery Decision-Making Framework Incorporating the Precautionary Approach,” accessed May 10, 2016, http://www.dfo-mpo.gc.ca/fm-gp/peches-fisheries/fish-ren-peche/sff-cpd/precaution-eng.htm.
- Fisheries and Oceans Canada, Western Component (4Xopqrs5) Pollock Management Strategy Evaluation (2011), http://www.dfo-mpo.gc.ca/Library/344352.pdf; Fisheries and Oceans Canada, Western Component (4XOPQRS5) Pollock Harvest Control Rule Update Report (2014), http://www.dfo-mpo.gc.ca/csas-sccs/Publications/ScR-RS/2014/2014_004-eng.pdf.
- Simulation tests revealed that Objective 3 could not be attained for (a) BMSY with the required certainty, so (b) 0.8BMSY, the default upper stock reference (USR) point of Canada’s harvest strategy framework, was added to Objective 3 for rebuilding stocks.
- Pacific Fishery Management Council, Status of the Pacific Coast Coastal Pelagic Species Fishery and Recommended Acceptable Biological Catches, Stock Assessment and Fishery Evaluation 2014 (2014), http://www.pcouncil.org/wp-content/uploads/2014_CPS_SAFE_Text_FINAL.pdf.
- Technically, this equation gives the harvest guideline (HG), annual catch limit (ACL) or annual catch target (ACT), but it is essentially the same as the total allowable catch (TAC).


ADDITIONAL RESOURCES


