Prime Working-Age Employment Rates Lag Pre-Pandemic Levels in 24 States
First quarter 2023 numbers highlight where jobs stand compared with early 2020

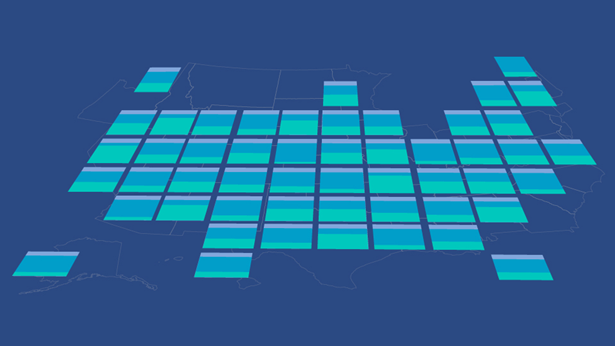
Three years after the outbreak of COVID-19 abruptly left millions of Americans without jobs, adults of prime working age were employed nationwide at a slightly higher rate than before the pandemic in the first quarter of 2023. Still, in 24 states, the average share of 25- to 54-year-olds with a job trailed pre-pandemic levels.
Changes in employment rates can affect both sides of a state’s budget ledger. More people without jobs typically translates into higher demand for government services and reduced tax revenues.
The state furthest behind its pre-pandemic levels was West Virginia (-5.4 percentage points)—for every 100 people of prime working age, about five fewer were employed in the first quarter of 2023 than in the same quarter of 2020. New Mexico followed with a 4.1 percentage point drop. The employment-to-population ratio can decline two ways: when fewer workers are employed, as was the case in West Virginia, or when a state’s population grows faster than the number of residents with jobs, as in New Mexico.
States with the greatest gains between the first quarters of 2020 and 2023 were Utah (3.8 percentage points), Mississippi (3.4 percentage points), and South Dakota (3.3 percentage points). Both the number of people and those employed in their prime working years increased in these states, with employment growing faster.
Unlike the often-cited unemployment rate, the ratio of prime-age workers to same-age population helps account for older and younger workers’ choices about retirement or full-time education. It also factors in the total population, including those not actively looking for work.
Employment tends to be a key driver of state finances, as paychecks help generate individual income tax dollars and fuel consumer spending, which produces sales and corporate income tax revenue. On the expenditure side, a declining employment-to-population ratio can indicate growing costs for states, such as increased need for safety-net assistance.
Note: Prime-age employment-to-population ratios for the months of January, February, and March were combined for 2020 and 2023 to create first-quarter averages.
Source: Pew analysis of data from the Current Population Survey, a joint venture of the U.S. Bureau of Labor Statistics and the U.S. Census Bureau
Methodology
Pew weighted data from the Current Population Survey using values provided by the U.S. Bureau of Labor Statistics. The survey is sponsored jointly by the U.S. Census Bureau and the U.S. Bureau of Labor Statistics. The data was used to calculate the total number of civilian, noninstitutionalized 25- to 54-year-olds in each state and in the nation and the average percentage of people who were employed in each.
Prime-age employment-to-population ratios for the months of January, February, and March were combined for 2020 and 2023 to create first-quarter averages. Percentage point differences between the prime-age employment-to-population rates in each state were not tested for statistical significance.
Joanna Biernacka-Lievestro is a manager, John Hamman is a principal associate, and Page Forrest is a senior associate with The Pew Charitable Trusts’ state fiscal policy project.


Fiscal 50: State Trends and Analysis
Previous Updates
Spotlight on Mental Health
ADDITIONAL RESOURCES

Article

Article