Economic Diversity in Philadelphia’s Neighborhoods
Where different income groups are located throughout the city
Our recent report on Philadelphia poverty, “Philadelphia’s Poor: Who They Are, Where They Live, and How That Has Changed,” found that about 60 percent of the city’s 372 residential census tracts had a poverty rate of at least 20 percent in 2016. Even so, there is more economic diversity in many of Philadelphia’s neighborhoods than that sobering statistic might suggest.
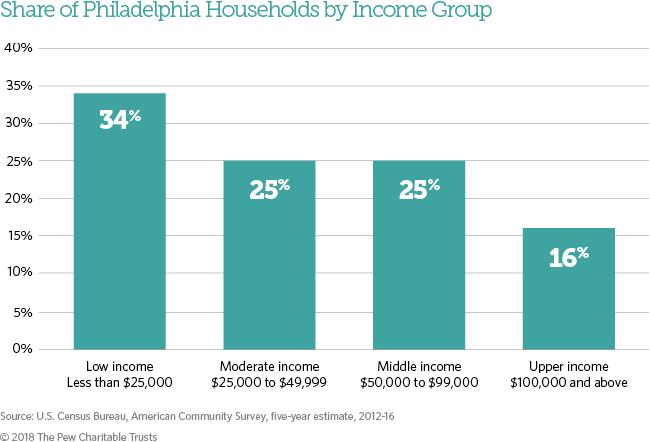
For this analysis of the city’s economic mix, we used census data to divide all city households into four income groups: low income, which we defined as less than $25,000: moderate income, $25,000 to $49,999; middle income, $50,000 to $99,999; and high income, $100,000 and above. The four groups represent 34 percent, 25 percent, 25 percent, and 16 percent of Philadelphia households, respectively.
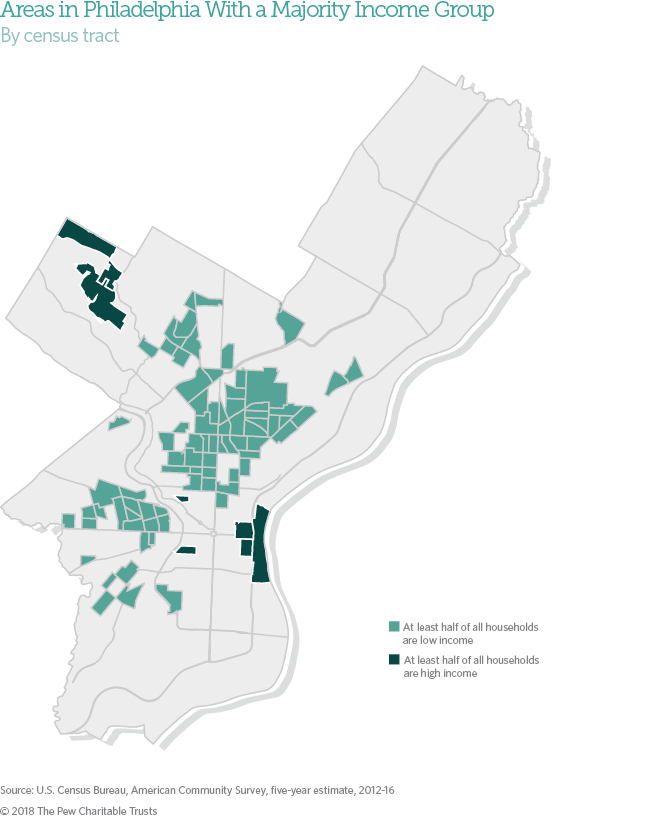
In 86 of Philadelphia’s 372 residential tracts, one income group made up at least half of the households surveyed. And in 78 of those 86 tracts, covering about 21 percent of the city’s geography, the majority group was low income, located primarily in high-poverty areas of North and West Philadelphia. In the other eight tracts—in Center City and Chestnut Hill—the high-income group represented more than 50 percent of households.
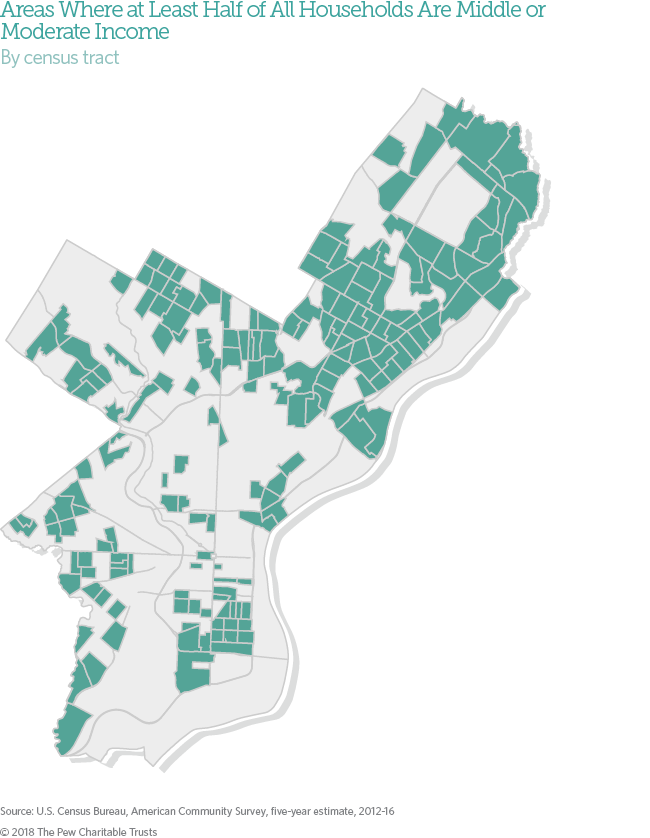
According to the data, there is not a single tract in Philadelphia where the moderate- or middle-income group was in the majority. However, in 184 tracts—roughly half of the city—those two categories combined accounted for more than half of the population. The tracts include almost all of Northeast Philadelphia, as well as much of South Philadelphia, East and West Oak Lane, Wynnefield, and Overbrook. Analysts and public officials sometimes refer to these sections of the city as “middle neighborhoods,” defined by economic development consultant Paul Brophy as places that are affordable and attractive, offer a reasonable quality of life, and may be in danger of decline.
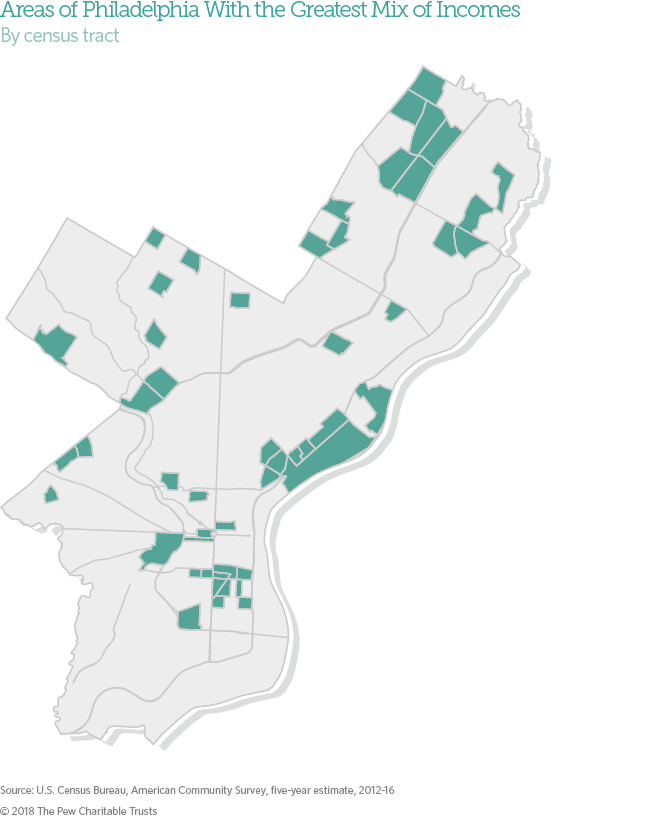
The next map shows the tracts with the most varied incomes. In 51 tracts, each of the four income groups made up 16 to 34 percent of all households—lower and upper bounds that reflect the citywide representation of the smallest group (high income) and largest group (low income). In other words, these are diverse tracts with ample representation of each of the four groups. As the map shows, they are located primarily in Port Richmond, Bridesburg, East Falls, and the Far Northeast. Some of the tracts in this map also appear in the previous map.
This analysis is based on the U.S. Census Bureau’s American Community Survey five-year estimates for 2012-16, which were published in December and are the most recent data available at the tract level.
Larry Eichel directs Pew’s Philadelphia research initiative; Octavia Howell is a researcher on the team and author of the report" Philadelphia’s Poor: Who They Are, Where They Live, and How That Has Changed.”


ADDITIONAL RESOURCES

Article


