Juveniles in Custody for Noncriminal Acts
Interactive shows state-by-state breakdown for probation violations and status offenses, such as truancy and running away

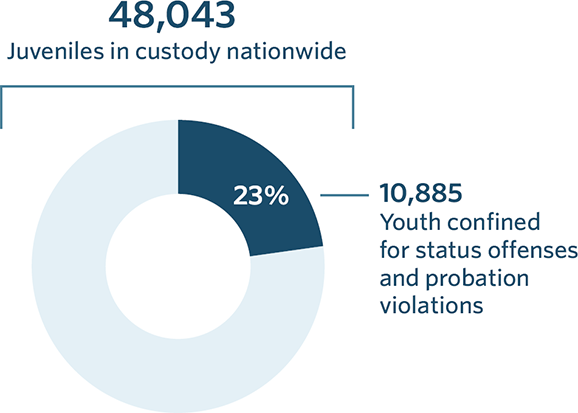
Juvenile Confinement Across the Nation
Nearly a quarter of the 48,043 juveniles held in residential facilities across the U.S. on a single day in 2015 were confined for status offenses or technical violations of supervision, according to the Census of Juveniles in Residential Placement from the Department of Justice’s Office of Juvenile Justice and Delinquency Prevention. This marks the largest share of youth held for these acts since collection of these data began in 1997.
 Nearly a
 The proportion of juveniles confined for these types of offenses varies considerably by state. Some states — including Georgia, Kansas, and Utah — have recently adopted changes to policies and practices aimed at reducing the number of youth held for low-level offenses.
This interactive uses data for the 50 states on the confinement of juveniles in each jurisdiction by percentage, number, and rate per 100,000 youth.
{{ chartTitle }}
{{ currentState }}
Back to All StatesThe data shown reflect {{ currentState }}’s percentage, rate, and number of youth confined for status offenses or technical violations of supervision. Percentage is the share of confined youth held for noncriminal acts; rate is the number of juveniles held for these behaviors per 100,000 youth in the jurisdiction, and number is the count of youth confined for status offenses or technical violations.
{{ currentState }} reported no confined youth held for status offenses or technical violations of supervision in 2015.
-
{{ filter1Text }}
-
{{ filter2Text }}
OUR WORK
ADDITIONAL RESOURCES
Article
Article


