Philadelphia: The State of the City—A 2010 Update
This report is an update of "Philadelphia 2009: The State of the City," the comprehensive, statistical study published by the Philadelphia Research Initiative last March. This update provides new data on a dozen key indicators about the state of the city and places that data in context. We plan a full-fledged sequel to the original report next year.
View the complete 2010 Update (PDF). Individual charts are included below. Click on a chart to view the data in more detail.
View last year's report, “Philadelphia 2009: The State of the City.” (Please note, some errors were found subsequent to the release of the Philadelphia 2009 report. They have been corrected in the online version of the report, and have been corrected in this 2010 update. These revisions should be noted in your hard copy of the 2009 report.)
Philadelphia Population
On the face of it, this graph doesn't appear to make any sense. Philadelphia can't possibly have gained over 90,000 residents between 2007 and 2008. What happened? In response to a formal appeal by City Hall, the U.S. Census Bureau determined that it had been undercounting the city's population for years. It then revised its estimate for 2008 from 1,447,395 to 1,540,351 and put the 2009 number even higher. A similar finding in the 2010 Census would make it official: Philadelphia, after losing population every decade since the 1950s, is growing again.

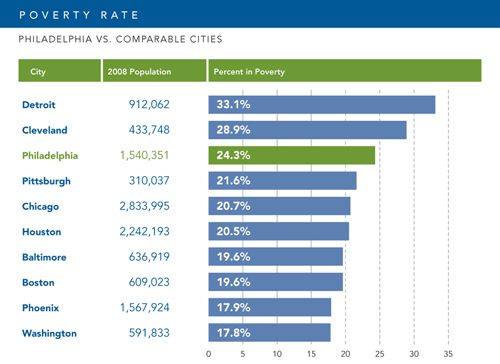
Poverty Rate
On the poverty front in Philadelphia, the only good news was that the percentage of poor people in the city didn't go up. But beyond the human dimension of the problem, having more than 24 percent of the population living below the poverty line is a drag on the city's future and puts it at a competitive disadvantage in relation to many other cities.
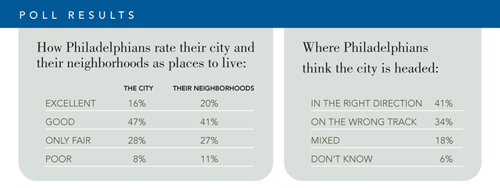
Poll Results
Despite ongoing budget cuts locally and gloomy economic news nationally, Philadelphians entered 2010 with their positive views of the city largely unshaken. According to a poll conducted for the Philadelphia Research Initiative in January, 63 percent of residents saw the city as a “good” or “excellent” place to live, and 61 percent gave the same ratings to their neighborhoods. In addition, a plurality of those polled said the city was “headed in the right direction” and not “off on the wrong track.” All of those results were similar to those in 2009.
Philadelphia Job Growth and Decline
In 2009, Philadelphia lost 11,500 jobs, a smaller drop on a percentage basis than occurred nationally. But with an average of 651,000 jobs for the year, the city had fewer jobs than at any time in its modern history. As a result of the jobs lost in both the city and the region, the unemployment rate for Philadelphians, which was 7.2 percent in 2008, averaged 10.3 percent in 2009 and stood at 10.6 percent at year's end.

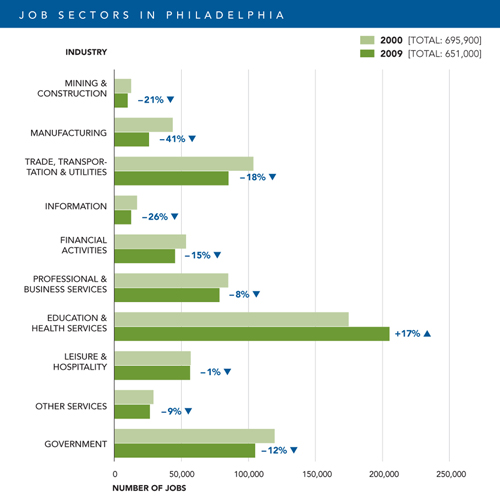
Job Sectors in Philadelphia
Since 2000, when the city enjoyed its highest employment levels in recent years, every major sector in the Philadelphia job market has declined—except education and health services, commonly known as “eds and meds.” That sector continued to grow last year despite the recession, adding 4,100 jobs. Professional and business services, previously a growing sector, took a significant hit in 2009.
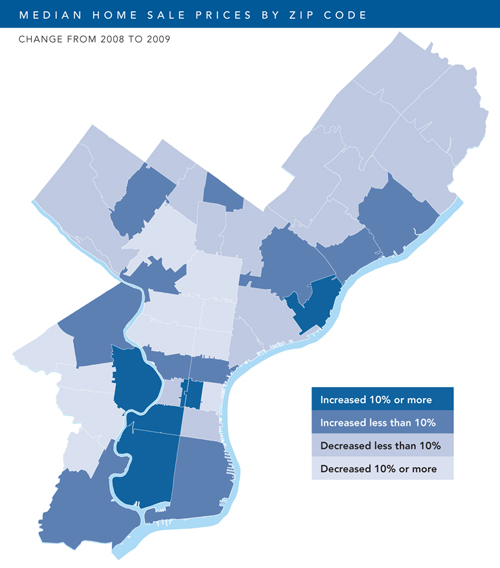
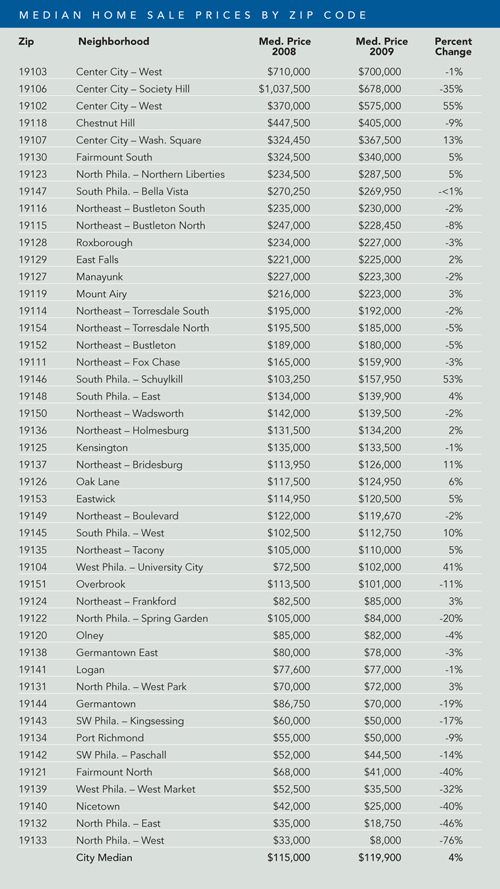
Median Home Sale Prices by Zip Code
On an annual basis, the median price for home sales in 2009 rose 4 percent in Philadelphia, a city not hit as hard as many others by the housing slump nationally. The map shows that some of the poorest areas of the city, and one of the richest, saw the biggest declines in housing prices in percentage terms. Neighborhoods that fared reasonably well include parts of Center City, several adjacent areas and much of South Philadelphia. In some parts of the city, the numbers are skewed by the fact that relatively few houses were sold, meaning that one or two sales had an oversized impact on the 2009 median prices.
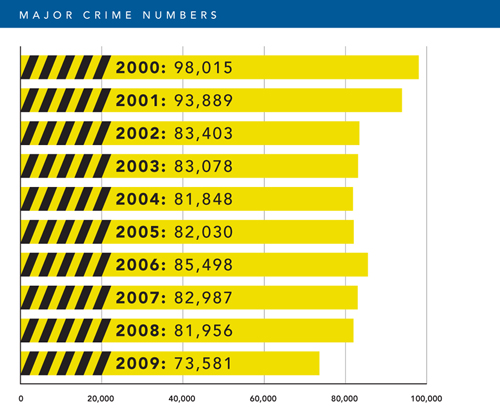
Major Crime Numbers
For much of the past decade, crime declined in most American big cities but not in Philadelphia, where the numbers held about constant. Last year, though, Philadelphia joined the national trend. Major crimes dropped by slightly more than 10 percent to 73,581, with violent crime down almost 9 percent. The number of reported major crimes—a category that includes murder, rape, robbery, aggravated assault, burglary, major theft and vehicle theft—was the lowest in the city since 1978, the number of violent crimes the lowest since 1989.
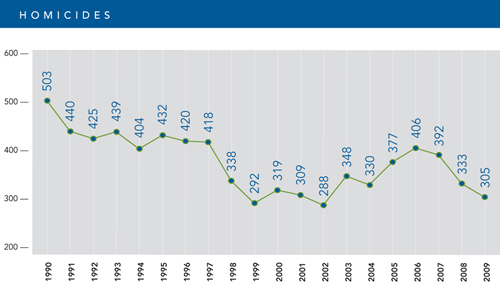
Homicides
Mayor Michael Nutter came into office at the beginning of 2008 saying that his goal was a 30 percent reduction in the city's annual homicide total over four years. The city has taken major steps toward achieving that goal. With last year's 8.4 percent decline, homicides are down 22.2 percent for the first two years of the Nutter administration. The 2009 homicide figure, 305, was the lowest since 2002.
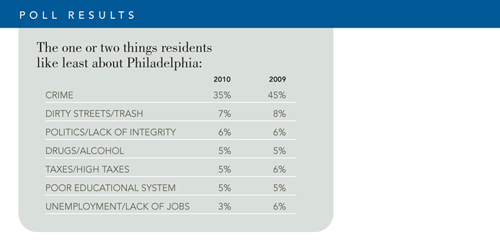
Poll Results
Concern about crime remains high in Philadelphia, though not as high as it used to be. In polls conducted in 2009 and 2010, the Philadelphia Research Initiative asked respondents to name the one or two things they like least about the city. In 2009, 45 percent mentioned crime. In 2010, the percentage dropped to 35, still far and away the top answer. Among residents who said they would like to move out of the city, the percentage citing crime as the main reason dropped from 36 to 24.
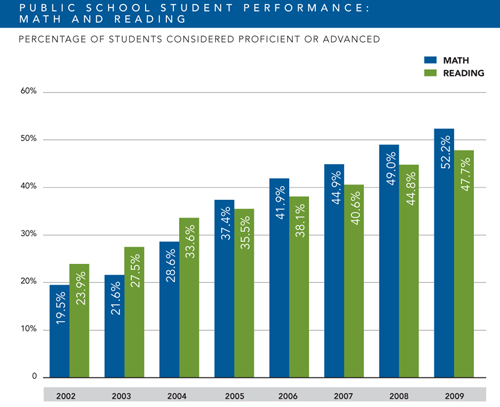
Public School Student Performance: Math and Reading
Philadelphia's public school students continued to make progress in math and reading, as measured by the annual standardized state test known as the Pennsylvania System of School Assessment. In 2009, for the first time since the tests were instituted, more than half of the students tested (52.2 percent) were considered advanced or proficient in math with slightly less than half (47.7 percent) meeting that standard in reading. Even so, Philadelphia public school students as a group scored well below the statewide numbers; in Pennsylvania as a whole, 73.4 percent of students were advanced or proficient in math, 71.3 percent in reading.
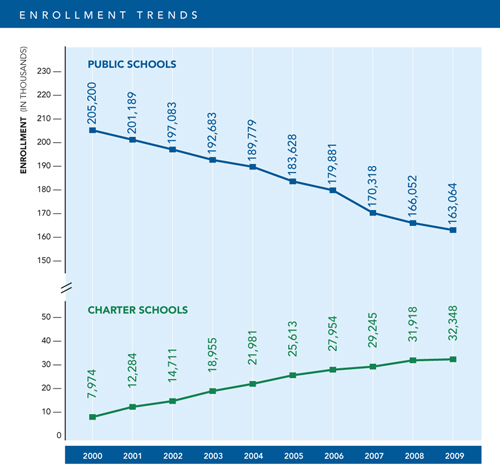
Enrollment Trends
The year 2009 saw the continuation of two recent trends in school enrollment: the decline in the number of students attending traditional public schools and the rise in the number attending charter schools. Philadelphia now has 67 charter schools, which are funded by taxpayers but are not required to comply with most district rules on staffing and programs.
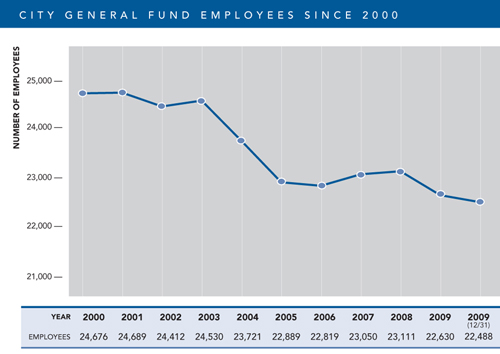
City General Fund Employees Since 2000
The number of people employed by Philadelphia city government in its general fund budget was 22,488 at the beginning of 2010. This is the lowest number in many years—a reflection of the belt-tightening required as the recession has cut into city tax revenues. The number is down about 9 percent from 2001 and down 1.4 percent from 2006. All of the employee numbers, except the most recent one, are for June 30 of the year listed.
ADDITIONAL RESOURCES
Press Releases & Statements


