State and Local Government Spending on Health Care Slowed in 2013
Total U.S. health care spending grew relatively slowly in 2013 for the fifth consecutive year, rising about 3.6 percent. By way of comparison, health care spending grew by an average annual rate of 7.3 percent from 2000 to 2008. And for the first time since 2010, state and local government health care spending followed suit—increasing by 3.2 percent, according to the latest data from the Centers for Medicare & Medicaid Services,1 a unit of the U.S. Department of Health and Human Services. Nevertheless, health care spending remains a potential source of fiscal pressure for states and localities.
Spending slows after two-year spike
The deceleration in state and local spending occurred principally because of slower growth in the two largest cost categories: Medicaid (funded jointly by the states and the federal government), and state and local employee health insurance premiums. (Other areas of state and local health care spending in the Centers for Medicare & Medicaid Services’ report include Medicare contributions for public employees, public and general assistance, maternal and child health, vocational rehabilitation, public health activities, hospital subsidies, state phase-down payments, and investment in research, structures, and equipment.)
While state Medicaid spending increased by 22 percent and 12 percent in 2011 and 2012, respectively, it grew by only 6 percent in 2013. Similarly, spending on state and local employee health insurance continued to rise slowly as it had done in 2011 (3 percent) and 2012 (4 percent), increasing by only 2 percent in 2013. Several factors contributed to these trends.
State Medicaid spending
Calendar year 2013 marked a return to a more typical Medicaid spending pattern after a surge and then retrenchment of federal aid in recent years. Under the American Recovery and Reinvestment Act of 2009 (and later legislation that extended certain provisions of the law), the federal government contributed an extra $103 billion to Medicaid, with states receiving the bulk of that total in 2009 and 2010. The Great Recession swelled Medicaid rolls and drove increases in total program expenditures, but the states’ share of Medicaid spending actually declined because of federal stimulus money.2
The extra federal money stopped flowing in July 2011, which was the primary reason state Medicaid expenditures rose steeply that year and in 2012, and why federal Medicaid expenditures fell. But in 2013, the temporary effects of this retrenchment in federal aid faded, and both federal and state spending rose by about 6 percent.
Total Medicaid spending was likely to have increased substantially in 2014, when millions of Americans were added to states’ rolls after many of them expanded their eligibility requirements for the program under the Affordable Care Act.3 But most of this hike will have been paid for by the federal government, which covered the entire cost of care for newly eligible enrollees.4
State and local employee health insurance
The slight uptick in spending on health insurance premiums for state and local employees was driven, in part, by continued stagnation in state and local employment. 5 As of December 2014—seven years after the start of the Great Recession—state and local government employment remained below prerecession levels.6 This, in turn, has likely kept state and local employee health plan enrollment—and, therefore, total health plan spending—growth down. (For more information on state employee health plan spending, see here.).
Long-term outlook
Despite the recent slowdown in spending, health care still poses serious fiscal challenges for states and localities that must balance their spending and revenue each year.
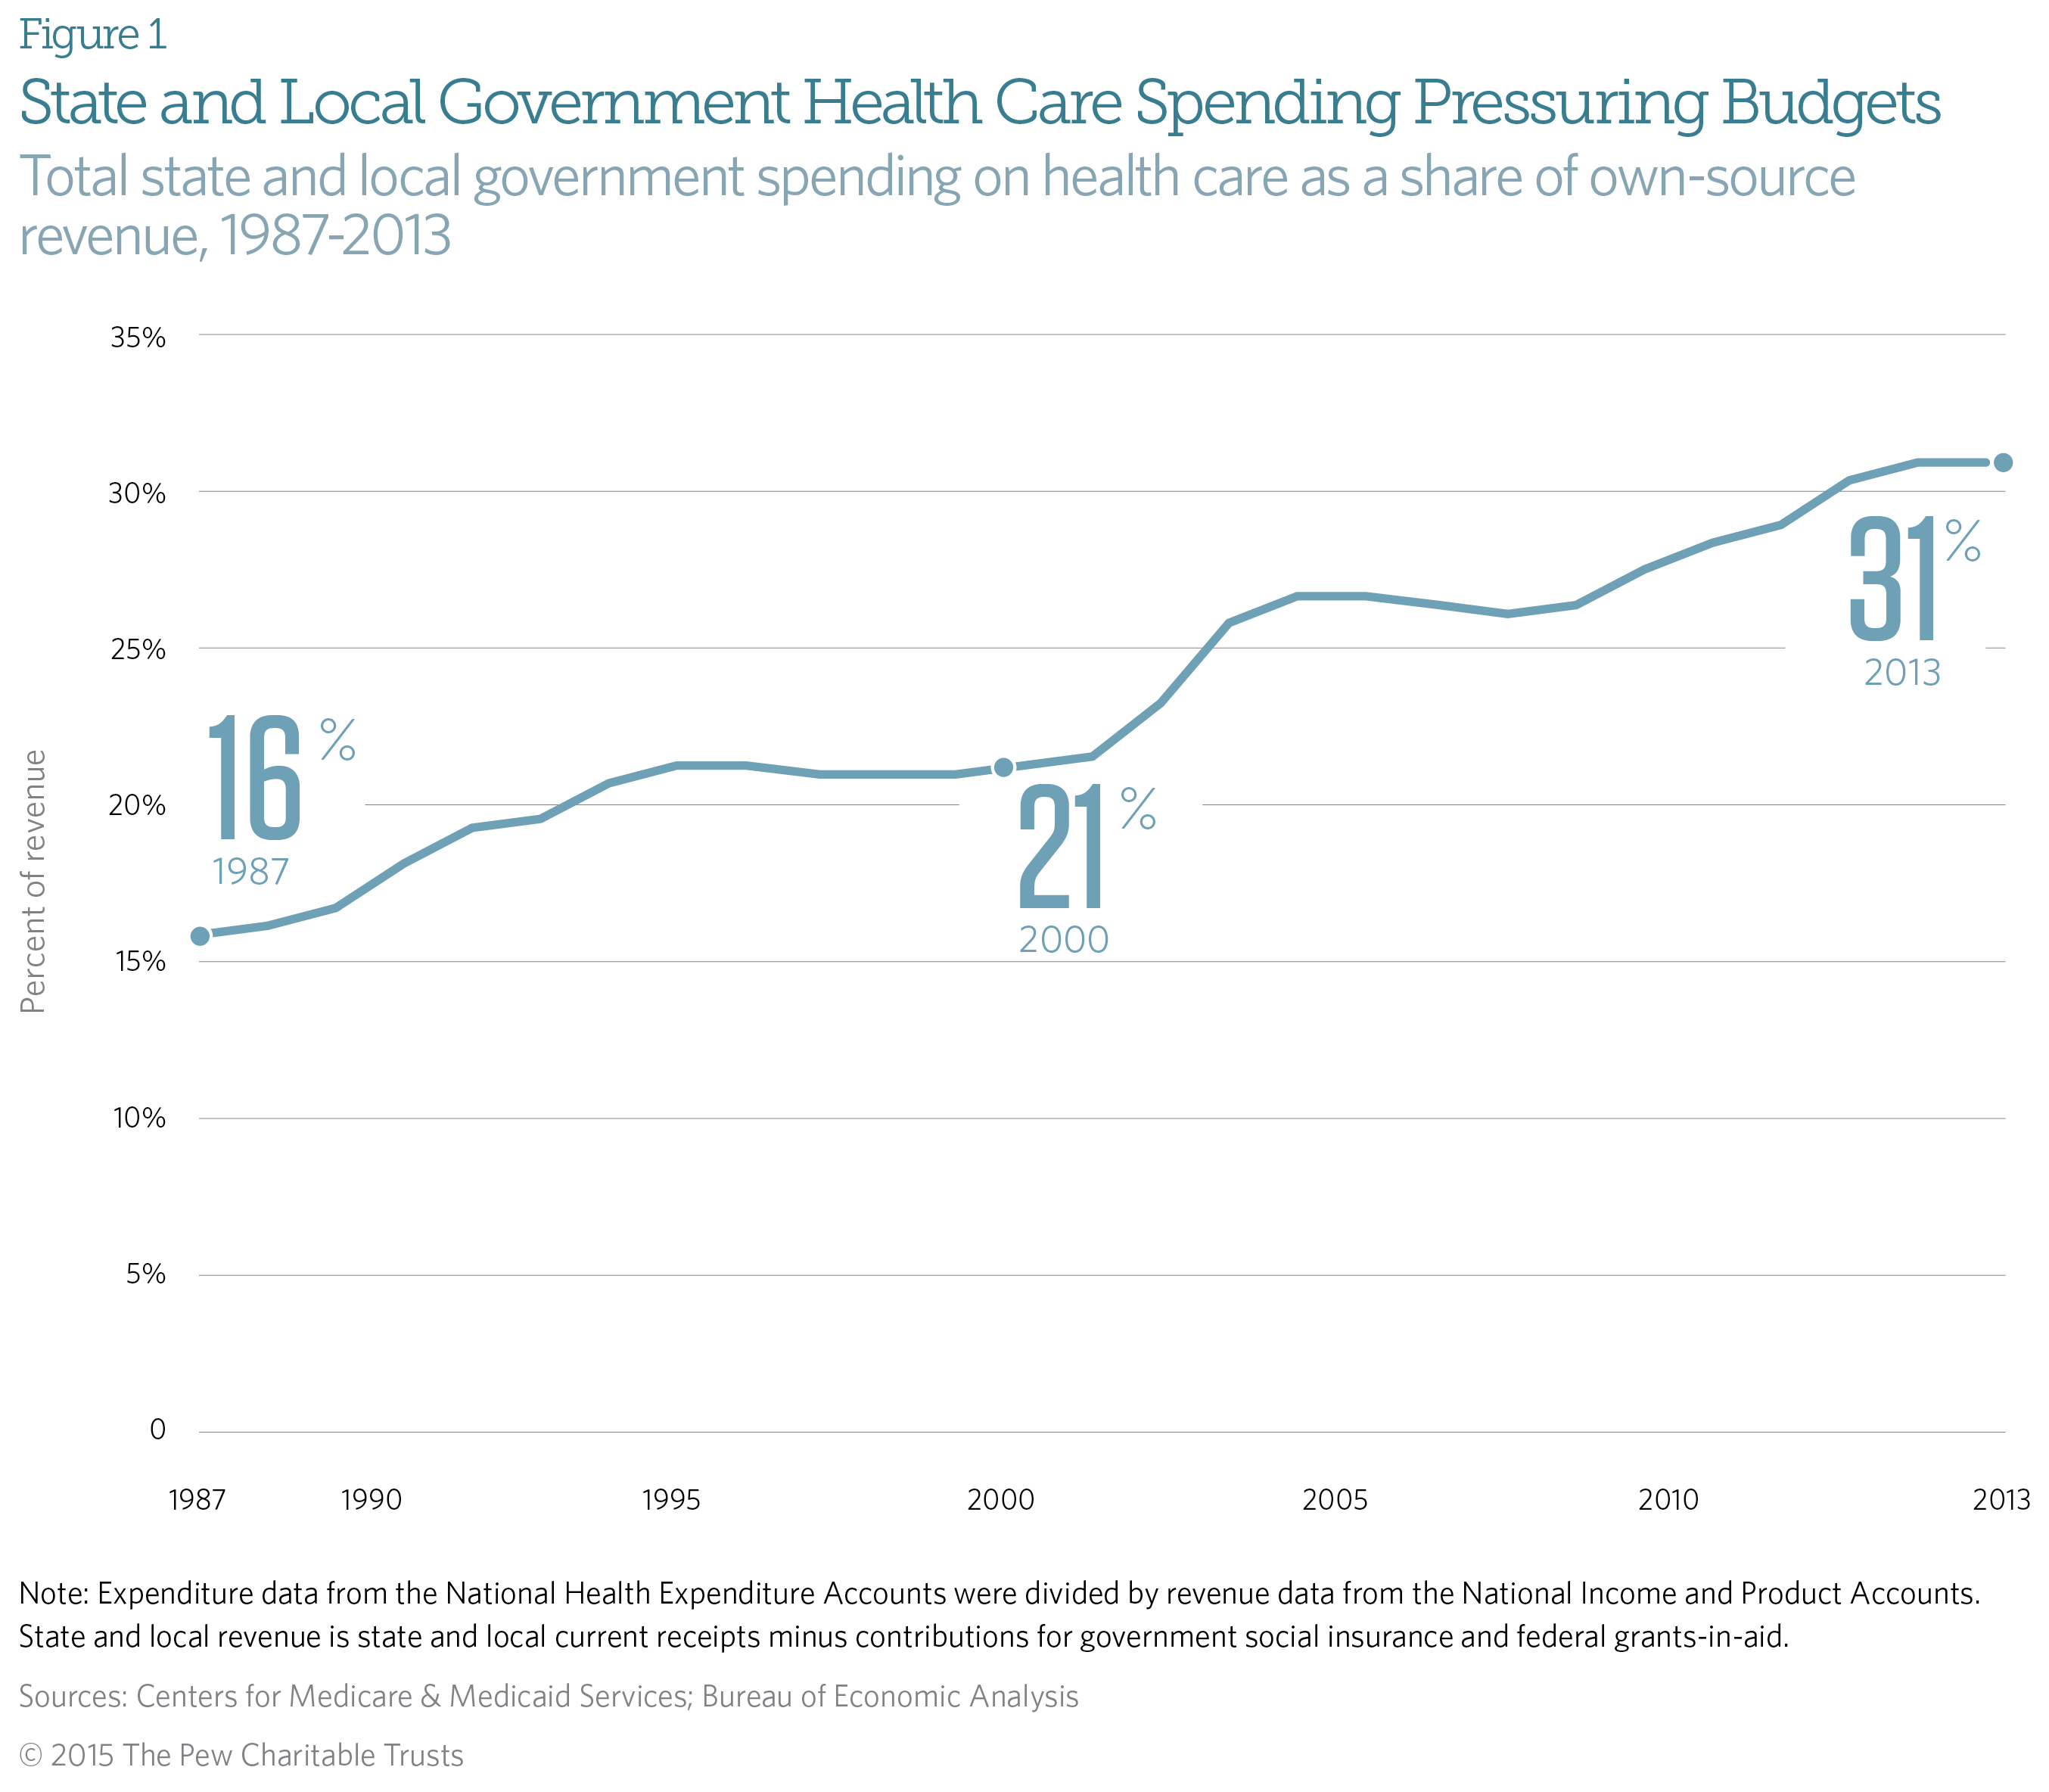
Health care expenditure as a share of state and local revenue was 31 percent in 2013 for the second consecutive year, up from 16 percent in 1987. (See Figure 1.)
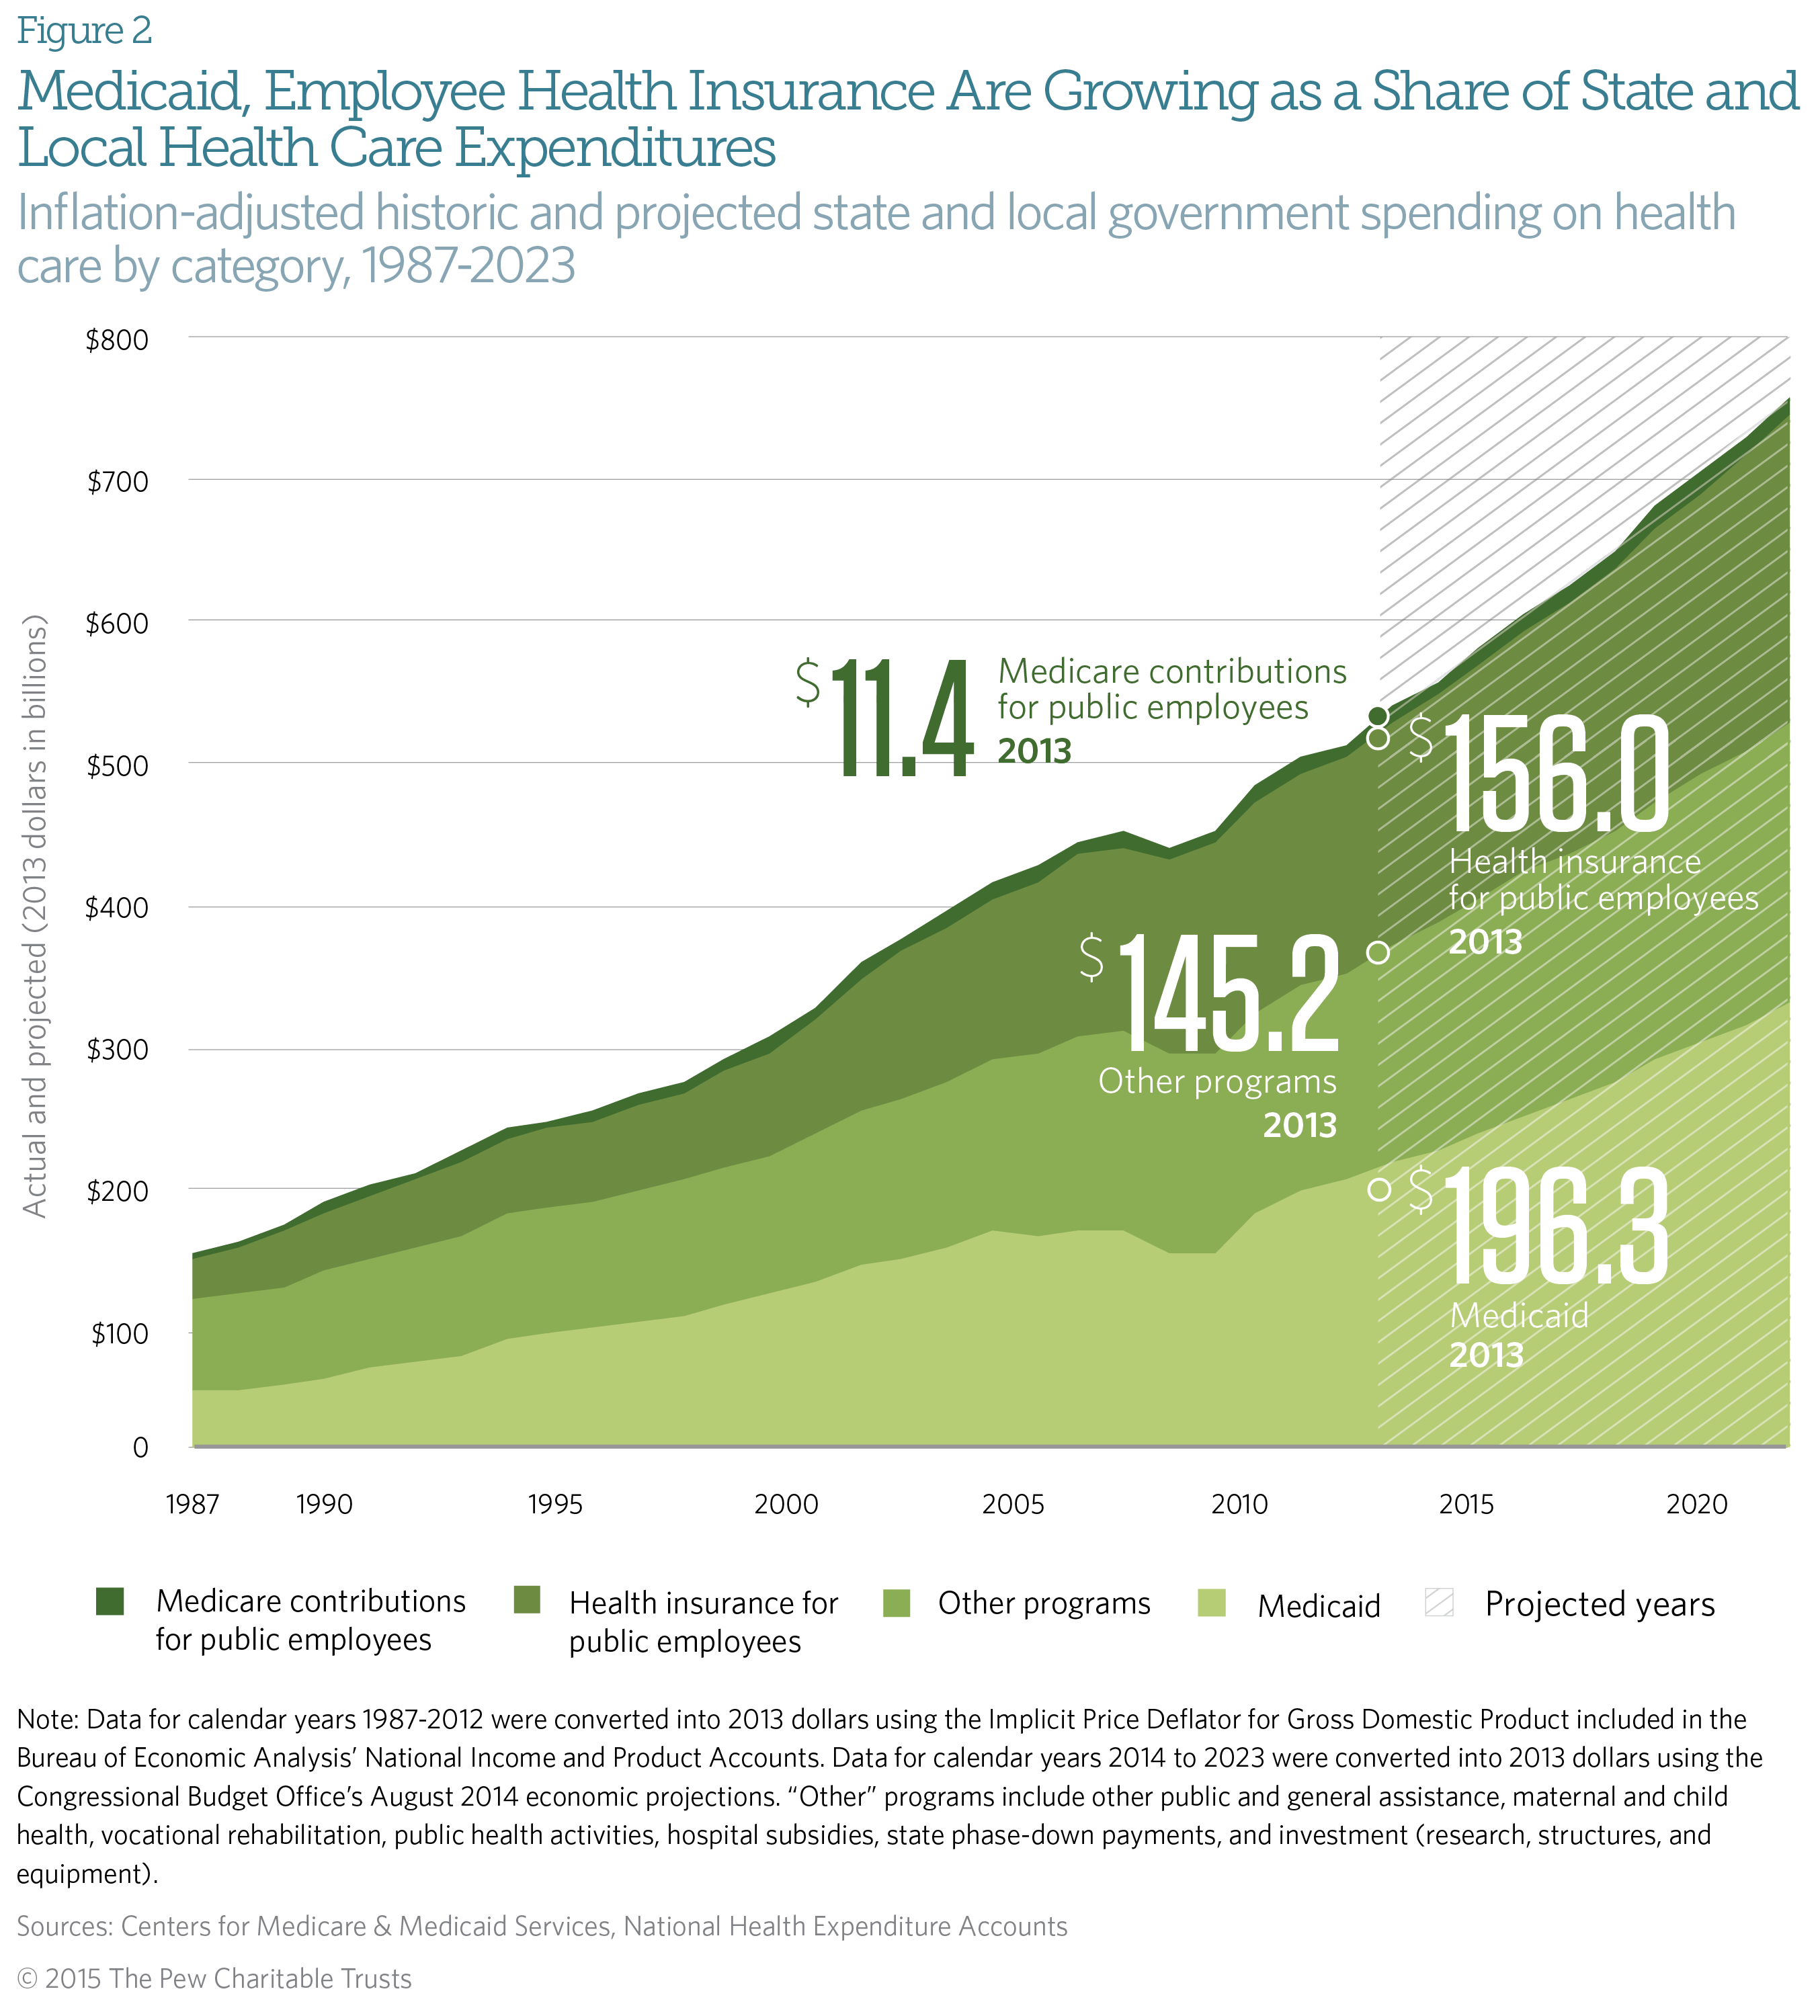
Combined health care expenditures by state and local governments increased by an inflation-adjusted 262 percent during that time. The most significant elements of this expansion were state and local contributions to public employee health insurance premiums and to Medicaid, which experienced inflation-adjusted increases of 447 percent and 386 percent, respectively. (See Figure 2.)
The Centers for Medicare & Medicaid Services projects that state and local government spending will rise by 49 percent in inflation-adjusted* dollars from 2013 to 2023.7
* Data for calendar years 1987 to 2012 were converted into 2013 dollars using the Implicit Price Deflator for Gross Domestic Product included in the Bureau of Economic Analysis’ National Income and Product Accounts. Data for calendar years 2014 to 2023 were converted into 2013 dollars using the Congressional Budget Office’s economic projections in “An Update to the Budget and Economic Outlook: 2014 to 2024” (August 2014), https://www.cbo.gov/sites/default/files/45653-OutlookUpdate_2014_Aug.pdf.
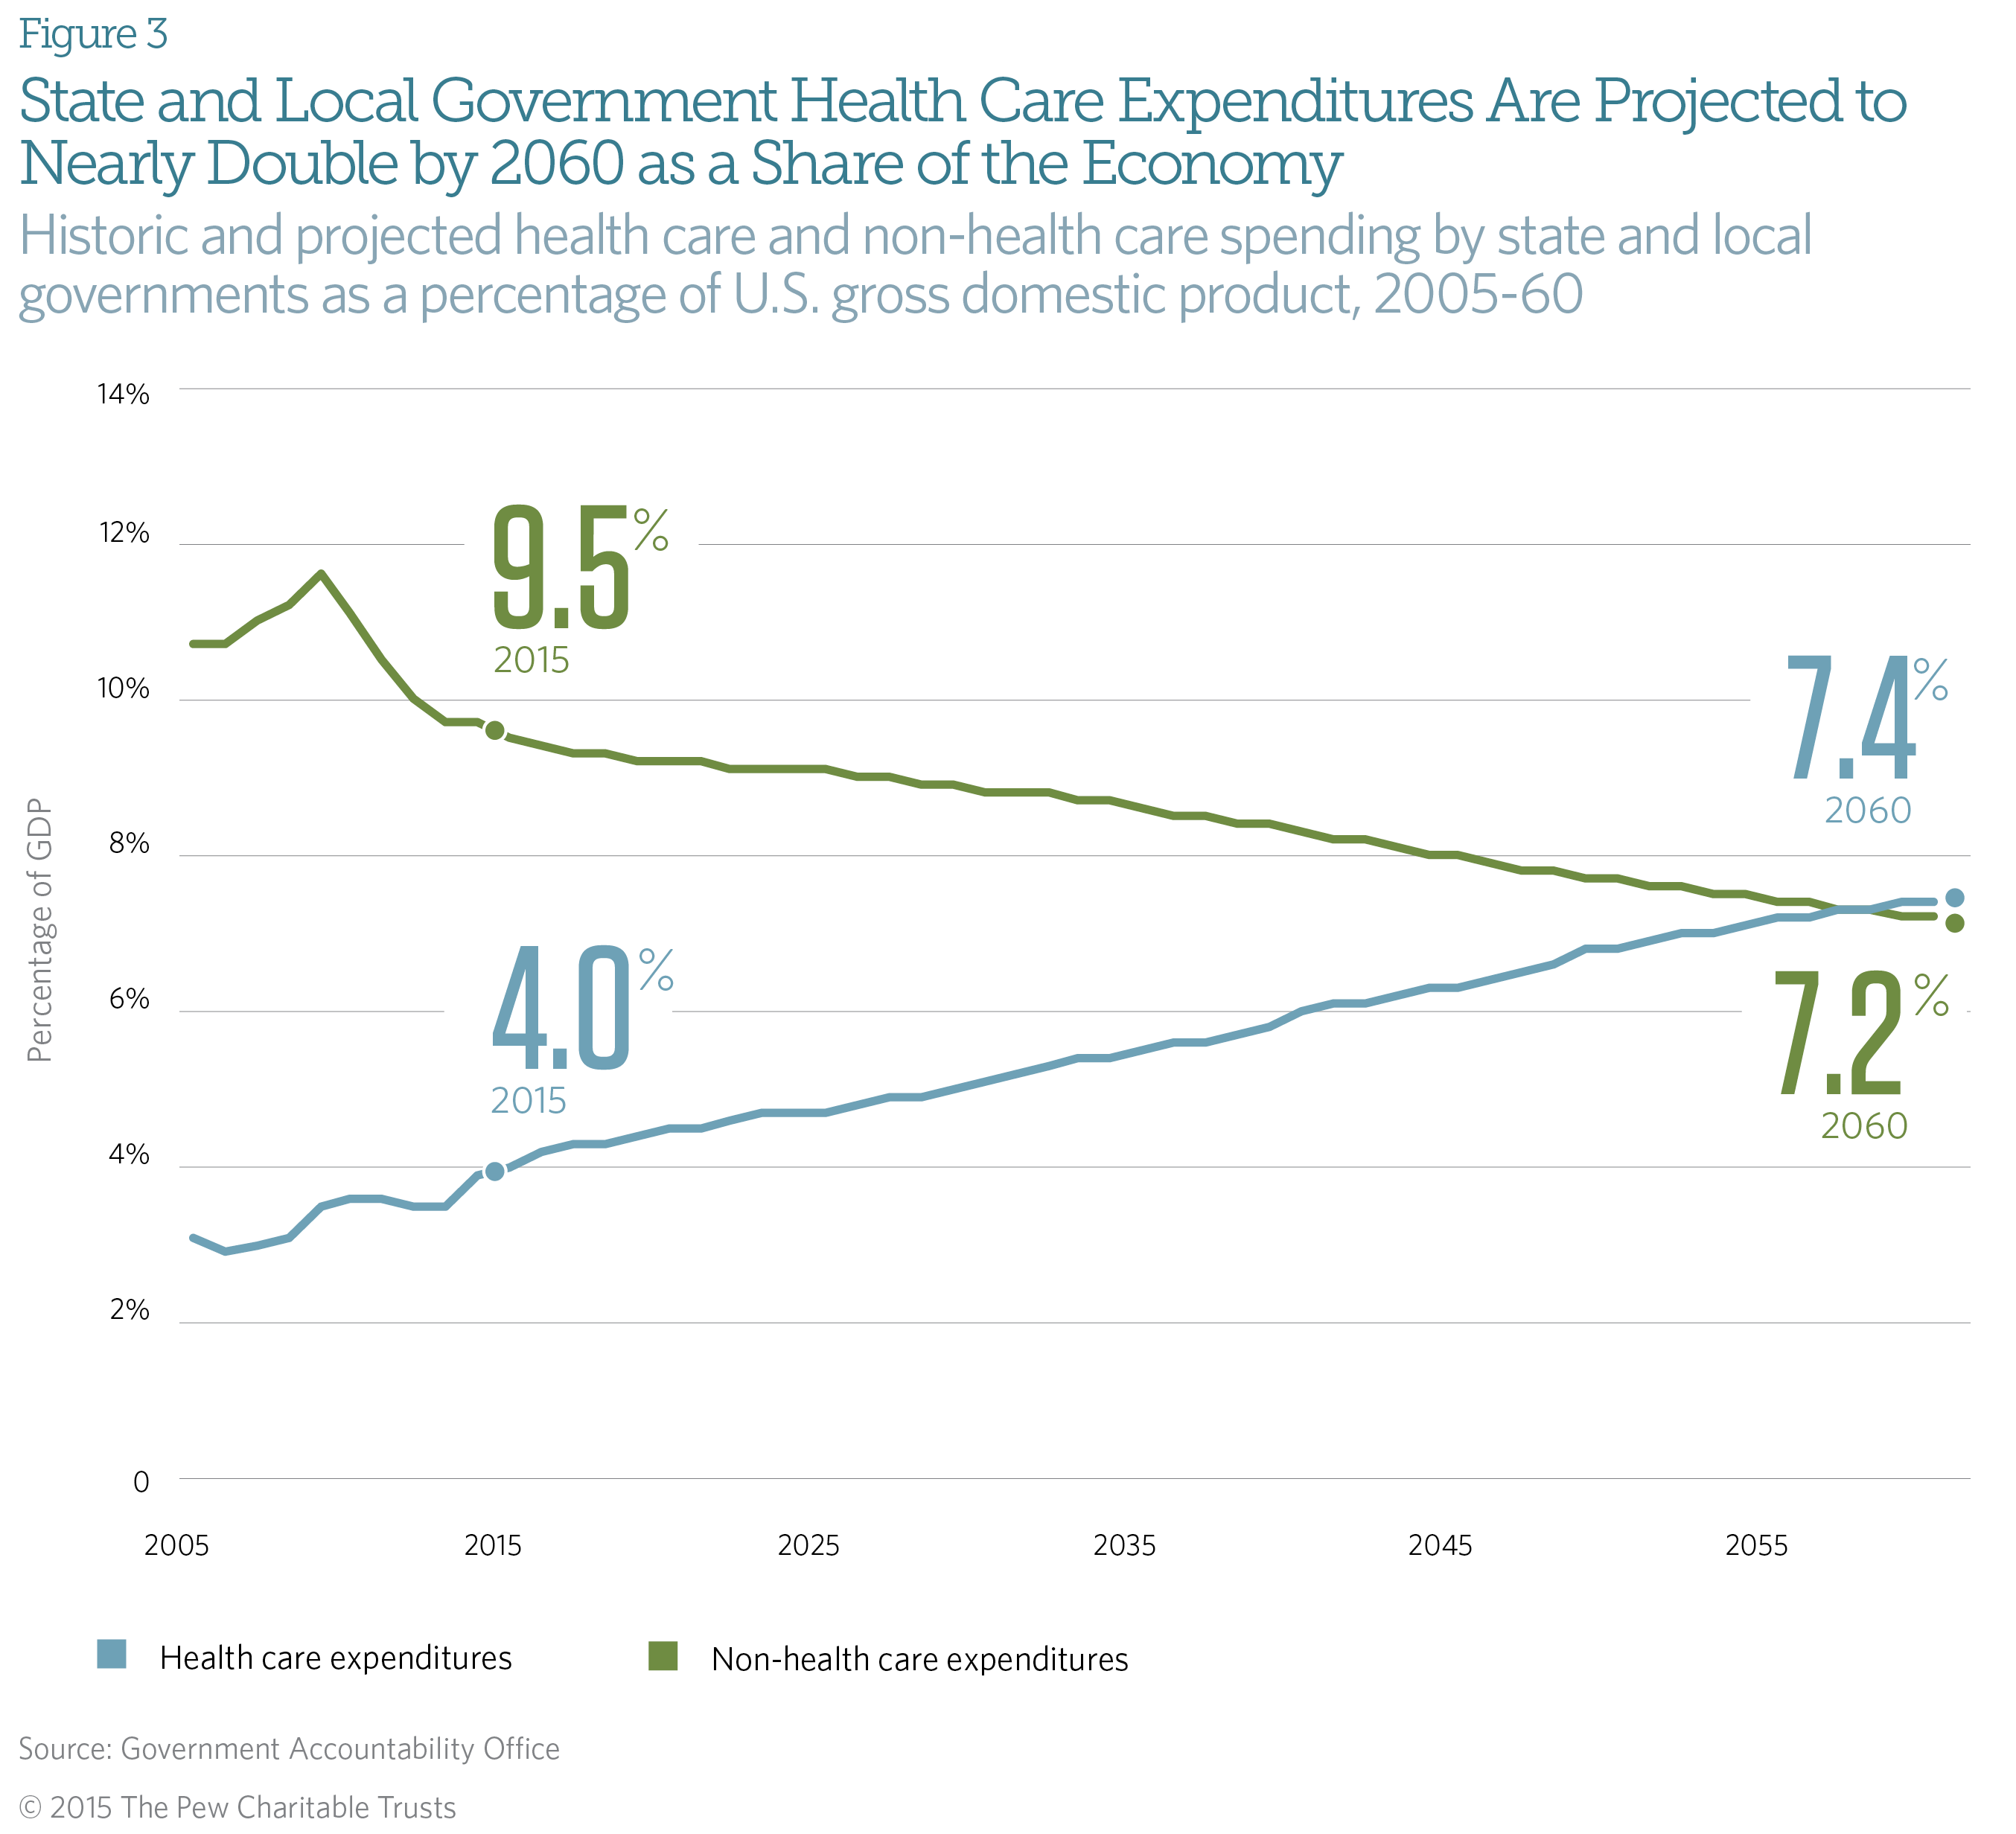
Looking further ahead, the Government Accountability Office—the nonpartisan investigative arm of Congress—warns that health care spending is the primary driver of the long-term fiscal challenges that it expects state and local governments to face. According to the agency’s simulation, state and local health-related expenditures will nearly double as a percentage of gross domestic product from 2014 to 2060.8 (See Figure 3.)
The State Health Care Spending 50-State Study Report Series
The State Health Care Spending Project, a collaboration between The Pew Charitable Trusts and the John D. and Catherine T. MacArthur Foundation, examines seven key areas of state health care spending—Medicaid, the Children’s Health Insurance Program, substance abuse treatment, mental health services, prison health care, active state government employee benefits, and retired state government employee benefits. The project provides a comprehensive examination of each of these health programs that states fund. The programs vary by state in many ways, so the research highlights those variations and some of the key factors driving them. The project is concurrently releasing state-by-state data on 20 key health indicators to complement the programmatic spending analysis.
Endnotes
- Centers for Medicare & Medicaid Services, National Health Expenditure Accounts, “Sponsor Highlights,” December 2014, http://www.cms.gov/Research-Statistics-Data-and-Systems/Statistics-Trends-and-Reports/NationalHealthExpendData/NationalHealthAccountsHistorical.html.
- The Henry J. Kaiser Family Foundation, “Impact of the Medicaid Fiscal Relief Provisions in the American Recovery and Reinvestment Act (ARRA)” (October 2011), http://www.kff.org/medicaid/upload/8252.pdf.
- Cindy Mann, “Medicaid and CHIP Enrollment Milestone Achievement: Enrollment Grows by Approximately 9.7 Million Additional Americans,” Centers for Medicare & Medicaid Services (December 2014), http://www.hhs.gov/healthcare/facts/blog/2014/12/medicaid-chip-enrollment-october.html.
- Edwin Park, “CBO Finds Health Reform’s Medicaid Expansion Is an Even Better Deal for States,” Center on Budget and Policy Priorities (April 2014), http://www.cbpp.org/cms/?fa=view&id=4131#_ftn1.
- Louise Sheiner and Emily Parker, “Government Payrolls Edging Up, but Still Below Pre-recession Levels,” The Brookings Institution (November 2014), http://www.brookings.edu/blogs/up-front/posts/2014/11/25-government-payrolls-edging-up-sheiner.
- Lucy Dadayan and Donald J. Boyd, “Good News for Private Sector Jobs, Bad News for State-Local Government Jobs,” The Nelson A. Rockefeller Institute of Government (January 2015), http://www.rockinst.org/newsroom/data_alerts/2015/2015-01-12_Data_Alert.pdf.
- Centers for Medicare & Medicaid Services, “National Health Expenditure Accounts Projections,” September 2014, http://www.cms.gov/Research-Statistics-Data-and-Systems/Statistics-Trends-and-Reports/NationalHealthExpendData/NationalHealthAccountsProjected.html.
- Government Accountability Office, “State and Local Governments’ Fiscal Outlook: 2014 Update” (December 2014), http://www.gao.gov/fiscal_outlook/state_local_fiscal_model/overview#t=0.


