State Tax Revenue Grows, but a Full Recovery Eludes 26 States
National
These data have been updated. To see the most
recent data and analysis, visit Fiscal 50.
(UPDATED 6/3/2014 to correct number of states with tax revenue above peak—before adjusting for inflation—to 37, not 35.)
Nationally, total state tax revenue has recovered from its plunge during the Great Recession, thanks to factors such as North Dakota’s oil boom and tax increases in Illinois, California, and elsewhere. But the recovery is uneven. Tax collections in 26 states had not fully rebounded by the final quarter of 2013, after adjusting for inflation.
A 50-state ranking shows that tax receipts in five states were more than 15 percent below their previous adjusted peak level: Alaska (-59.9 percent), Wyoming (-27.6), Florida (-20.2), New Mexico (-17.9), and Louisiana (-15.2). Where tax revenue remains below its previous peak, policymakers are more likely to face tough tradeoffs in balancing state budgets.
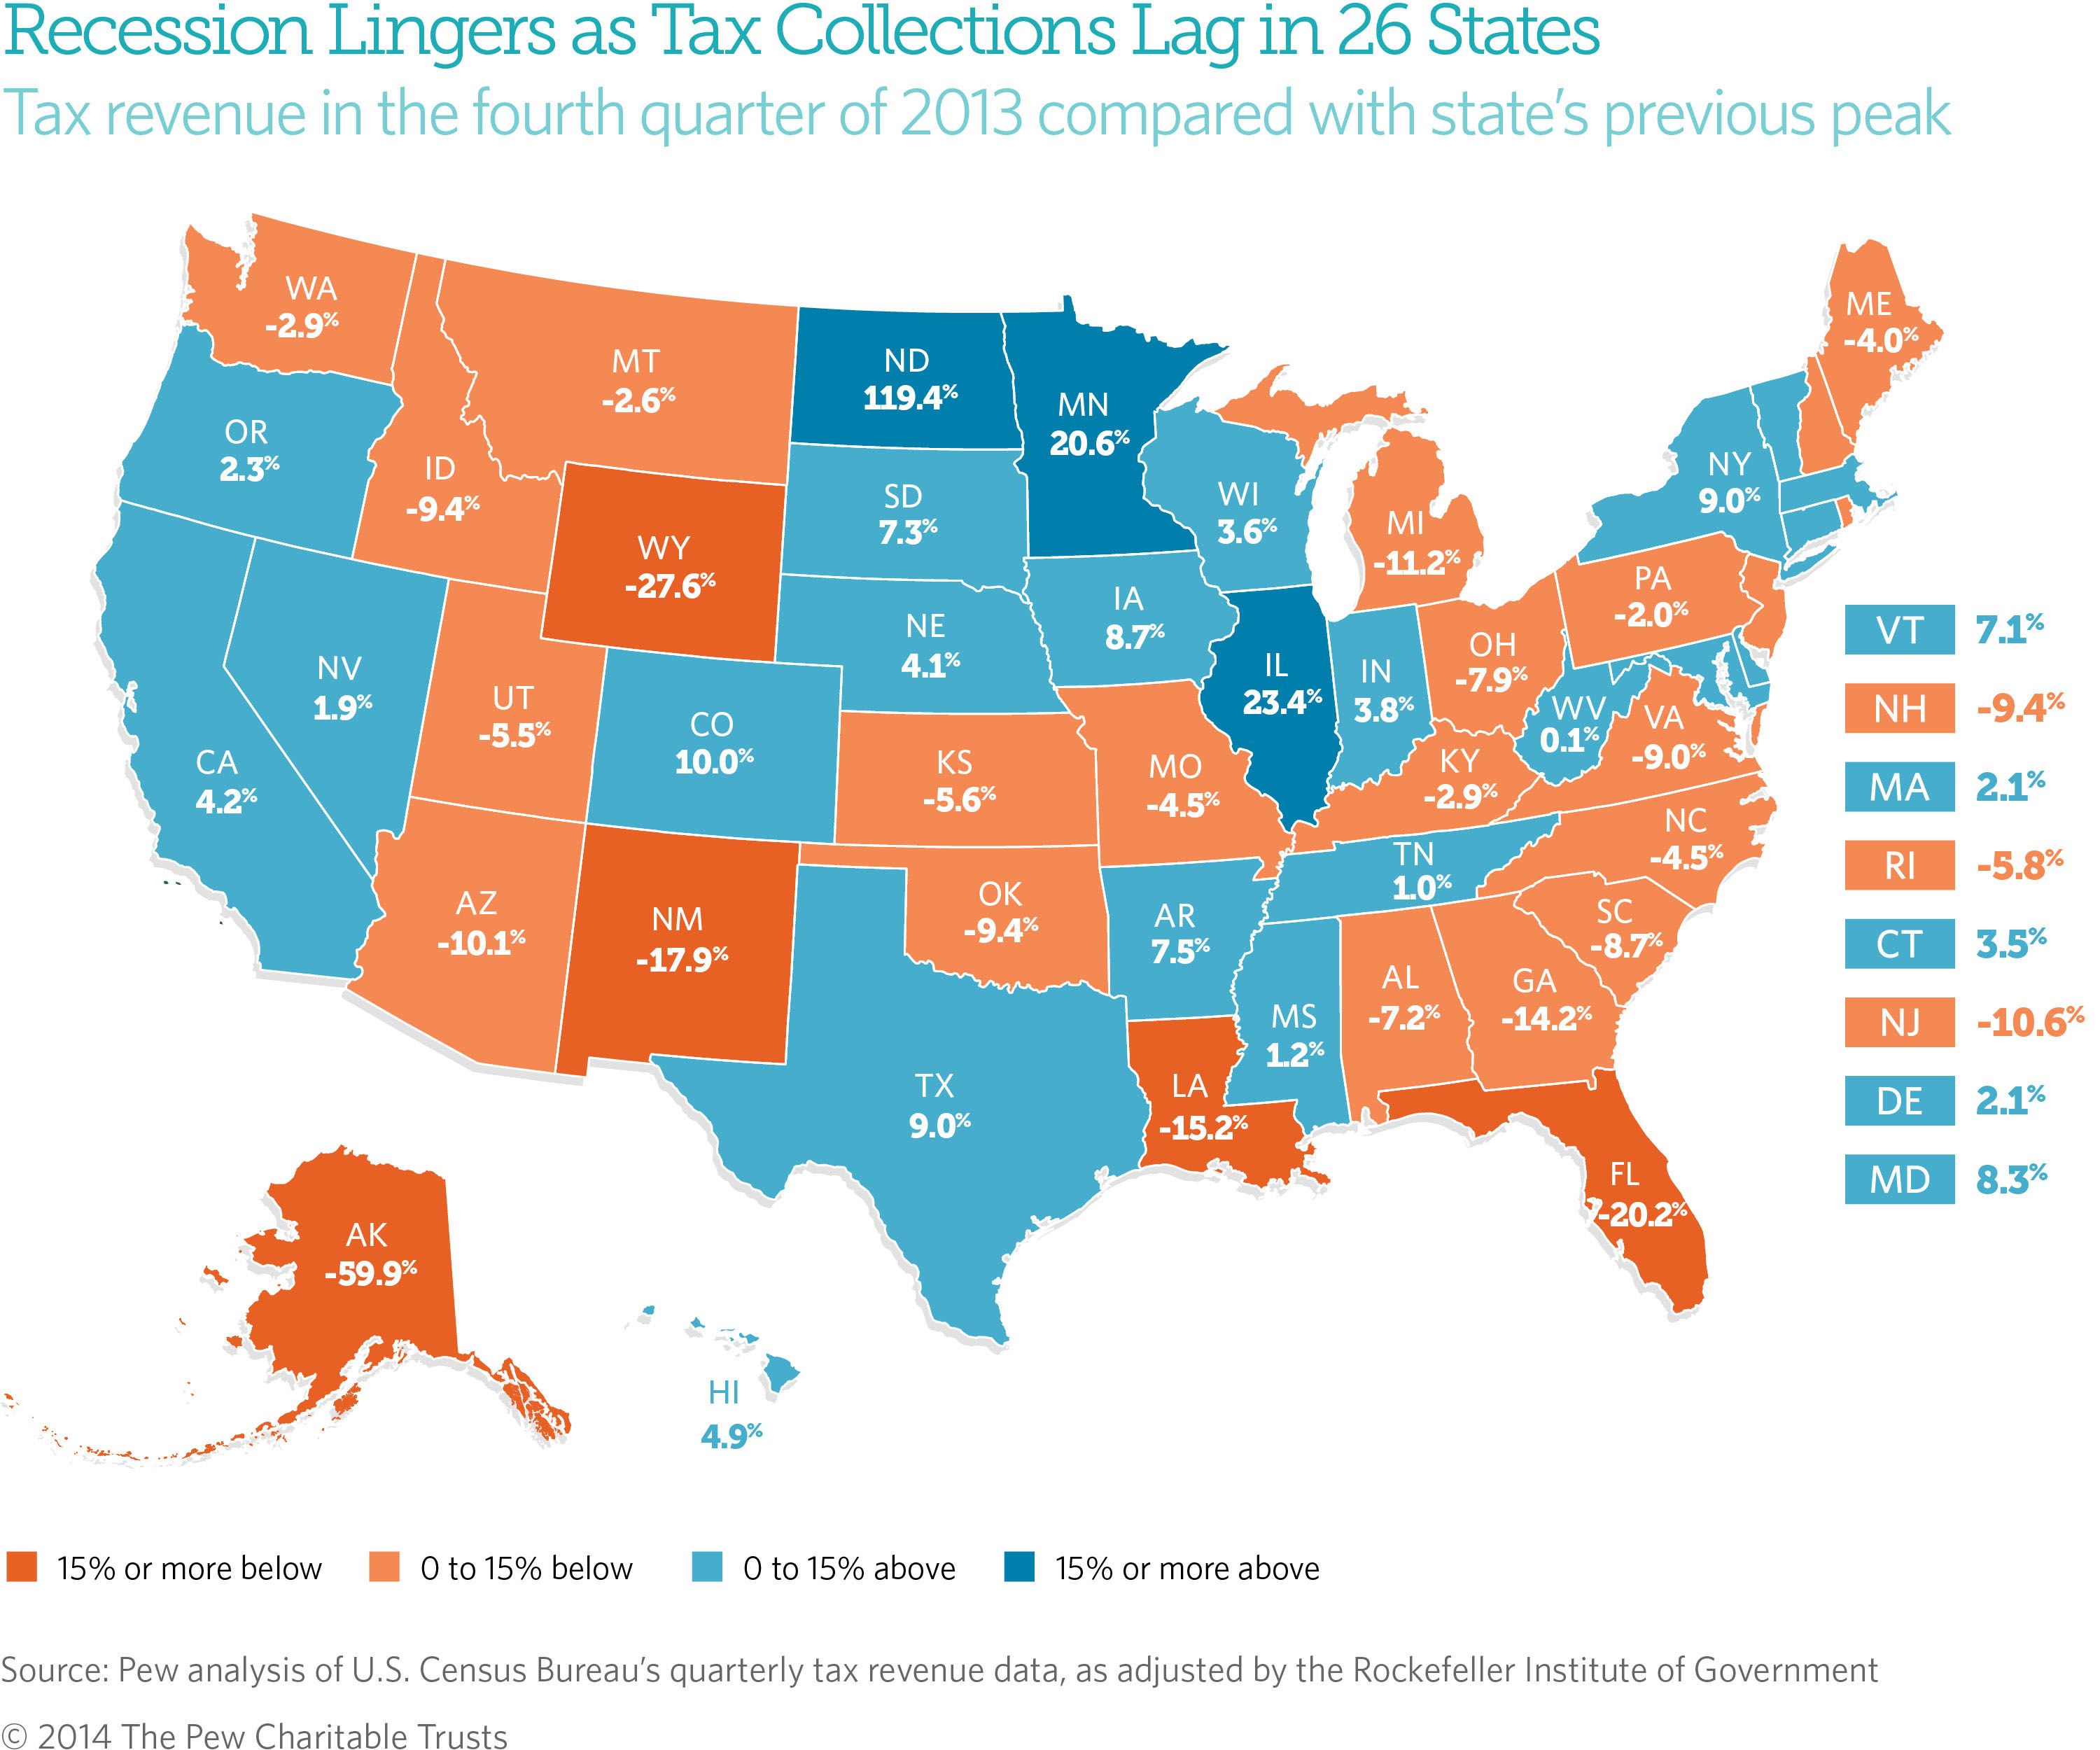
Leading the list of 24 states where tax revenue had bounced back by the end of 2013 were North Dakota (nearly 120 percent above its peak), Illinois (23.4), and Minnesota (20.6). But recovery to peak levels does not necessarily signal an economic comeback, because growth also can result from tax or policy changes. More than half of the states taking in more tax dollars than at their inflation-adjusted peak increased taxes since the start of the recession.
Tax revenue is one measure tracked by The Pew Charitable Trusts’ Fiscal 50: State Trends and Analysis to assess state fiscal health. Fiscal 50 compares the latest quarterly tax data with each state’s previous tax peak, adjusted for inflation, to gauge the fiscal stress still weighing on state budgets since the Great Recession, which lasted from December 2007 to June 2009.
What is the overall trend?
Combined tax revenue for the 50 states has risen for 16 straight quarters. That growth follows five quarters of sharp declines—to as much as 13 percent below peak at the end of 2009—that resulted in multibillion-dollar budget gaps. Despite steady tax revenue growth, not until the second quarter of last year (the end of fiscal year 2013 for most states) did states finally take in more combined tax dollars than they had almost five years earlier, or 0.8 percent more than at the previous peak after accounting for inflation. As of the final quarter of 2013, the states took in 2.2 percent more in total tax dollars than they did at their 2008 inflation-adjusted peak.
But recovery varied widely when viewed state by state. Every state experienced a drop in tax revenue in the wake of the recession, but some saw less of a fall and recovered more quickly than others. By the end of 2010, North Dakota was the only state that had recovered, in inflation-adjusted tax dollars. A year later, tax receipts were above peak in nine states; at the end of 2012, 17 states; and at the end of 2013, 24 states.
Why it matters
States with below-peak tax revenue have less purchasing power to fund essentials such as schools, safety-net programs, corrections, employee salaries and pensions, and road maintenance and construction.
Even with recovery of their tax revenue level, combined the 50 states have the equivalent of just 2 cents more in purchasing power now for every $1 they collected at their 2008 peak. That leaves little extra to make up for cuts in federal aid and to pay costs associated with population increases, growth in Medicaid enrollment, deferred needs, and accumulated debts. For example:
- Since the end of the recession, state populations have grown by more than 10 million people.
- An additional 8 million people have enrolled in the state and federally financed Medicaid health care program, not counting new enrollees since the national health insurance mandate took effect.
- The share of state revenue from federal dollars, which hit a 50-year high of 35.5 percent in fiscal 2010, is retreating to prerecession levels with the expiration of federal economic stimulus funds. Federal dollars are the second-largest source of state revenue; tax revenue is the largest, making up nearly half of state dollars. (See Fiscal 50’s Federal Share of State Revenue indicator.)
As of the fourth quarter of 2013, compared with each state’s peak:
States with the greatest recovery
- North Dakota’s tax revenue skyrocketed with an oil boom, besting all states with receipts that were 119.4 percent higher than at the 2008 peak. As receipts from sales taxes and severance taxes on oil production soared, the state cut income and property taxes.
- Illinois posted the second-largest increase over its previous peak (23.4 percent), thanks in part to a temporary tax increase on personal and corporate income in 2011. Unless the General Assembly makes it permanent, the tax hike is supposed to phase down starting in January 2015, cutting revenue by as much as $1.5 billion in fiscal 2015.
- Minnesota’s tax revenue first surpassed its 2008 peak in 2011 and was 20.6 percent higher by the end of 2013. After raising taxes on high-income earners that year, the state trimmed taxes during the 2014 legislative session in response to a predicted surplus.
States with the least recovery
- Alaska was furthest from its peak (-59.9 percent) among the 50 states, but its 2008 high point was due to a short-lived windfall from record crude oil prices and a new oil tax. With no personal income or sales taxes, the state relies on severance taxes for more than three-fourths of its revenue, though it recently trimmed those to try to spur more oil production. Still, Alaska has significant financial resources, with the largest reserves of any state. (See Fiscal 50’s Reserves and Balances indicator.)
- Wyoming’s tax revenue was down 27.6 percent from its early 2009 peak. With no personal or corporate income taxes, the state depends heavily on severance taxes on coal, oil, and natural gas. As a result, its revenue system is one of the most volatile in the country, according to a Pew report, Managing Uncertainty.
- Florida, where tax revenue was 20.2 percent below its inflation-adjusted peak, enacted $500 million in tax cuts during the 2014 legislative session. One of seven states without a personal income tax, Florida was hit harder by the housing bust than almost any other state, but its revenue slide began before the recession, in mid-2006.
- New Mexico’s tax revenue was 17.9 percent below its prerecession peak at the end of 2013. Federal cutbacks and job losses, particularly in the public sector, have cost the state revenue, as have declines in income and severance taxes.
- Louisiana’s tax revenue was 15.2 percent below its peak collection, which occurred in 2008 while the state was rebuilding from hurricanes Katrina and Rita. An income tax cut took effect after the recession.
Other highlights
- Of the five states where tax revenue dipped the least after the recession—Arkansas (-4.0 percent), Iowa (-6.5), Wisconsin (-6.7), South Dakota (-7.4), and Kentucky (-7.4)—only Kentucky’s tax collections had not fully rebounded by the end of 2013, after adjusting for inflation.
- Unadjusted for inflation, state tax dollars were above the earlier peak in 35 states in the final quarter of 2013.
- Michigan’s tax revenue never recovered from the 2001 downturn and continued to drop after the 2007-09 recession. At the end of 2013, the state took in 11.2 percent less than it did in mid-2006, after accounting for inflation. The state government has fewer people to serve, however, as Michigan is one of only two states to lose population over the past decade.
What’s ahead?
Even when tax revenues bounce back, policymakers will face challenges because of competing demands that piled up during the recession. Getting back to peak returns states only to where they were in purchasing power years earlier, leaving little money available to start making up for investments and spending they postponed during the downturn.
Analyzing partial data for the first three months of 2014, the Nelson A. Rockefeller Institute of Government at the State University of New York found the weakest growth in state tax revenue since early 2010, with declines in personal income taxes possible in some states and unexpected softness in sales tax collections as well. In April, the deadline for federal and most state income tax returns, revenue forecasters in several states, including Connecticut, Kansas, Massachusetts, New Jersey, and North Carolina, were unpleasantly surprised with lower-than-expected collections. States may be seeing a drop partly because some taxpayers claimed capital gains in fiscal 2012 to avoid a federal rate increase the next year, leading to a one-time bounce in tax receipts.
About the data
Using U.S. Census Bureau data that had been updated by the Rockefeller Institute, Pew adjusted for inflation and averaged dollars across four quarters to account for seasonal variation. Adjusting for inflation is just one way to evaluate state tax revenue growth. Different insights would be gained by tracking revenue relative to population growth or state economic output.
The latest data are subject to revision but are useful in comparing trends among the 50 states. (See methodology.)
Analysis by Barb Rosewicz and Alex Boucher
ADDITIONAL RESOURCES
Fact Sheet


