Tools for Sustainable State Budgeting
Long-term budget assessments and stress tests promote fiscal resilience

Editor’s note: This page was updated on May 22, 2024, and again on Dec. 6, 2024, to indicate that Colorado produced a budget stress test in November 2022, making it one of just nine states to have published both types of studies at the time this research was first published. Visit Pew’s long-term budget assessment and budget stress test database for an up-to-date inventory of states that use these analytical tools.
Overview
Responsible state fiscal policy requires more than just balancing the current year’s budget. It must also include ensuring that the budget is on a sustainable path. Otherwise, policymakers cannot have the lasting impact they hope for: They may act to improve state services or cut taxes only to have to scale those efforts back later. This risk is especially high in the aftermath of the COVID-19 pandemic. Record budget surpluses, driven largely by federal pandemic aid, empowered states to adopt historically large tax cuts and spending increases from 2021 to 2023, investments that many state leaders hope to build on in coming years.1
Going forward, state leaders must be able to assess whether their decisions will be affordable over the long term or will jeopardize their ability to solve state problems or even sustain programs and services in the future. Unfortunately, the nature of state budget processes discourages such long-term thinking. State policymakers devote much of their time to developing, enacting, and implementing annual or biennial budgets, a core government function and a prime opportunity for lawmakers to achieve immediate policy goals.
One key strategy for changing this short-term focus is for states to use two analytical tools—long-term budget assessments and budget stress tests—to regularly measure risks, anticipate potential shortfalls, and identify ways to address impending challenges. Long-term budget assessments project revenue and spending several years into the future to show whether and why states may face chronic budget deficits. Stress tests estimate the size of temporary budget shortfalls that would result from recessions or other economic events and gauge whether states are prepared for these events.
Ongoing deficits and temporary shortfalls have different causes that require different solutions, but they both jeopardize states’ ability to afford in the future the commitments made today. When used together, long-term assessments and stress tests can help states avoid those pitfalls and provide key insights to inform some of states’ most consequential decisions. For example, when federal COVID-19 pandemic funding yielded surpluses, lawmakers in several states used these tools to help them weigh the long-term fiscal risk of various decisions against the opportunity to pursue long-deferred priorities.
Policymakers understand that their states will need to provide schools, roads, prisons, and health insurance indefinitely, and by measuring the risk of future budget imbalances, long-term assessments and stress tests can help them anticipate whether the state will have the capacity to do so. For instance, Rhode Island has examined how lowering taxes might affect its ability to cover its costs in five years; Maryland has monitored the risk that a new education funding law will lead to budget shortfalls later; and Montana has analyzed whether the state has enough reserves to withstand the next downturn.2
In this way, long-term assessments and stress tests offer warnings when a state’s budget is on an unsustainable trajectory—allowing policymakers to adjust before problems become severe. But they are just as valuable when they deliver good news, because they show when states can afford new investments without threatening long-term fiscal health.
Recognizing the need for this kind of longer-term perspective in state budgeting, The Pew Charitable Trusts considered three questions: Which analytical practices ensure that long-term budget assessments and budget stress tests are of sufficiently high quality to produce realistic, comprehensive, and policy-relevant results? To what extent are states adopting these tools and following those practices? And are policymakers using these tools to make decisions and improve the long-term sustainability of their budgets? To answer these questions, Pew researchers interviewed experts and officials, and analyzed long-term budget assessments and budget stress tests in depth. See Appendix B for the detailed methodology.
Based on this research, this report provides the first 50-state inventory of long-term assessments and stress tests and offers a guide for how every state can make progress—whether a state has never used these tools or has done so for years. For each state that produces one or both analyses, Appendix A includes fact sheets describing the state’s strengths and opportunities to improve.
Key findings of this research are:
- A diverse group of states use long-term budget assessments and budget stress tests. Since 2018, 15 states have produced long-term budget assessments and 13 have conducted stress tests, which have gained popularity particularly quickly: The concept of budget stress testing is less than a decade old. (See Figure 1.) Eight states have produced both. This group—Alaska, California, Connecticut, Maryland, Montana, New Mexico, New York, and Utah—includes states on the East Coast and in the West, with Republican and Democratic legislative majorities, and with strong and weak fiscal track records. What they have in common is well-established legislative fiscal or executive budget offices with the authorization and technical capacity to conduct robust analyses.
- Long-term budget assessments and budget stress tests inform policy decisions. Policymakers throughout the country already have used these tools to make critical decisions involving billions of dollars and, in some cases, to alter their states’ fiscal trajectory. For example, after New Mexico’s 2022 long-term assessment found that declining oil and gas production would eventually lead to a persistent deficit, lawmakers in the state directed hundreds of millions of dollars to endowments and trust funds designed to provide ongoing revenue to help close the gap.3 And Utah used its stress test to create a detailed plan for closing temporary budget gaps and then put the plan into action in 2020, limiting negative consequences for residents and the economy.4
- States that produce one or both analyses still have room to improve. Many states that use these tools would benefit from increasing the rigor of their analyses, broadening their scope, and drawing clearer conclusions. For instance, many stress tests examine how recessions would affect revenue but not how they would affect spending, and long-term budget assessments often focus only on the general fund rather than including other accounts, such as transportation funds, that are at risk of deficits. As more states adopt these tools, they can learn from the meaningful progress other states have already made to develop effective methodologies and present compelling findings that can inform policymaking.
- Many states that do not use long-term budget assessments or budget stress tests do conduct other analyses that could be a starting point for adopting these tools. For example, 15 states and Washington, D.C. have produced long-term revenue and spending projections but have not yet used those projections to assess ongoing budget sustainability, such as to examine the reasons for an expected surplus or deficit. Similarly, several states analyze how a recession would affect revenue collections but do not assess their preparedness for those scenarios—a necessary component of a budget stress test. By learning from the examples of other states and implementing these two tools, these states could ensure that key budget decisions are based on evidence, not educated guesses.
Figure 1
Source: Pew analysis of state documents and information provided by state officials
Threats to long-term budget sustainability: Structural deficits and temporary shortfalls
Every state faces years when revenue collections are insufficient to pay for spending demands. But when budget imbalances are deep or frequent, the consequences can be far-reaching. And although state leaders almost always find a way to close budget gaps as most states’ laws require them to do, they often struggle to balance their budgets without harming residents and the economy.5 They can raise taxes, but then businesses and workers keep less of what they earn. They can cut agency funding, but that often means, for example, that already understaffed prisons face further personnel cuts, or overburdened child welfare investigators must take on even larger caseloads. They can pass the cuts on to local governments, but that leaves cities and towns less able to tackle problems such as crime and homelessness.
To avoid these outcomes, states need to prevent or prepare for the two main causes of budget shortfalls: structural deficits and temporary gaps.
Structural deficits
When ongoing revenue is insufficient to support ongoing spending over the long term, a state has a structural deficit. For example, if revenue grows 2% a year on average and spending grows 3% a year, spending will eventually exceed revenue—and the gap will get bigger and bigger over time.
Structural deficits often result from factors largely outside states’ control, such as economic, demographic, or technological shifts that alter the trajectory of revenue or spending. For example, starting around 2000, Michigan endured more than a decade of painful cuts to colleges, prisons, libraries, and the state police as the downsizing of the auto industry bit into revenue.6 Similarly, Alaska has faced structural deficits since fiscal year 2014, largely because prices for oil—a key factor in the state’s revenue collections—have often been too low to keep the budget balanced.7
States such as Michigan and Alaska, which depend heavily on a single industry, are especially vulnerable to structural deficits, but every state is potentially at risk. For example, demographic changes that promise decreased revenue and increased spending demands—fewer working-age adults, low fertility rates, and aging populations—are nearly universal.8
Although states can prevent these challenges from causing structural deficits by diligently balancing revenue and spending, leaders’ immediate imperatives often stand in the way. In good years, lawmakers often face pressure to aggressively increase spending or cut taxes. In bad years, they prioritize preserving services even if that means postponing spending on long-term obligations. But these decisions tend ultimately to reduce revenue and increase costs, leading to deficits.9
Further, once in place, structural deficits are exceptionally difficult to eradicate. Over time, they force lawmakers to take ever more drastic steps to balance their budget, creating a vicious cycle in which structural deficits lead to short-term fixes that exacerbate deficits.10 For example, Illinois spent more than it collected in revenue every year from fiscal 2006 through fiscal 2020 and then balanced the annual budget in part by delaying payment to hundreds of vendors, including scores of small businesses and nonprofit organizations.11 But this just made the problem bigger because Illinois pays up to 12% annual interest on unpaid bills.12 (The state has made progress getting the problem under control.13)
Even if states do not reach Illinois’ low point, structural deficits can force policymakers to dedicate an outsize portion of the budget to old commitments at the expense of key tax or spending policy objectives. In Kentucky, for instance, funding for state universities and community colleges declined 14% from 2010 to 2020, not because lawmakers undervalued higher education but because they had to direct significant revenue to long-neglected obligations such as the state’s public pension system.14
Temporary shortfalls
Even states with structurally balanced budgets will face years when temporary factors—most notably, economic downturns—cause revenue to fall short of spending demands. If fewer people are employed or the stock market falls, income tax collections typically decline. Similarly, if consumers have less disposable income, sales tax collections will probably decrease.15 And at the same time, economic downturns often increase government spending demands because more people qualify for means-tested programs, especially Medicaid.16
Further, although the causes of these budget gaps are temporary, the consequences can be long-lasting. As states act to bring their budgets back into balance, residents may face service cuts or tax increases during economic downturns, when they can least afford them.17 For example, per capita K-12 education funding fell by 7% as a result of the 2007-09 Great Recession, “the largest and most sustained decline in national per-pupil spending in over a century.”18 As a result, students were less prepared for careers and college: Evidence suggests that test scores and college-attendance rates fell because of the cuts.19 Even as the economy improves after a recession, states often face protracted budget challenges as demand for statutorily mandated services, such as Medicaid, remain elevated and revenue is slow to recover. Nearly a decade after the 2007-09 recession, states were still spending less than before the crisis started on core priorities such as education, infrastructure, and local government aid.20
States can manage temporary shortfalls if they plan ahead, such as by saving money in rainy day funds for use during recessions. Every dollar a state uses from rainy day funds is a dollar of budget cuts or tax increases it avoids. But historically states have struggled to prepare. For example, facing deep pre-existing budget problems and little money in reserves, California borrowed to pay for operating expenses and delayed payments to school districts and local governments to balance its budget during the 2007-09 recession.21 As a result, by 2011 the state had taken on $35 billion in liabilities—which then-Governor Jerry Brown (D) termed a “wall of debt”— exacerbating the state’s already serious structural budget problems.22
What are long-term budget assessments and budget stress tests?
State leaders are better able to ensure their budgets stay on a sustainable path when they have data and analysis detailing their state’s risks and long-term outlook. Long-term budget assessments and budget stress tests provide the information policymakers need.
Although the concepts of budget stress tests and long-term budget assessments will be familiar to many in state government, the names themselves may not be. “Budget stress test” is an increasingly common term of art, but not all states use it. “Long-term budget assessment” is a term that Pew developed during this research to describe analyses with various names depending on the state, such as “Long-Range Financial Outlook” (Florida), “Three-Year Budget Forecast” (Illinois), and “Five-Year Financial Projection” (Rhode Island).23
One purpose of this report is to propose shared terms and definitions for these tools to foster a common understanding of how states should analyze their long-term fiscal sustainability, which states are meeting this standard, and how others can improve. To that end, Pew developed specific definitions for both analytical tools.
Pew defines long-term budget assessments as analyses that:
- Identify key revenue and spending categories central to budgetary balance. States that analyze most or all revenue and spending in their general funds or other primary operating accounts meet this criterion. Even states that do not include the entire general fund could meet this criterion if the analysis provides a rationale for why the revenue and spending categories studied are important for long-term fiscal health, such as an analysis of “key budget drivers” that are most likely to determine future fiscal balance. However, an analysis of a single programmatic area—such as an analysis of transportation revenue and spending—would not be broad enough.
- Project balance between revenue and spending at least three fiscal years into the future. Current-year projections do not count toward the three years, but upcoming years do even if the state has already written a budget for those years. The three-year standard ensures that analyses include at least one year of projections beyond the upcoming budget period, even in states with biennial budgets. Analyses could also meet this criterion by using reasonable alternatives to revenue or spending, such as projecting appropriations instead of spending.
- Use projections to analyze ongoing fiscal sustainability. Analyses could meet this criterion by assessing whether revenue collections are likely to be sufficient to pay for spending demands and why or why not, by identifying key risks or factors that could lead revenue to fall short of spending, or by making recommendations for how the state could maintain long-term budget balance. However, simply offering a table or graph comparing projected revenue and spending would not on its own meet this criterion. Nor would identifying factors relevant to only specific revenue sources or spending categories, absent substantive discussion of overall budget sustainability.
Figure 2 illustrates this definition by providing a sample long-term budget assessment. Additionally, this research uses the term “long-term projection” to describe an analysis that meets the first two criteria for a long-term assessment, but not necessarily the third. Therefore, every long-term budget assessment includes a long-term projection, but not every long-term projection is a long-term budget assessment.
|
Figure 2 Long-Term Budget Assessments Help States Measure Fiscal SustainabilityKey elements and sample results |
||
Step 1Identify key revenue and spending categories |
Step 2Project budget balance in these categories at least three fiscal years into the future |
Step 3Use projections to analyze ongoing fiscal sustainability |
|
In this example, the state has a small surplus in Year 1, but slow revenue growth and accelerated expenditure growth lead to deficits starting in Year 3. A long-term budget assessment would anticipate these deficits and explain why they are expected, for instance by discussing the probable reasons for rapid growth in key spending categories and for declines in certain revenue sources. |
||
 |
||
Pew defines budget stress tests as analyses that:
- Identify a possible temporary scenario or range of scenarios that could cause budget stress. Analyses could develop scenarios by identifying past occurrences of budget stress such as previous economic downturns or revenue declines and estimating what would happen in a future similar stress event. Or they could use projections of economic variables under a potential downturn. Analyses that focus on long-term trends, such as population loss, rather than temporary downturns do not meet this criterion.
- Analyze the potential effects of a given stress scenario or range of scenarios on general budget conditions. Analyses could meet this criterion by analyzing the effects of the stress scenario on collections from major general fund revenue sources or other major sources used for general purposes. Although Pew recommends that stress tests analyze the effects of scenarios on both revenue and spending, analyses could meet this criterion even if they did not include spending because research shows that recessions have smaller effects on spending than on revenue.24 However, analysis of an individual revenue source or an individual spending category alone would not generally meet this criterion.
- Compare the negative effects of a given scenario with available or needed contingencies for addressing those effects. The most common contingency that states analyze is their rainy day fund balance, but they could also include other budget balancing strategies such as potential revenue increases, spending reductions, or accounting maneuvers. To meet this criterion, analyses could put a dollar figure on these contingencies and compare it with the effects of the stress scenario. For example, an analysis might find that a moderate recession would reduce revenue by $1 billion and that the rainy day fund balance is $500 million, leading the analysis to conclude that the state is not sufficiently prepared for this scenario. States could also meet this criterion by presenting their results as recommendations for the size of contingencies. Using the same example as above, the analysis could recommend that the state increase its rainy day fund balance to $1 billion to prepare for a moderate recession.
Figure 3 illustrates this definition by providing a sample budget stress test.
|
Figure 3 Budget Stress Tests Measure Risk From DownturnsKey elements and sample effects on revenue and spending for mild and severe recessions |
|
|
Identify a possible temporary scenario or range of scenarios that could cause budget stress. |
|
 |
|
|
Analyze the potential effects of the stress scenarios on general budget conditions. 
|
Compare the negative effects of the scenarios with available or needed contingencies for addressing such effects. The results show that the state has sufficient reserves and contingencies to offset the effects of a mild recession but not a severe one. 
|


How the tools encourage sustainable budgeting
Long-term budget assessments and budget stress tests can inform many of states’ most consequential decisions, including how much to tax, spend, and save. These tools measure the risk of structural deficits and temporary shortfalls to give lawmakers the data and analysis they need to keep policy priorities on track, even in the face of fiscal challenges.
Long-term budget assessments address structural deficits
To prevent or alleviate structural deficits, states must understand their long-term revenue and spending outlook and act to maintain budget balance. Long-term budget assessments help states do just that.
The need for a long-term perspective to prevent these outcomes has never been more apparent than since 2020. The COVID-19 pandemic initially caused a massive drop in tax revenue, but within a year state budgets had swung from historic deficits to equally historic surpluses.25 Although state policymakers naturally welcomed the surpluses, the windfall also led to a quandary: In the short term, states clearly could afford substantial new investments, but what about the longer term? Temporary factors, especially massive federal aid, were driving the surpluses, so if states went too far in increasing spending or cutting taxes, they risked creating or exacerbating structural deficits.
Forward-thinking states used long-term budget assessments to inform their choices. Rhode Island, for example, was enjoying the same strong fiscal conditions as other states, expecting to finish fiscal 2023 with a large surplus.26 But the governor’s annual budget proposal—which always includes five-year revenue and spending projections and detailed discussions of the factors and risks influencing the outlook—clearly showed that the boom was fleeting. The state still expected a small surplus for fiscal 2024 but anticipated deficits for the next four years, meaning any ongoing spending increases or tax cuts would widen the coming gap.27
In light of those findings, Rhode Island’s leaders acted cautiously. Lawmakers adopted new funding for some top priorities such as affordable housing; postponed action on others, including a sales tax cut; and used some of the surplus to strengthen the state’s long-term fiscal position, such as by creating an additional reserve account and paying off debt.28 Ultimately, Rhode Island‘s long-term budget assessment enabled state leaders to craft an approach that pursued some key goals and reduced the risk that those achievements would be undone in the years ahead.
Rhode Island’s approach stands in contrast to those of many other states. Overall, states increased general fund spending in fiscal 2022 by the largest percentage since at least 1979, and then enacted the largest tax cuts in more than two decades the following fiscal year.29 (In fairness, many states also made decisions designed to avoid jeopardizing long-term fiscal health such as bolstering their rainy day fund balances to record levels and focusing on one-time projects and one-time tax rebates.30) Whether these decisions created new structural deficits is a critical question—and one states can answer only if they analyze revenue and spending over the long term.
Long-term budget assessments empower states to not only manage existing structural deficits, but also to avoid them in the first place. Perhaps no state has identified a fiscal challenge looming as far in the future—and acted pre-emptively to address it—as New Mexico. At a July 2022 meeting of the Legislative Finance Committee (LFC), a nonpartisan group of committee staffers presented lawmakers with projections for recurring revenue and spending out to fiscal 2050. In the short and medium terms, the state’s position was strong. But starting in about 15 years, the projections showed that the state would face regular and growing deficits, driven mainly by expected declines in oil and gas production as the global economy transitions to alternative energy sources.31 New Mexico’s economy and its revenue system are highly dependent on oil and gas drilling.
Fortunately, the LFC staffers explained, the deficits were not inevitable, and the state could improve its long-term position by using its temporary surpluses wisely.32 New Mexico lawmakers did exactly that in 2023. To reduce the risk of deficits and shore up long-term sustainability, they added about $700 million to various endowments and trust funds—a massive amount for a state with recurring general fund spending of less than $10 billion—which will generate investment earnings to bolster the budget in perpetuity.33
New Mexico has produced long-term projections for years, but they were treated mostly as an afterthought in policymaking.34 The difference in 2022 was that the LFC staffers brought their findings directly to lawmakers and offered a convincing explanation of the problem and its cause. Going forward, the LFC plans to update the projections regularly, recognizing that the problem is probably not completely solved.35
Alaska’s experience illustrates another benefit of long-term budget assessments: They can help lawmakers find common ground. In the summer of 2021, after years of lagging oil prices had sapped Alaska’s primary revenue source and put the state on an unsustainable course, the Legislature created the Fiscal Policy Working Group—a bipartisan, bicameral panel of eight lawmakers—to determine how to bring the budget back into long-term balance.36 The working group used modeling developed by the state’s Legislative Finance Division, which provides long-term projections reflecting various policy options, to agree on a set of assumptions about what future revenue and spending would be absent policy changes.37
Then, starting from those assumptions, each member of the group developed a separate plan for closing the structural deficit.38 For example, members could model how creating a personal income or sales tax—Alaska lacks both—would increase revenue.39 This approach, says former state Representative Jonathan Kreiss-Tomkins (D), who helped lead the group, “set up a structure where legislators were working with factual and mathematical information, not ideological convenient assumptions.”40
This hard look at the numbers drove home the need for compromise. Republican legislators who had opposed new taxes and Democrats who were skeptical of reduced spending both realized they would need to give something up. The working group ultimately agreed to a grand bargain, pairing $500 million a year or more in new revenue with spending cuts and a tightened cap on spending growth.41 At this writing, the full Legislature had not acted on those recommendations, but the working group’s framework has served as the starting point for fiscal discussions ever since.42
Stress tests improve preparedness
Since 2010 the federal government has required banks to conduct stress tests to “assess their ability to absorb losses, continue lending, and meet credit obligations.”43 Soon after, a few states began adapting the concept to study their own budgets. Less than a decade ago, only early adopters such as Minnesota and Utah were producing budget stress tests.44 Today at least a dozen states have done so, and the spread of stress testing has helped states to improve savings policies after many states’ rainy day fund balances proved insufficient to avoid painful budget cuts and tax increases during and after the 2007-2009 recession.45
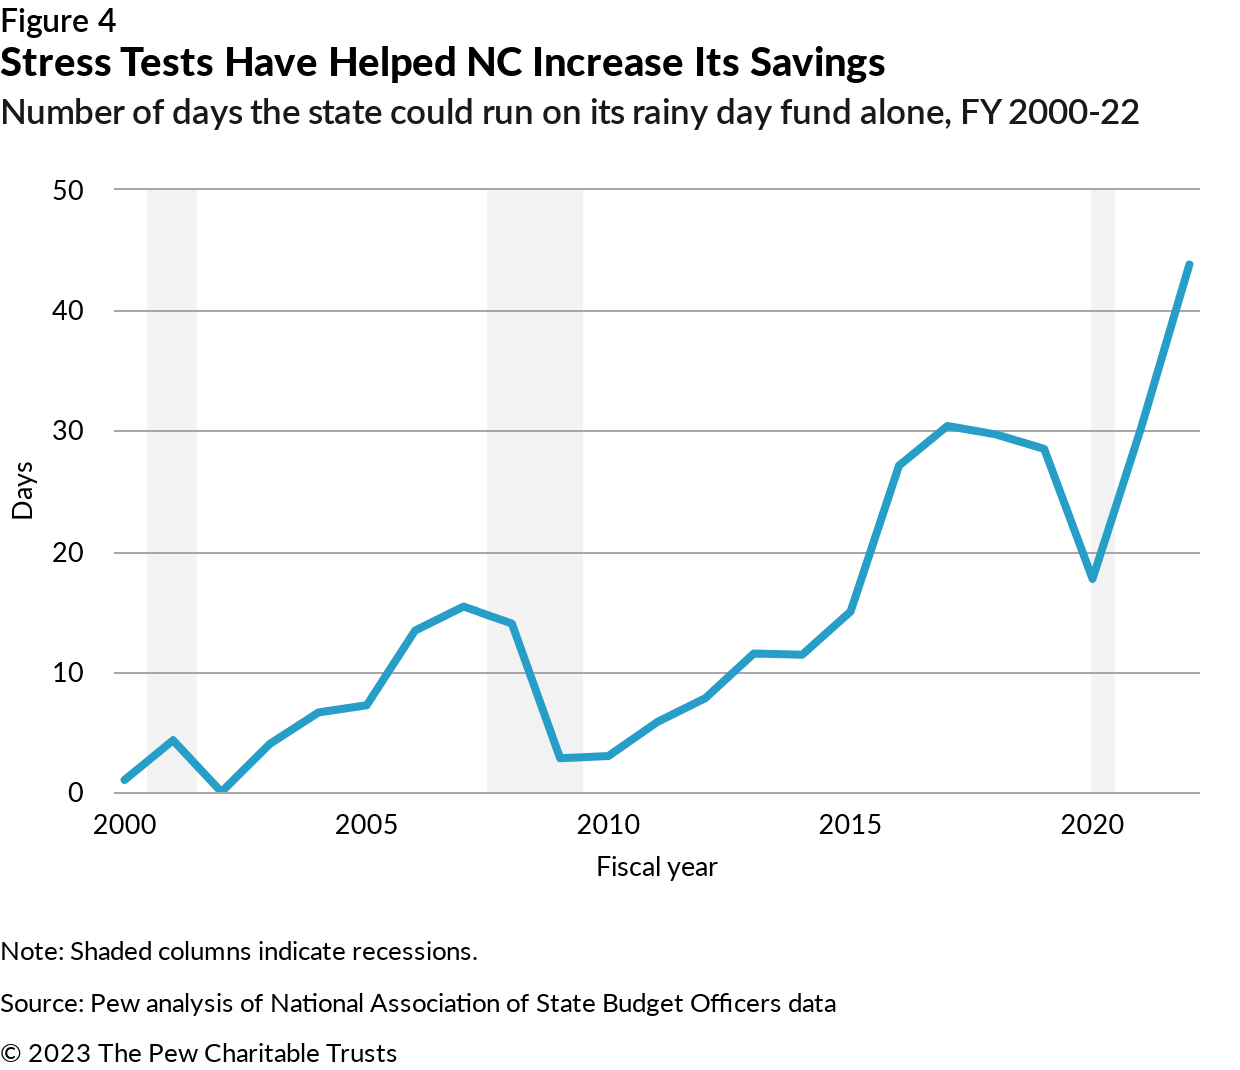
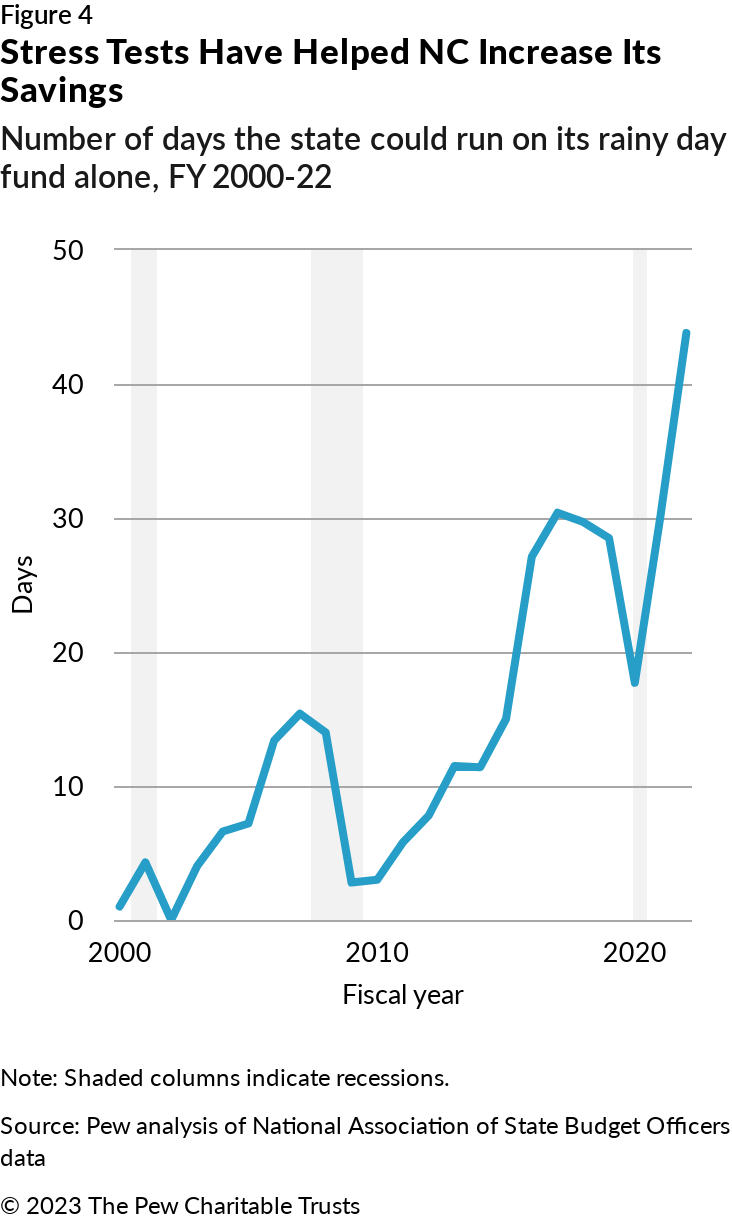
For instance, North Carolina’s budget remained badly out of balance in 2009 even after lawmakers nearly emptied the rainy day fund. So, with residents and the state economy already reeling from a double-digit unemployment rate, lawmakers enacted income and sales tax increases and the largest budget cuts in state history.46 Since then, however, North Carolina has adopted stress testing and savings policies to reduce the likelihood of similar draconian actions in the future. (See Figure 4.) Under a 2017 law, legislative and executive branch fiscal staffers team up every year to produce a stress test and recommend the level of savings the state needs. And the state automatically deposits a portion of year-over-year revenue growth into the rainy day fund until that target is reached.47 As a result, North Carolina was far more prepared for its next crises. The state spent hundreds of millions of dollars from the rainy day fund after Hurricane Florence in 2018, but it still had $1.2 billion available as a backstop when revenue collections fell at the start of the COVID-19 pandemic.48 And North Carolina has since restored the rainy day balance to the target identified by the stress test, thanks to the automatic deposit rule and strong revenue growth.49
Third-Party Stress Tests Are Not a Substitute
As states have begun stress testing their budgets, credit rating agencies and consulting firms have embraced this analytical tool as well.50 Moody’s Analytics, for example, has produced an annual stress test of all 50 state governments’ preparedness for a recession since 2017. These analyses estimate how far each state’s revenue would fall and Medicaid spending would increase under various scenarios and then compare these effects with reserve balances to determine whether each state is prepared.51
The Moody’s Analytics reports have helped popularize the concept of stress testing state budgets, offering a general comparison of states’ preparedness for recessions and a useful methodological model.52 But as the authors point out, these reports are not a good excuse for states to fail to produce their own stress tests because states can customize their analyses for their unique budgets, economies, and tax structures and have access to data that outside organizations lack.53
Like North Carolina, many states have rightly celebrated their increased savings in recent years. Nationally, median rainy day fund balances have doubled as a percentage of state spending since fiscal 2016.54 But record rainy day fund levels by themselves do not guarantee that states are ready. In Montana, a September 2022 stress test from the Legislative Fiscal Division (LFD) showed the state lacked sufficient savings to offset plausible budget shortfalls.55 Representative Llew Jones (R), chairman of the Montana House Appropriations Committee, explained that at first, legislators experienced sticker shock at the size of the necessary reserves. But because they understood that individuals need savings to be ready for lost jobs, car troubles, or medical crises, “it was pretty easy to say, ‘Don’t you think the state should do the same?’” Jones says.56 In the 2023 legislative session, Montana increased the cap on the state’s rainy day fund by more than 250%.57 As Montana’s example shows, only by analyzing the effects of possible recessions can policymakers be sure they will avoid the worst consequences of temporary budget gaps.
Stress testing can also help states develop tools and strategies other than rainy day funds for managing downturns and shortfalls. In Utah, for example, the state’s stress test features a “fiscal sustainability toolkit,” with options to balance the budget when faced with real-life stress scenarios, including various revenue increases, spending cuts, and reserves.58 And in the early stages of the pandemic, this planning paid off. The state used strategies from the toolkit to balance the budget while minimizing harm to residents and the economy. For example, by paying for infrastructure projects largely in cash in most years, Utah reserves its borrowing capacity for moments of fiscal stress. As revenue collections fell in early 2020, the state redirected cash from a prison project in Salt Lake City to balance the budget and shifted to greater borrowing to pay for the prison construction. This approach reduced cuts to services while keeping a priority project on track.59
But stress tests are not valuable only when states face stress or have not saved enough; they can also reaffirm when states are well prepared. Setting money aside in savings generally means forgoing opportunities to invest elsewhere, and stress tests can help states know when they have sufficient savings and can use more revenue for other priorities. With state reserves at record levels, it is especially important for states to use stress tests to determine whether they are saving too much—or if, despite the historic balances, they still have not saved enough. Utah’s 2022 stress test for instance, included the welcome finding that the state’s reserves and other fiscal buffers were sufficiently stocked to balance the budget even in a severe recession, although not all of these reserves could be tapped easily or without some degree of pain.60
How are states doing?
To determine which states are using long-term budget assessments and budget stress tests, Pew researchers gathered and evaluated more than 200 state documents to determine whether the analyses met the above definitions. This process involved reviewing existing research and conducting online searches of state websites to find potential long-term budget assessments and budget stress tests. Pew also contacted at least one legislative branch and executive branch official in every state and asked them to share documents that might meet the definitions. To be included in Pew’s study, states’ analyses or their findings had to be publicly available and published on or after Jan. 1, 2018. See Appendix B for Pew’s full methodology.
This research found that since the start of 2018, 13 states have published at least one budget stress test (see Figure 5), 15 have published at least one long-term budget assessment (see Figure 6), and eight—Alaska, California, Connecticut, Maryland, Montana, New Mexico, New York, and Utah—have done both. Many of these analyses have helped inform states’ most fundamental fiscal decisions, such as how much to save and how much to spend. And although most states do not yet use these tools, enough do to provide a robust set of models for others to follow. As of summer 2023, at least four states were working to produce stress tests for the first time: Alabama, Massachusetts, Oklahoma, and Nevada.61
Figure 5
Source: Pew analysis of state documents and information provided by state officials
States most frequently task legislative fiscal offices with producing long-term budget assessments and budget stress tests. These offices’ nonpartisan perspective and expertise on the revenue and spending sides of the budget make them a natural fit for this work. A handful of other states tap executive budget offices to do this work either on their own or jointly with legislative fiscal offices. Revenue forecasting bodies also conduct stress tests in states such as Maine—estimating revenue under stress scenarios is a logical extension to estimating revenue under expected scenarios.62
Like the processes for producing these analyses, the states that use them differ in many respects, representing every region of the country, geographic and population size, and political leanings. The states also vary widely in overall fiscal health. Maryland and Utah, states with top AAA credit ratings, use both tools, but so do states with a history of chronic budget imbalances, such as Alaska, California, Connecticut, and New York.63 In some cases, these budget challenges motivated policymakers to seek data and analysis on the state’s long-term fiscal condition.
Even states that do not use one or both of these tools often have taken some steps toward long-term analyses. Fifteen states and D.C. project revenue and spending at least three years into the future but do not use those projections to assess sustainability, a necessary component of a long-term budget assessment. (See Figure 6.) Additionally, Oregon and Washington state analyze how recessions would adversely affect their budgets, but they do not take the final crucial step for a stress test: comparing those effects to the available contingencies.64
Figure 6
Source: Pew analysis of state documents and information provided by state officials
How states can improve
States have made meaningful progress measuring long-term sustainability, but every state still has room to improve. All states should begin by embracing three common principles that address widely shared weaknesses in current approaches. But to ensure that their analyses provide policymakers with the most accurate, comprehensive, and policy-relevant information, they also will need to adopt a set of leading practices for each of the tools.
Common principles
Publish the results
When states publish their long-term budget assessments and stress tests, everyone involved in policy development—legislators, executive branch officials, government staff, and other stakeholders—can consider the findings. Publicly available analyses often prompt legislative hearings, allowing lawmakers to question the authors and draw conclusions on the best way to use the results.
However, several states that report producing long-term analyses do not share the results publicly. In interviews with Pew researchers, states gave a range of reasons for not publishing the analyses. Some regard the numbers as too speculative or think their methodology needs refinement. Others worry that policymakers—especially political opponents—will misinterpret or misuse the findings. Still others cite the time it takes to turn an internal analysis into a published report. In some cases, analyses are produced at the request of individual legislators, who have control over whether they are made public.
But states that do publish have shown that these concerns can be overcome. For example, budget stress tests can estimate the likelihood of the scenarios they examine so policymakers understand whether the analyses reflect probable outcomes.
Further, some states that do publish their analyses do not do so consistently, particularly for stress tests. Almost all states that conduct long-term budget assessments publish a report at least annually, but only seven of the 13 states that publish budget stress tests follow a predictable schedule. Five (Alaska, Connecticut, Maryland, Montana, and New York) have produced multiple stress tests but have not published them on a consistent schedule, while Tennessee has produced only one. Regular analysis is crucial to inform the key decisions state leaders make with each new budget, such as how much money to save in reserves; for that reason, states should at a minimum publish updated long-term assessments and budget stress tests as part of the development of each new budget.
Draw conclusions
The primary purpose of long-term budget assessments and budget stress tests is to inform policymakers’ decisions. The analyses are much more likely to serve this purpose when the authors draw conclusions about whether the budget is on a sustainable path and why or why not—and present these conclusions directly to elected leaders. This approach has helped policymakers enact far-reaching reforms to, for example, strengthen reserves and improve structural balance.
But some states provide revenue and spending projections without clear conclusions, and those efforts have had an inconsistent influence on policy. In states such as South Dakota and Washington, spending and revenue projections have played a central role in budget decision making, with Washington even requiring that the Legislature adopt budgets that are balanced over the next four years.65 Elsewhere however, projections are published as a chart or table, without any discussion or analysis, and are often buried deep in budget documents where they are unlikely to capture elected officials’ attention.
Additionally, many long-term budget assessments and budget stress tests would benefit from clearer, timelier, more specific conclusions. Some states have produced long-term assessments regularly for so long that they have become stale and formulaic, occasionally even repeating findings nearly verbatim from one year to the next. But other states have made concerted efforts to keep their long-term assessments fresh and relevant. In California, for example, the Legislative Analyst’s Office provides original, timely analysis in each edition of its annual “Fiscal Outlook” report, tackling questions such as how much of a surplus the state can afford to dedicate to ongoing programs and whether the state’s constitutional spending limit could cause future budget challenges.66 Although some repetition is probably inevitable, states should focus on providing original analysis to help inform lawmakers’ decisions.
Include spending
To understand whether their budgets are on a sustainable course, policymakers need to understand the outlook for both revenue and spending. Several of the 20 states that do not produce comprehensive long-term fiscal projections already have half of what they need to do so: long-term revenue forecasts. Adding spending projections would allow them to begin estimating future surpluses or deficits. One reason revenue projections are more common is that state policymakers sometimes regard spending as something they dictate through the budget process rather than something outside their control that can or should be forecast.67 In this view, attempting to forecast spending is essentially an exercise in fortune-telling: An analyst would have to see into the minds of future legislators to know how much they will choose to spend.
But much spending is out of policymakers’ control. If, for instance, Medicaid enrollment exceeds expectations, the corrections department must pay more overtime than anticipated to maintain minimum prison staffing, or the courts find a state in violation of its K-12 education obligations, a state may spend more than legislators planned. And even when lawmakers do exert control, high-quality expenditure forecasts based on current laws and policies can contribute to better-informed budgeting by revealing upcoming surpluses or deficits and, with them, how much lawmakers can increase—or must cut—spending.
States could also improve their stress tests by including analyses of how recession scenarios would increase spending demands. Currently, most stress tests examine only the effects of downturns on revenue. By neglecting to consider spending, states risk understating the size of potential budget shortfalls and, therefore, failing to adequately prepare for them.68 Conversely, Utah includes in its stress tests estimates of how recessions would affect costs for Medicaid, higher education, and public employee pensions, as well as various revenue sources.69
Leading practices
Although expert interviews and a review of the research literature helped Pew identify these leading practices, more than anything they reflect lessons from the analyses themselves: The authors of the analyses often explain and justify their methodological decisions, and in doing so they offer a template for others. Pew’s researchers reviewed and synthesized those insights and interviewed the authors to refine this list. Importantly, these practices do not encompass everything a state should do when implementing long-term assessments or stress tests, but they do reflect key themes that emerged from Pew’s research.
Leading Practices at a Glance
For long-term budget assessments:
- Analyze revenue and spending across all funds and categories that could cause budget challenges.
- Project revenue and spending far enough into the future to account for deferred policy changes.
- Account for the impact of economic, demographic, and technological factors.
- Acknowledge uncertainty by showing how the numbers might vary under different scenarios, assumptions, or methodologies.
- Estimate whether ongoing spending aligns with ongoing revenue over the long term to assess structural balance.
- Analyze factors that could lead to long-term deficits, including identifying risks beyond the time frame of the analysis.
For budget stress tests:
- Examine multiple scenarios or a range of scenarios and estimate the likelihood of each.
- Measure the effects of the scenarios on all major economically sensitive revenue sources and spending categories.
- Compare the effects of the scenarios to reasonable baseline expectations for revenue collections and spending.
- Project far enough into the future to account for the full multiyear effects of the scenarios on the budget.
- Identify a broad list of contingencies to balance the budget in the event of stress.
- Assess whether these contingencies would be sufficient to offset the measured effects and, if not, present options to improve preparedness.
No state follows all the leading practices yet. Appendix A offers targeted ideas for implementing these practices for each of the 20 states that have implemented at least one tool, such as broadening the scope of their analyses, increasing their rigor, or creating stronger connections to the policymaking process.
Leading practices for long-term budget assessments
Analyze revenue and spending across all funds and categories that could cause budget challenges
General funds are states’ primary operating accounts. Most revenue from broadly applicable taxes is deposited in general funds, and this money is used to pay for many of states’ most important programs and services. With that in mind, many long-term budget assessments focus on general funds. However, by focusing only on general funds, states may fail to recognize key fiscal threats from the nearly two-thirds of state spending that occurs outside the general fund.70 States should instead include in their long-term budget assessments any fund where a shortfall could threaten the sustainability of the budget as a whole.
For example, in Connecticut, the General Assembly’s Office of Fiscal Analysis (OFA) and the executive branch’s Office of Policy and Management have warned about ongoing problems in the state’s Special Transportation Fund. Most recently, the OFA projected that starting in fiscal 2025, revenue in the fund will fall because of declining motor fuel taxes, while expenditures will continue to increase.71 The analyses have further shown that this outlook not only raises questions about future funding for transportation projects, but also jeopardizes overall budget balance. Because stagnating fuel tax revenue is a long-term trend driven by increased fuel efficiency and growth in electric vehicles, the transportation fund increasingly relies on a portion of sales tax collections, cutting into a key general fund revenue source.72
Project revenue and spending far enough into the future to account for deferred policy changes
How many years states should include in long-term budget assessments or other projections is a matter of debate. Some experts and state analysts emphasize that projections become highly speculative beyond only a few years, noting that governments struggle to forecast revenue and spending accurately even over the short term.73 States’ revenue forecasts for the upcoming fiscal year, for example, come with a significant potential for error.74 But other experts note that only when looking further out do future risks from factors such as gradual economic and demographic changes become apparent. The goal, they argue, is to identify these risks, not to produce perfect forecasts.75
States, then, should be guided by a commonsense principle: If a predictable event such as a pending policy change will materially change the budget outlook, the projections should include enough years to fully account for that event.76 For instance, tax cuts or new programs that phase in over multiple years can have a big impact on revenue and spending, so limiting projections to three or four years often is insufficient to measure the risk of imbalances. In 2022, at least seven states enacted major phased income tax cuts: Iowa’s, Mississippi’s, and Virginia’s could phase in by 2026, Nebraska’s by 2027, Georgia’s by 2029, and Kentucky and South Carolina’s with no set end date. Each state’s cut will reduce revenue by at least half-a-billion dollars annually if fully implemented.77
Despite the importance of accounting for these policies, states rarely adjust the time frames of their projections to do so, and instead, typically project out the same number of years every time. Arizona and Florida always include three years, for example, while Pennsylvania includes five.78 Often, the number of years is dictated by statute. States should consider a more flexible approach that sets a minimum number of years but encourages additional analysis if pending policy events could substantially change the findings in later years.
Account for the impact of economic, demographic, and technological factors
Over time, forces partially or entirely outside of states’ control can influence revenue and spending. For instance, higher prices for goods, services, and workers can make running a state government more expensive. An aging population can jeopardize revenue growth in states that exempt retirement income from taxation. And expensive new prescription drugs and treatments can lead to higher Medicaid costs.
High-quality, long-term budget assessments account for the impact of such economic, demographic, and technological factors. One good option for states is a “current services baseline” approach, which involves estimating the cost to maintain a consistent level of service over time—a stable teacher-to-pupil ratio, for example—to measure whether the budget is on track to stay balanced at existing service levels.79 That data forms the baseline from which to assess whether the state can afford to sustain or expand programs or may need to make cuts.
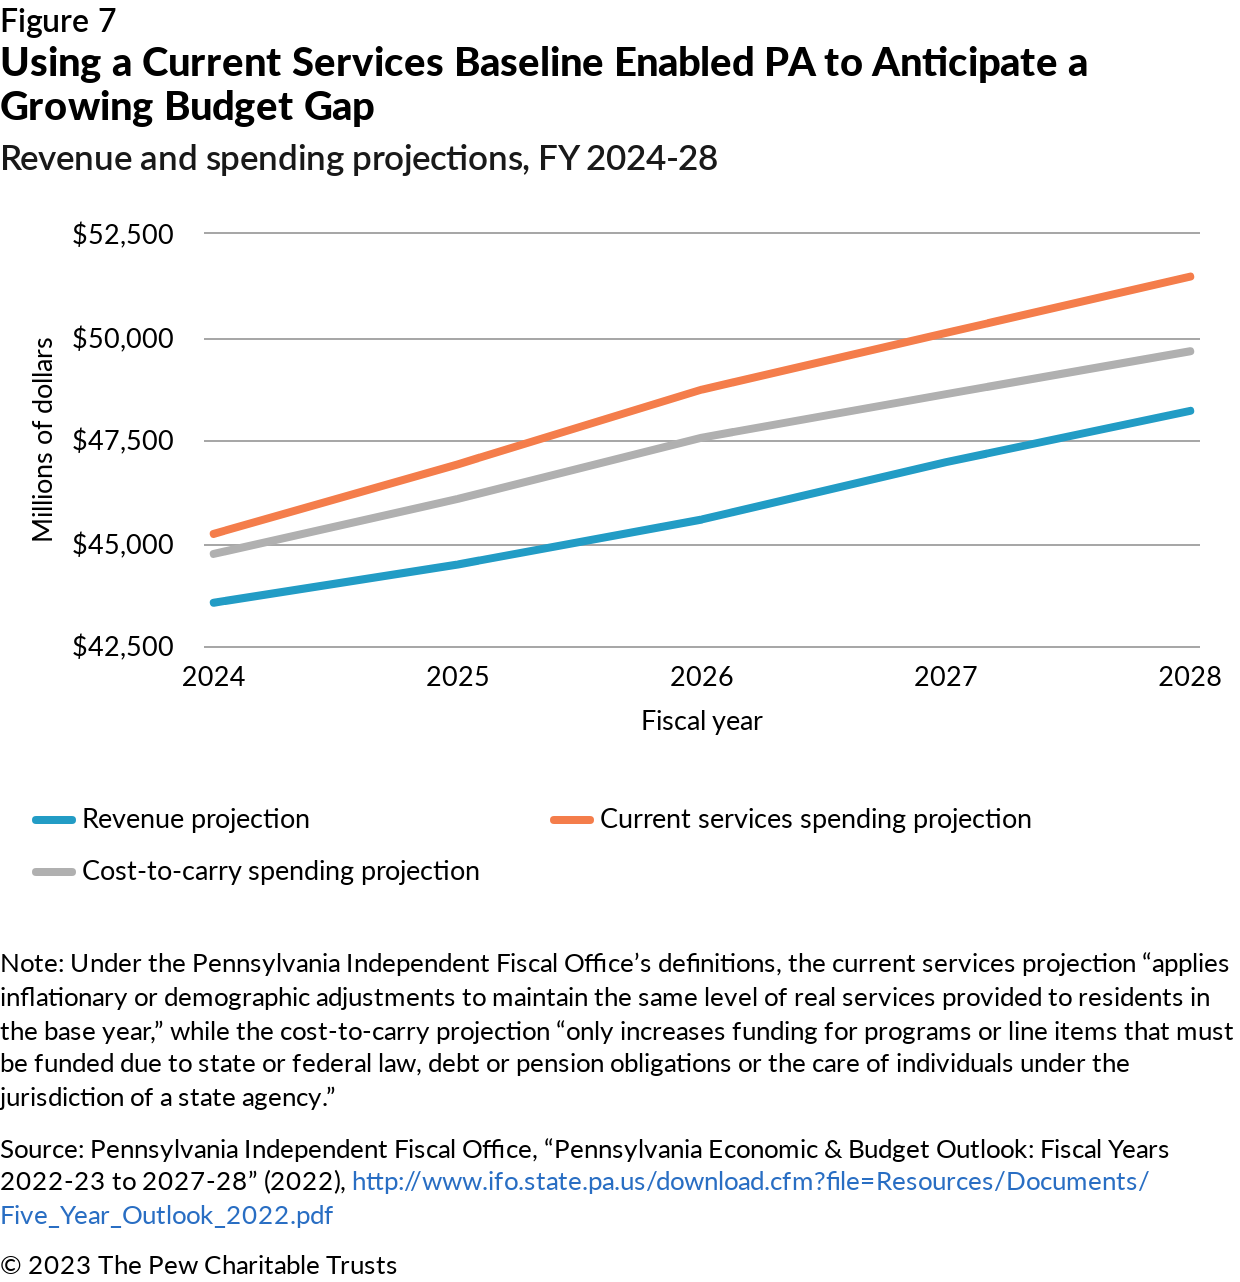
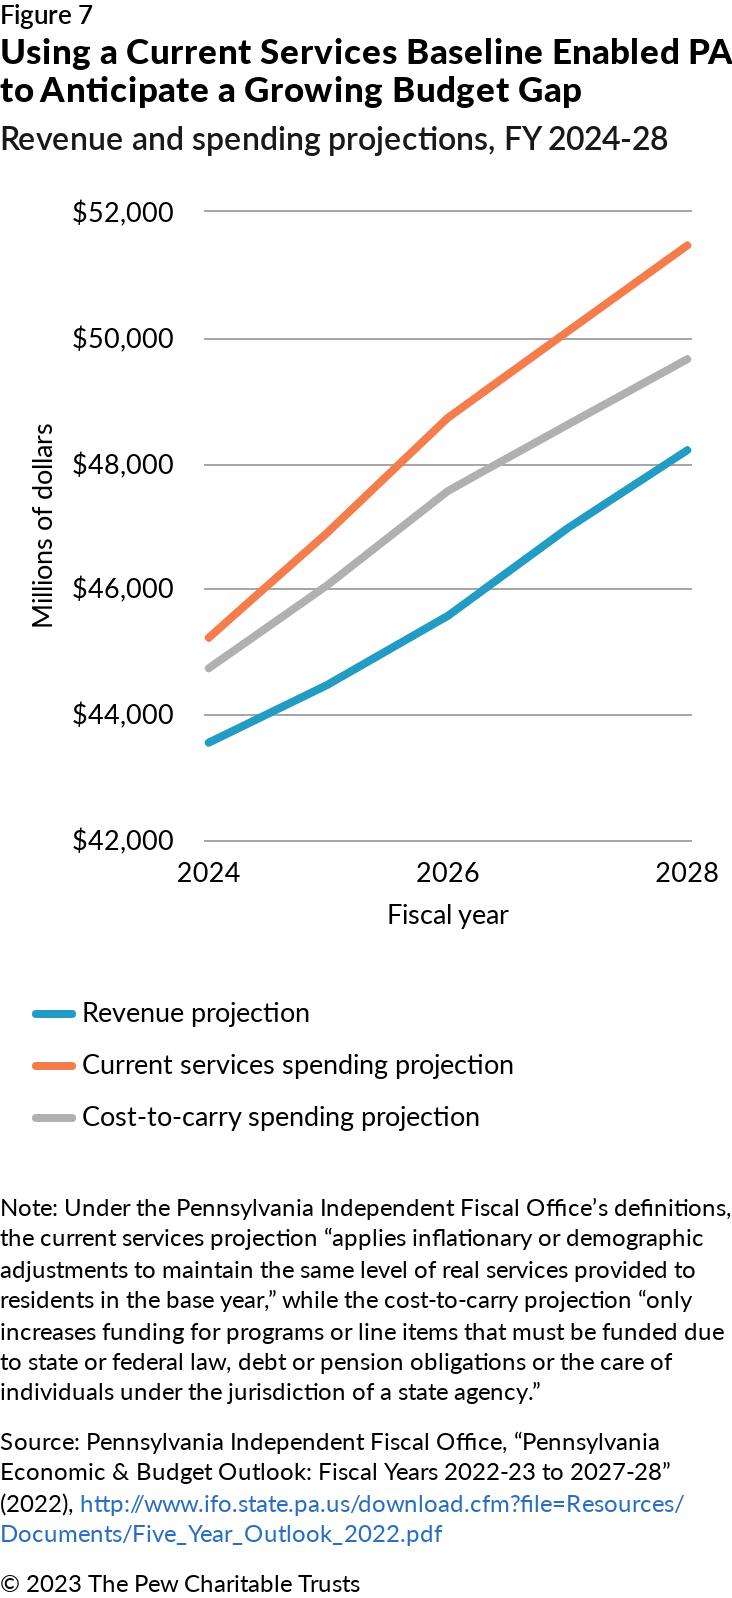
The five-year outlook from Pennsylvania’s Independent Fiscal Office (IFO) shows how using a current services baseline can help states more fully account for future spending demands. The IFO includes two projections in its annual five-year outlook. One is a current services baseline and the other is a “cost-to-carry” baseline, an approach that does not generally account for inflation and demographic changes and instead “only increases funding for programs or line items that must be funded due to state or federal law, debt or pension obligations or the care of individuals under the jurisdiction of a state agency.”80 In 2022, the IFO’s current services baseline showed a structural deficit that would grow to $3.1 billion by fiscal 2028, the final year of the projections. But using the cost-to-carry method, the deficit in fiscal 2028 was projected to be far less dire at $1.4 billion.81 (See Figure 7.) The biggest reason for the difference was that the cost-to-carry analysis did not incorporate expected growth in education spending.82
Using the current services baseline is especially important when inflation is high because of increased cost pressures. Montana’s 2022 long-term budget assessment included detailed projections for inflationary costs in part because the authors recognized that the state, which like many others was struggling with high employee vacancy rates, would need to raise wages to maintain staffing and service levels.83
Many analysts make the reasonable decisions to use a current services baseline to project spending for certain categories, but not all, in their long-term budget assessments. Instead, they may assume that some spending categories will continue to grow at historical rates or with inflation because they have data to produce current services forecasts for only certain core areas, such as education and Medicaid. What states should not do, however, is assume that spending will be flat, that they will need to increase spending only for legal obligations, or that proposals to reduce spending will be automatically enacted to bring the budget into balance.
Incorporating the effects of policy proposals is a valuable part of a long-term budget assessment. But states must start with projections based on current laws or policies to provide a neutral evaluation of budget balance or else they risk underestimating spending and making the state’s structural position look stronger than it is.
Acknowledge uncertainty by showing how the numbers might vary under different scenarios, assumptions, or methodologies
Doubts about the accuracy of long-term projections sometimes make states reluctant to produce or publish forecasts. However, rather than shying away from uncertainty, high-quality long-term budget assessments explain and contextualize it to help lawmakers understand the risks to future budget balance, the range of likely outcomes, and the probability of these outcomes.
In California for example, the Legislative Analyst’s Office (LAO), in its November 2021 “Fiscal Outlook” report, provided not only specific dollar estimates for revenue but also plausible ranges. The LAO then compared the ranges to spending projections and found that the state could face budget shortfalls in coming years, though this was not the likeliest outcome.84 Additionally, the LAO explained some of the key uncertainties, including whether inflation would remain higher than normal and whether unusually large revenue increases would continue.85 These warnings proved prescient a year later, when the LAO’s next annual outlook report projected budget shortfalls for the entire four-year forecast period, driven mainly by persistent high inflation and the weakest revenue outlook since the 2007-09 Great Recession.86
Analyzing multiple scenarios can also be a starting point for policy decisions. Rather than using a long-term budget assessment to evaluate only whether the budget will remain balanced under current policies, states can use it to determine what policies would ensure that balance. In Illinois, the Commission on Government Forecasting and Accountability (COGFA) included four spending growth scenarios in its March 2022 three-year forecast: flat spending, growth equal to the average increase over the prior five years, growth equal to the 20-year average, and a scenario tied to limiting the state’s backlog of unpaid bills. COGFA found that all the scenarios except flat spending would result in deficits by fiscal 2024.87
Estimate whether ongoing spending aligns with ongoing revenue over the long term to assess structural balance
Temporary or one-time revenue and spending can obscure a state’s fundamental fiscal situation. For example, temporary surpluses such as states have enjoyed in recent years do not equal long-term sustainability.88 To understand the budget’s underlying structural condition, long-term assessments should compare ongoing revenue and ongoing spending and remove temporary factors. Alternatively, assessments can present temporary revenue and spending separately to help explain why the short-and long-term situations may differ.
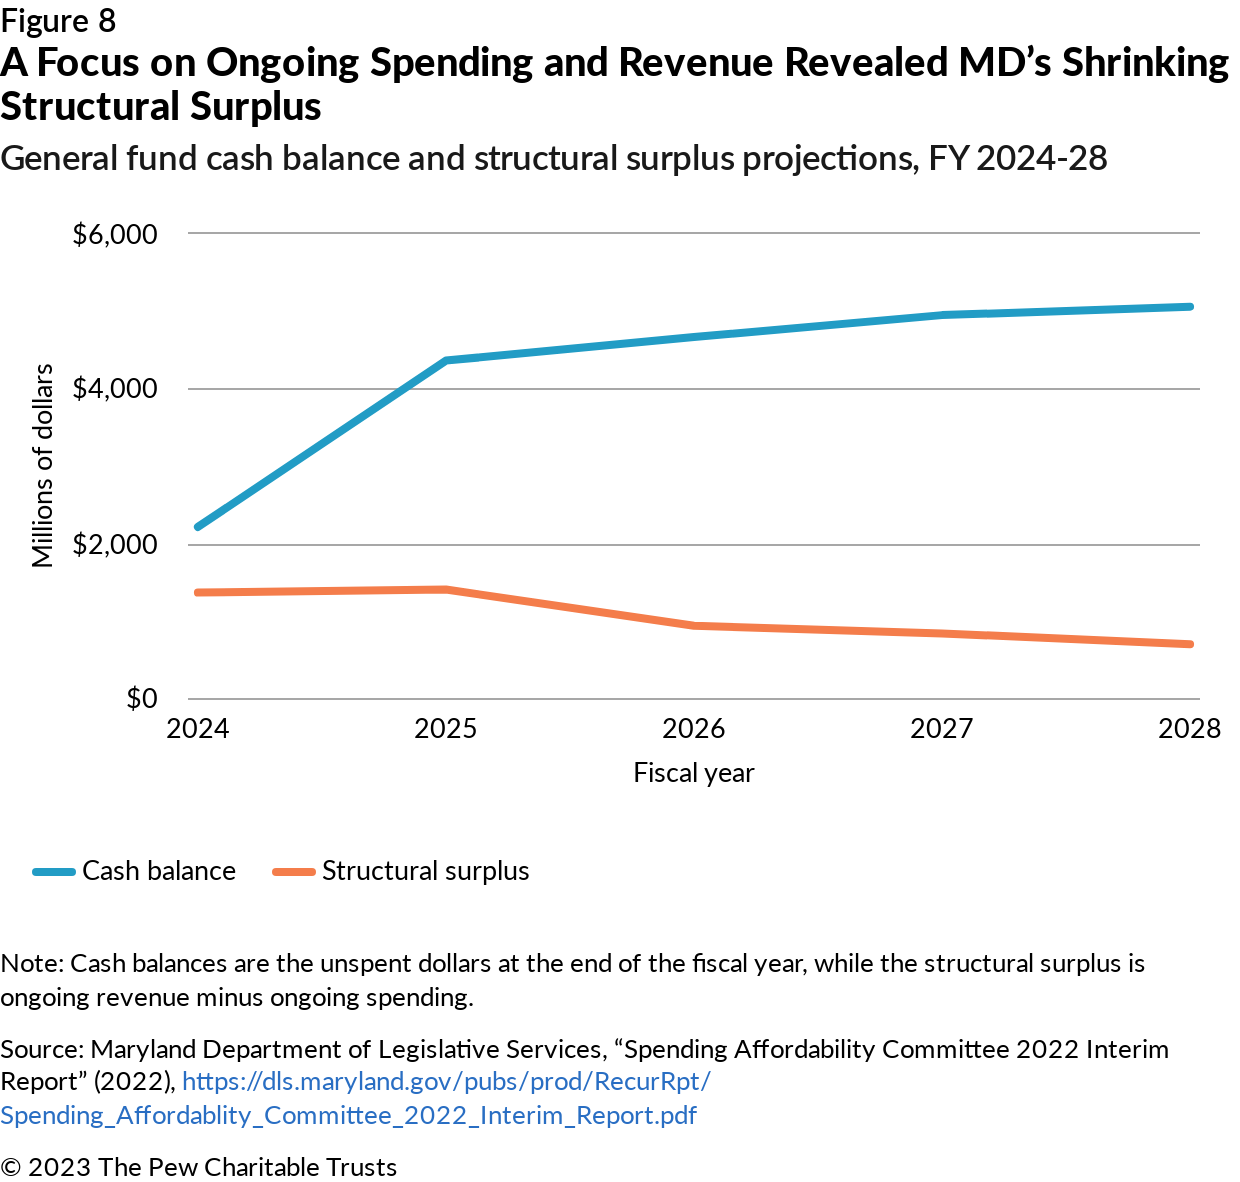
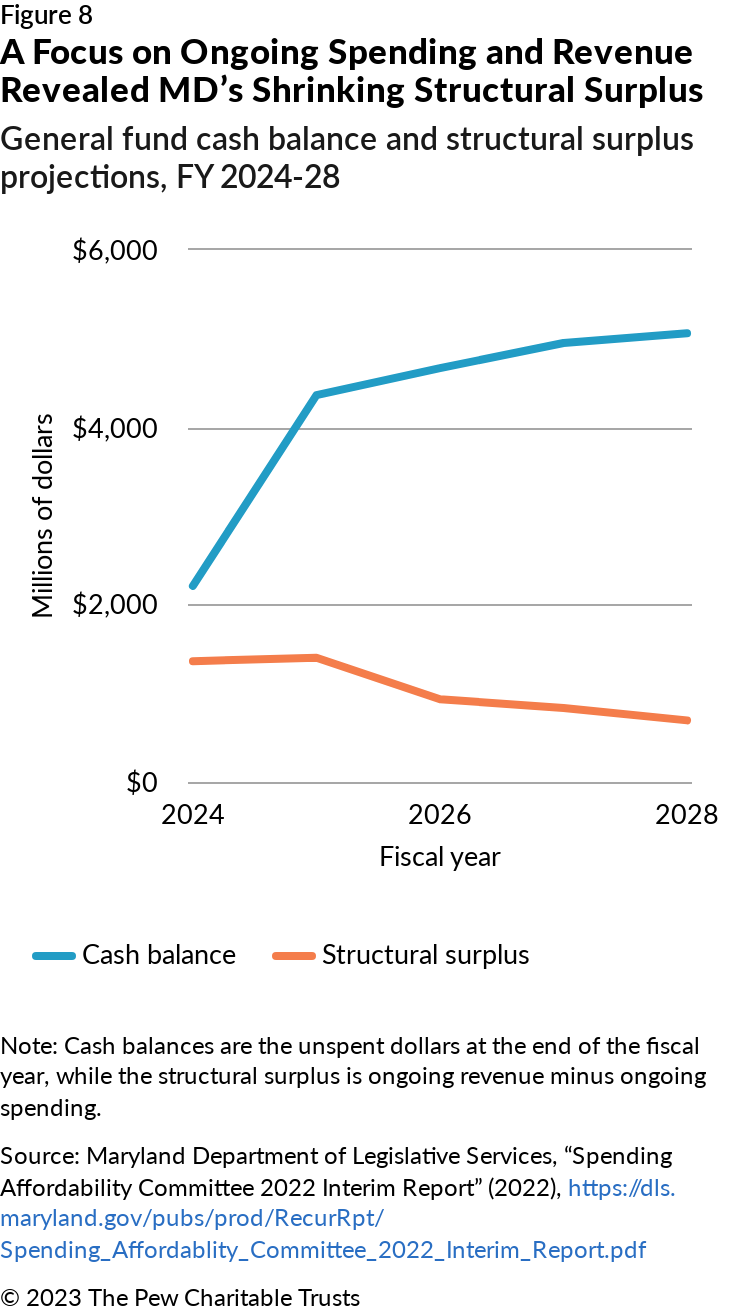
In states such as Arizona, Florida, and Maryland, recent long-term budget assessments have shown that this approach makes a big difference in the results.89 In a December 2022 analysis, for example, Maryland’s General Assembly projected that the state’s annual structural surplus would decline through fiscal 2028. This finding reflected looming budget pressures, including a recent education funding law and increased public employee pension costs.90 Importantly, had Maryland not focused on ongoing spending and revenue, it might have missed these trends because temporary factors yielded a far-rosier picture: When including money carried over from previous years, the projections showed that year-end cash balances would increase each year through fiscal 2028.91 (See Figure 8.)
To perform an analysis like Maryland’s and make it meaningful, states need processes for determining what portion of revenue and spending is ongoing and how much is temporary. Whenever possible, these distinctions should be based on neutral standards. For example, states should almost always treat spending on salaries and benefits as ongoing, except when workers are serving in explicitly temporary positions.
Long-Term Budget Assessments and Accrual Accounting
One reason states sometimes fail to anticipate structural deficits is that their budget documents are ill-suited to do so. States generally budget on a cash basis, showing the dollars that the state expects to collect and that agencies are authorized to spend during the upcoming fiscal year or biennium, but not beyond. However, another method, known as accrual accounting, that is commonly used in backward-looking financial documents offers an alternative that is better able to account for long-term costs. For that reason, states should consider using the accrual approach when developing long-term assessments.
In a cash-basis budget for example, if a state skimps on paying into its public employee pension system this year, it will have to spend more in the years ahead to make up the difference, but the budget would only reflect the savings in the first year, not the subsequent increased costs. As The Volcker Alliance, a nonprofit research organization, has noted, “[O]ne of the most frequent criticisms of annual cash-based budgeting is its lack of transparency about the impact that budget decisions have on longer-term fiscal sustainability.”92
By contrast, when using the accrual approach, governments record expenses when they are incurred and revenue when it is earned—regardless of when cash changes hands.93 Under the pension example, the accrual method would not record any savings from the skipped payment because the state’s long-term expenses are not reduced. Instead, it would show the annual cost of paying off the state’s pension obligations, including in the first year.
Given this advantage, accrual accounting seems a natural fit for long-term budget assessments. However, states generally do not use it for that purpose—at least not systematically or explicitly—because most long-term assessments rely on current-year cash-based budgets as their starting point. Some long-term budget assessments do partially reflect the principles of accrual accounting. For example, a long-term assessment that is diligent about comparing ongoing revenue to ongoing spending would omit one-time savings from skipping a pension payment when calculating spending.
Analyze factors that could lead to long-term deficits, including identifying risks beyond the time frame of the analysis
Long-term budget assessments provide the most value when they offer clear, detailed explanations of the factors driving the numbers. If an assessment shows looming deficits, the authors should explain the causes of the deficits. If it shows surpluses, they should outline the reasons for the state’s strong position—while also noting key risks that could lead to a different outcome.
For example, the edition of Colorado’s “Long-Range Financial Plan” published in 2022 described crosscutting factors that will affect revenue and spending broadly and dynamics affecting specific spending categories. These factors included demographic trends (the state’s population is growing faster than the national average, but also aging), federal policies (American Rescue Plan Act funding is ending), and the state’s Taxpayer’s Bill of Rights (a key limit on how much revenue the state can collect and how much it can spend).94 Category-specific dynamics included a discussion of how the state’s prison population—a primary driver of the Department of Corrections budget—had declined during the COVID-19 pandemic but was growing again and was expected to keep rising.95
This approach to documenting and explaining risks can be helpful even when analysts cannot fully quantify how a threat will affect revenue and spending, because it still allows them to alert policymakers to the danger. For example, Florida’s 2022 “Long-Range Financial Outlook” did not measure the effects of a hurricane on revenue and spending because analysts cannot know when a hurricane will strike or how much damage it will cause. Nonetheless, the report featured a “significant risks to the forecast” section, which noted that, contrary to a common misconception, hurricanes are harmful to Florida’s fiscal health.96 Furthermore, it described how the state indirectly backs the property insurance market, creating budget risk in the event of a major hurricane.97
Similarly, states should acknowledge and describe risks from public employee pension and deferred infrastructure maintenance costs—multi-decade obligations that are common sources of fiscal challenges. Many long-term budget assessments include these obligations in their spending projections, but only for the typical three-to-five-year time frame. However, some states provide a more complete accounting of these costs. In Illinois for instance, although COGFA provides only three years of formal projections, its 2023 analysis also pointed out that the state’s unfunded pension liability stands at $140 billion and that, according to the state’s actuary, Illinois’ statutory goal to have the pension system 90% (rather than 100%) funded by 2045 “does not conform to generally accepted actuarial principles and practices.”98
Leading practices for budget stress tests
Examine multiple scenarios and estimate the likelihood of each
No two recessions are alike, and states cannot be sure how bad the next downturn will be. To reflect the plausible range of risks, states should analyze multiple stress scenarios.
States can do that in a variety of ways. For instance, a 2018 Tennessee analysis used historical examples for its scenarios, examining how the current budget would fare if state revenue were to fall as it did during the mild 2001 dot-com bust recession and the more severe Great Recession.99 Other states use scenarios provided by national forecasters, who often outline multiple potential paths for the economy. New Mexico revenue forecasters, for example, included three scenarios from Moody’s Analytics in its December 2022 stress test: one anticipating a general economic downturn, one for faster-than-expected economic growth, and a third reflecting low oil prices.100 When selecting scenarios, analysts should consider their state’s distinct economic and revenue system vulnerabilities. So, while it makes sense for New Mexico to examine the effects of low oil prices, New York might want to model the impacts of disruption on Wall Street.101
Alternatively, rather than present discrete scenarios, some Legislative Analyst’s Office reports in California have displayed a recession’s potential revenue effects as a range. For example, in November 2021, the LAO projected fiscal 2023 revenue at over $200 billion but also found that in a recession revenue could fall to approximately $170 billion to $190 billion.102 This approach reduces the need for judgment calls about which scenarios to include while also presenting a fuller spectrum of possible outcomes.
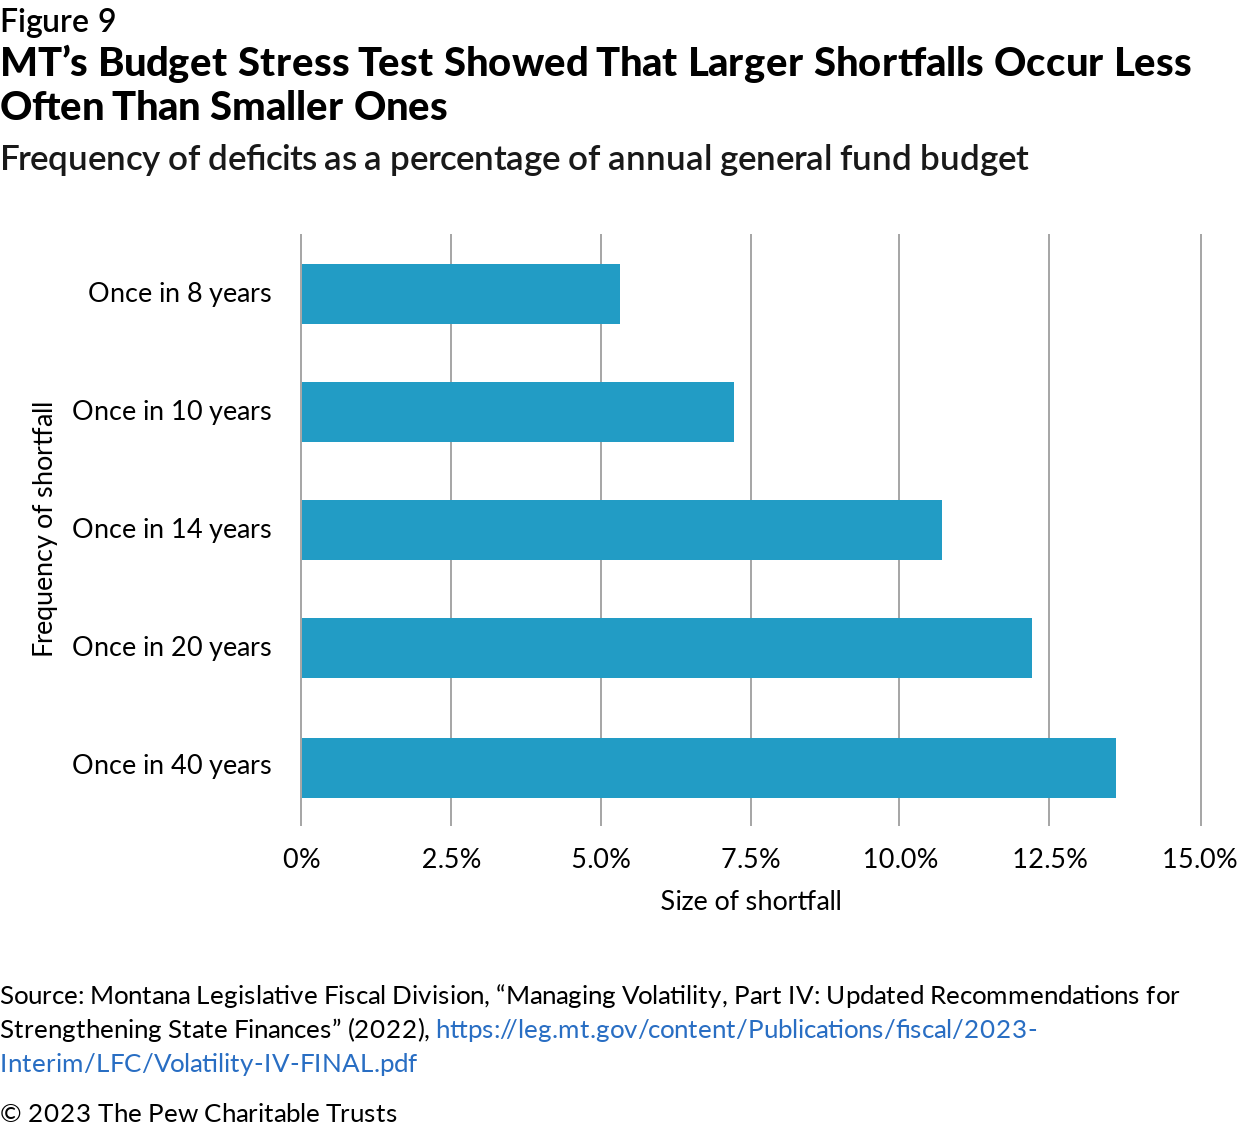
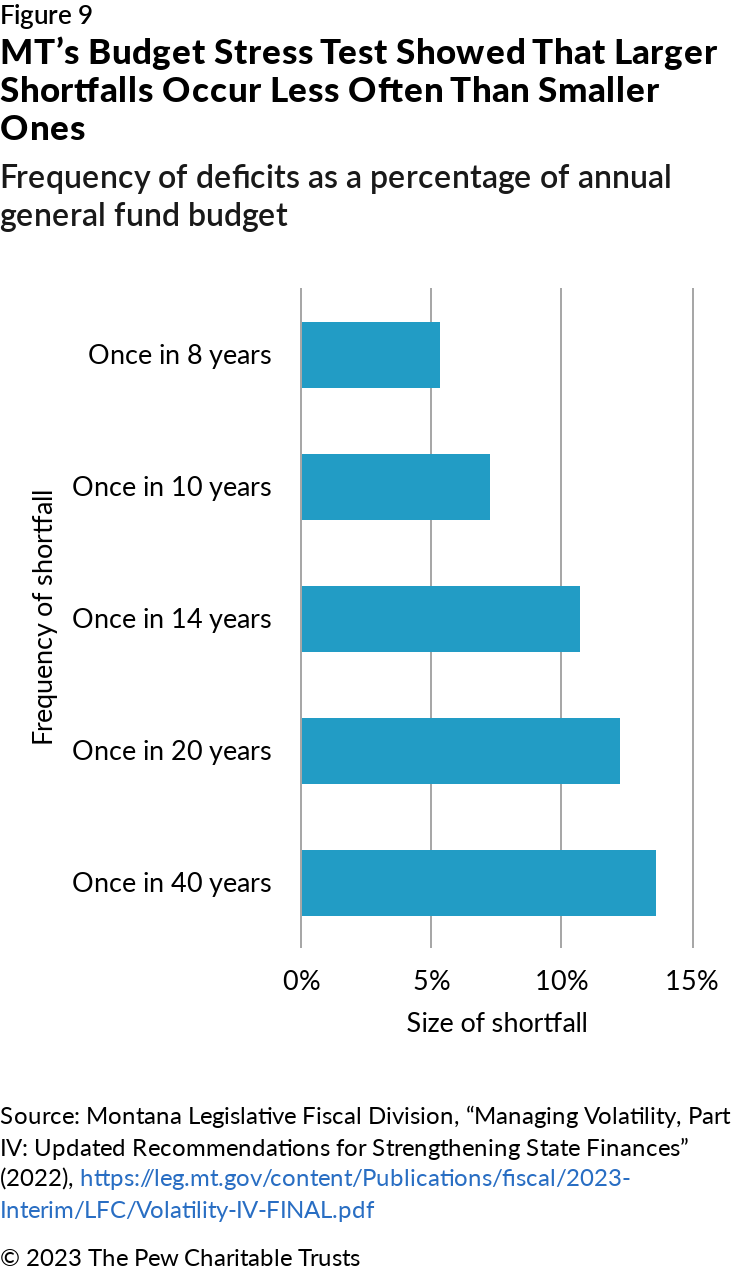
Regardless of which scenarios they use, analysts should estimate the frequency or likelihood of those scenarios. Montana’s Legislative Fiscal Division did this in its 2022 stress test by showing the size of budget shortfalls that could be expected to occur every eight, 10, 14, 20, and 40 years—with larger shortfalls occurring less frequently.103 (See Figure 9.) The value of these estimates is that they can enable policymakers to make decisions about the right amount to save or spend to account for the most likely outcomes, while also having plans in place to respond to more extreme but less probable conditions. For instance, if a shortfall will occur every eight years, policymakers might seriously consider putting enough in reserve to fully close the gap, but they may be willing to rely on less-desirable budget balancing options to close shortfalls that will occur far less frequently. In line with this idea, Montana’s analysis described budget balancing strategies the state could employ to close the gaps under each of the scenarios.104
Measure the effects of the scenarios on all major economically sensitive revenue sources and spending categories
To date, most budget stress tests have analyzed the effects of recession scenarios only on revenue, not spending. Recessions have sizable effects on major taxes, particularly state income and sales taxes. But they also can increase spending demands, in part because reduced incomes cause more people to qualify for means-tested programs such as Medicaid, and the heightened enrollment, in turn, increases spending absent action by policymakers.105
Moody’s Analytics’ 2022 50-state stress test estimated that a moderate recession would reduce state revenue by $90 billion nationwide and increase Medicaid spending by $33 billion.106 And beyond Medicaid, state higher education spending tends to increase during recessions because residents go back to school when they cannot find jobs, and government pension costs rise to compensate for reduced investment earnings related to stock market declines.107
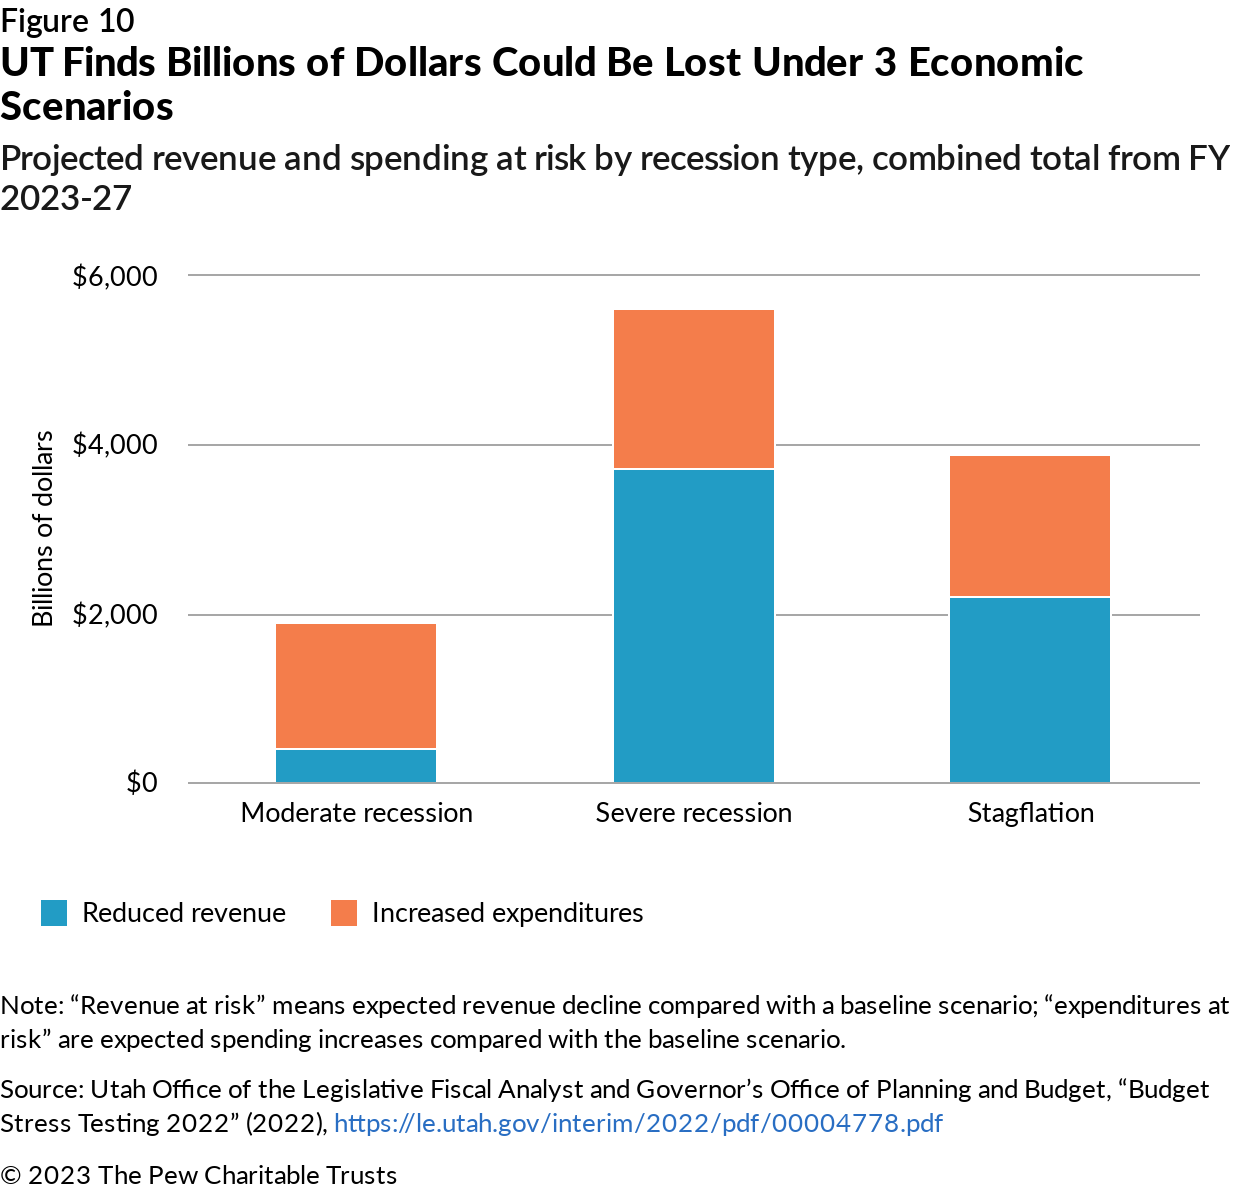
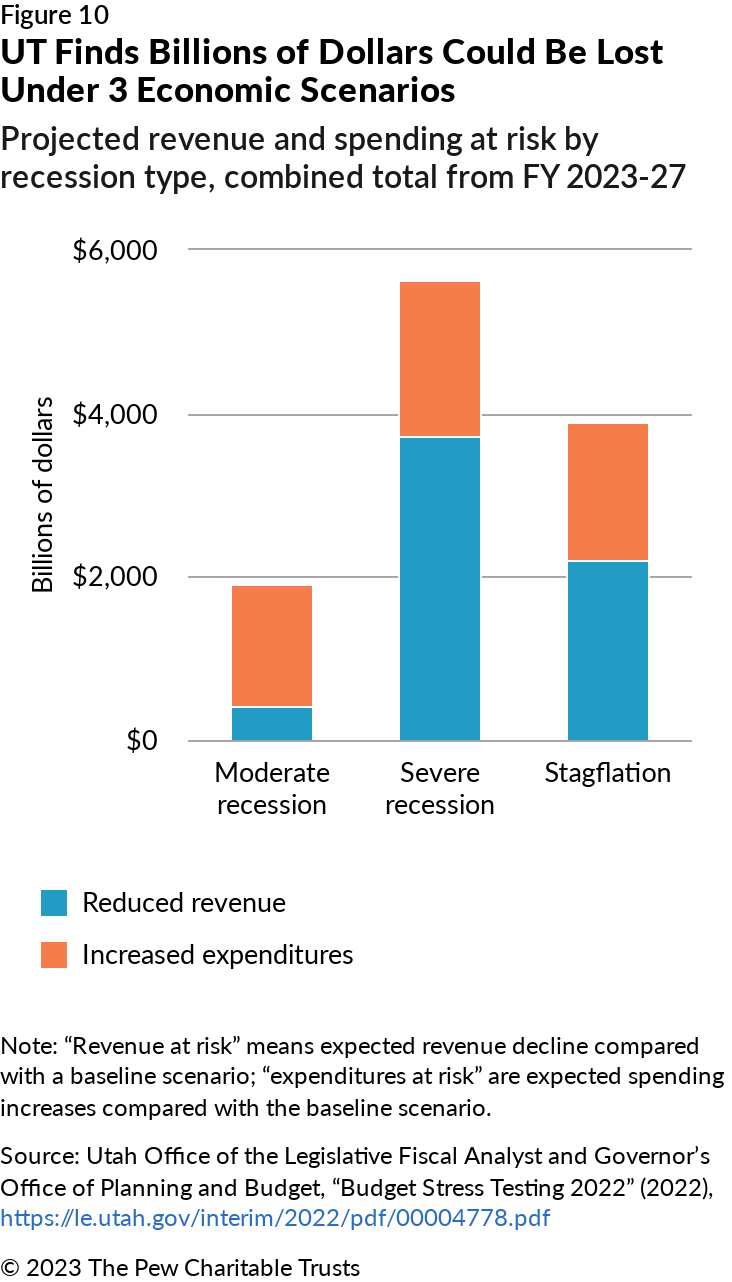
In light of these considerations, Utah undertook a comprehensive approach to stress tests. The state analyzes how recession scenarios would affect multiple economically sensitive spending categories—Medicaid, higher education, and public employee pension contributions—and combines those results with estimates of reduced revenue to calculate the “total value at risk” for each scenario.108 (See Figure 10.) That value at risk, in turn, allows the analysts to determine whether the state is prepared for the full effects of each scenario.109
Compare the effects of the scenarios to reasonable baseline expectations for revenue collections and spending
States usually start their stress tests with baseline forecasts for what would happen in the absence of an economic downturn. To calculate how much revenue would decrease in a recession, for example, states would first estimate what revenue would be if there were no recession. Analysts should clearly explain which baseline they have selected and why, because this decision can make a big difference in the results and in how policymakers should interpret them.
A basic approach is to use official revenue forecasts, which every state produces regularly as part of the budget process, as the baseline for calculating how far revenue would fall below those projections under each stress scenario. This approach often serves states well, but it does have some drawbacks. For one, if the economy is already faltering, official forecasts will reflect that stress—making them ill-suited as a baseline. As a solution, analysts can model revenue collections assuming the economy will grow and use those projections as a baseline.
Another option is to use the state’s current or projected surplus or deficit as a baseline and then examine how a stress scenario would change the results. In California, the state’s long-term budget assessment—the LAO’s “Fiscal Outlook” report—always provides surplus or deficit projections. (The stress test is also part of this report.) The 2022 report projected as a baseline a cumulative deficit of more than $60 billion through fiscal 2027, and then noted that a recession would add to that gap by causing revenue to fall $30 billion to $50 billion below expected levels.110 This approach is particularly valuable for states with structural deficits because it more fully captures the problems they will face in a recession, illuminating not only the probable revenue decline (e.g., California’s $30 billion to $50 billion), but also the total shortfall and which portions of that shortfall are the result of the stress event versus the underlying deficit. By providing this information, the deficit baseline approach enables policymakers to craft a solution that blends one-time measures with longer-term revenue and spending adjustments.
Project far enough into the future to account for the full multiyear effects of the scenarios
To fully measure the impact of recessions, stress tests need to analyze the effects over multiple future years. Since World War II, recessions have lasted 10 months on average, but economic activity generally remains diminished for months or years longer.111 Furthermore, tax collections do not generally recover as quickly as the broader economy, so the effects on state budgets may last longer still.112
Maine’s October 2022 stress test, for instance, found that both a moderate and a severe recession would cause individual income and sales tax revenue to fall below baseline forecasts for the entire five-year study period—through fiscal 2027—even though under both scenarios Maine’s economy begins to recover by the 2025 calendar year.113 Had Maine’s analysis not looked ahead five years, it would be missing some effects of a recession and the state would appear more prepared than it actually is.
In other instances, five years of analysis may not be necessary. Maine’s stress test shows such long-lasting effects because even for the moderate recession scenario it “assumes a relatively weak and slow recovery.”114 The important principle is that states should not arbitrarily decide how many years to include and should instead assess how long the effects of a recession will last by adding years to their calculations until they no longer see temporary recession impacts.
Identify a broad list of contingencies to balance the budget in the event of stress
In several states, stress tests are primarily used to answer one question: How much money do we need in our rainy day fund to be ready for fiscal stress? Rainy day funds are one of states’ best tools for solving temporary budget problems, so focusing on these accounts is a good starting point. But any way that states can quickly increase or accelerate revenue collections or cut or delay spending is a potential option for balancing the budget. And, in practice, rules that limit when and how much states can withdraw from rainy day funds sometimes mean that these savings accounts cannot be the first or only resource to address a shortfall.115 Given these considerations, states should seek to consider the full range of available budget balancing mechanisms when gauging their financial preparedness.
In Montana for example, the Legislative Fiscal Division’s 2022 stress test laid out a range of tools for closing budget shortfalls and explained the order in which they are typically used—presenting a prioritized plan that lawmakers could use to eliminate the gaps.116 The state’s first tool is not the formal rainy day fund but rather the general fund operating reserve—revenue the state simply does not appropriate in order to create a cushion. Further, the stress test explained that although the state could rely on the formal rainy day fund if the operating reserve was not sufficient, it might also turn to other accounts, including a wildfire suppression fund. Spending cuts were also part of the mix because, by law, the governor cannot make rainy day fund withdrawals without cutting spending as well.117
However, analysts may face challenges identifying spending cuts to be considered among a state’s contingencies because, theoretically, lawmakers could cut any spending unless forbidden by state or federal law. But Tennessee came up with an innovative solution to this problem. Its stress test modeled a range of spending scenarios, including some that involved significant reductions in real spending.118
Stress tests can also explain why potential budget balancing options are not available under certain circumstances or when policymakers might face challenges tapping them. Understanding these obstacles can help state leaders assess how difficult closing budget gaps might be. A 2018 analysis from Connecticut’s Office of Fiscal Analysis (OFA) warned that the state’s “capacity to rely on borrowing and spending cuts to balance the budget in the event of a recession is constrained.”119 The OFA cited as examples a collective bargaining agreement with state employees that limited the state’s ability to modify retirement benefits and that changes to Medicaid required federal approval.120
Assess whether these contingencies would offset the measured effects and, if not, present options to improve preparedness
Once states have identified budget balancing options, the next step is to determine whether those options are sufficient to close potential gaps and, if not, what to do about it. Often, the answer is straightforward. If the contingencies offer more money than the state would lose in a recession scenario—either from decreased revenue or increased spending—the analysis may conclude that the state is prepared. If not, reports often recommend bolstering the contingencies, such as by increasing rainy day fund balances.
But states also can consider alternatives to increasing savings. For example, states could adopt reforms to the tax code that would reduce the degree to which revenue falls during recessions or implement Utah’s strategy of paying for infrastructure with cash in most years to retain borrowing capacity for downturns. One advantage of Utah’s approach is that the state avoids some of the trade-offs between saving and spending, instead putting its dollars to work throughout the economic cycle rather than having them sit unused in an account potentially for years.121
Even if a state determines that strengthening reserves is the best option, policymakers may want to consider permanent changes to savings policies rather than simply setting aside more money once. For example, after Montana’s 2022 stress test identified raising the legal limits on several reserve funds as an option, lawmakers increased the cap on the state’s rainy day fund while also adopting several other approaches included in the stress test.122
To improve preparedness, stress tests could also recommend rules to automatically deposit extraordinary revenue growth in rainy day funds—although lawmakers could also retain the power to override these rules—and statutory changes to make it easier for policymakers to tap the rainy day fund or other accounts during recessions.
Conclusion
Since the Great Recession began in 2007, states have endured deep budget shortfalls, a painfully slow recovery, and then the historically sharp contraction caused by the COVID-19 pandemic. After this tumultuous period, state leaders have jumped at the opportunity to deploy budget surpluses for long-deferred priorities, enacting record spending increases and tax cuts.
But now state fiscal conditions appear to be approaching a new inflection point. With federal pandemic relief ending, state revenue collections are declining. States also are closely watching the threat of recession. And many of the long-term factors that contribute to structural deficits, such as aging populations and antiquated tax systems, remain. Unless states can manage these risks, their recent policy achievements are in danger.
Thankfully, states are not powerless in the face of these risks. Although they cannot prevent new threats from emerging, they can prepare for them by building robust reserves, for example, or by acting to close projected structural deficits before their budgets fall out of balance. To achieve these outcomes—and to keep priority investments on track—states should make long-term budget assessments and budget stress tests a standard part of their budgeting process. With these analytical tools, states can judge whether their budgets are on a sustainable path and, if not, what to do about it.
The states that already use these tools are proving that a short-term focus is not an inherent feature of government. Policymakers want their achievements to be sustained and will embrace a long-term perspective when they have reliable, policy-relevant data and analysis. Every state still has room to improve, but the ones that use long-term budget assessments and budget stress tests are demonstrating that a different model for budgeting, one grounded in evidence and long-term thinking, works. Other states should follow their lead.
Appendix A: State fact sheets
This appendix provides fact sheets describing the practices of each state that produces a long-term budget assessment, a budget stress test, or both.
| Alaska | Arizona | California | Colorado |
| Connecticut | Florida | Illinois | Maine |
| Maryland | Minnesota | Montana | Nebraska |
| New Mexico | New York | North Carolina | Pennsylvania |
| Rhode Island | Tennessee | Utah | West Virginia |
Appendix B: Methodology
This research involved four steps, which are described below:
- Defining long-term budget assessments and budget stress tests.
- Gathering state analyses.
- Identifying leading practices.
- Verifying state performance.
Defining long-term budget assessments and budget stress tests
The first step in this research was to identify the essential elements of analyses designed to measure long-term budget sustainability. “Budget stress test” is an increasingly common term of art in state government, but few, if any, authoritative sources have sought to identify a minimum definition of a budget stress test.
“Long-term budget assessment” is a term that Pew developed during this research to describe analyses with various names depending on the state. Pew’s efforts to develop a definition of long-term budget assessment benefited from previous research on long-term budget projections and long-term financial planning. The Government Finance Officers Association, for instance, offers a thoughtful set of recommendations for the components of a “long-term financial plan.”123 Pew’s definition of “long-term budget assessment” builds on this research by describing the elements of fiscal analysis that are necessary to achieve one key purpose: to analyze whether a state faces a long-term imbalance and why or why not.
To develop definitions of both analytical tools, Pew conducted interviews with experts outside of state government who have either produced or studied these types of analyses. Interviewees included academics and experts from credit rating agencies, federal agencies, and research organizations. In the interviews, several experts emphasized that in long-term fiscal analysis, numbers on their own are not enough. To improve long-term sustainability, policymakers need to understand the policy implications of the numbers. If a state faces a structural budget deficit, for example, state leaders need to understand the causes of the deficit and what can be done about it. This viewpoint shaped Pew’s definitions—leading to the conclusion that a budget stress test must say whether the state is prepared for the stress scenarios and that a “long-term projection” or “long-term budget” is of far more value if it includes an “assessment” component. Because of this standard, 15 states and D.C. that produce long-term projections did not meet the definition of a long-term budget assessment: Georgia, Hawaii, Iowa, Kansas, Louisiana, Minnesota, Nebraska, North Carolina, Oklahoma, South Carolina, South Dakota, Texas, Washington, Wisconsin, and Wyoming.
Gathering state analyses
Pew researchers started by casting a wide net for analyses that could potentially meet the definitions of long-term budget assessments or budget stress tests, including any analysis with long-term revenue or spending projections or that projected revenue collections under multiple scenarios. This effort benefited from previous research, including The Volcker Alliance’s “Truth and Integrity in State Budgeting” reports and the National Association of State Budget Officers’ “Budget Processes in the States” report, which included lists of which states produce long-term revenue and spending projections.124
For analyses that are published regularly, the researchers sought to identify the most recent edition of the analysis and generally did not review earlier versions unless there was reason to believe an earlier version included components that more recent versions lacked. Later in the research, interviews with state officials helped Pew’s researchers understand how some states’ approaches had changed over time and identify instances when earlier analyses might merit closer examination.
Pew used a mix of search engine and manual searches (i.e., a researcher clicking through pages on a website) to comb state websites for relevant analyses. The search engine searches used the following set of terms: “stress test” OR “volatility” OR “scenario” OR “forecast” OR “projection” OR “long-term budget” OR “structural balance” OR “structurally balanced” OR “structural deficit” OR “long-term revenue” OR “long-term spending” OR “multiyear budget” OR “long-term fiscal” OR “fiscal sustainability” OR “fiscal resilience.”
Using one or both of these methods, researchers searched the websites of executive budget offices, legislative fiscal offices, revenue departments, revenue forecasting organizations (such as consensus forecasting groups), auditors, comptrollers, treasurers, state legislatures (including separate House and Senate homepages if they had different web domains than the legislature’s homepage), and legislative fiscal committees (including House and Senate “revenue,” “tax,” ”ways and means,” ”budget,” and “appropriations” committees). Researchers also manually reviewed executive budget proposals and revenue forecasts in every state because these documents often include long-term fiscal analysis.
Pew conducted its web searches for analyses primarily in the summer and fall of 2022. These steps yielded more than 200 documents and analyses that merited further review. Then, each analysis was reviewed independently by at least two Pew researchers (and often more) to determine whether it met the definitions of long-term budget assessment or budget stress test. To reflect current practices, Pew researchers considered only analyses published on or after Jan. 1, 2018.
In interviews and email exchanges, state officials often mentioned unpublished analyses that they said fully or partially met the definitions. Although this report discusses some of those unpublished analyses, Pew did not seek to comprehensively inventory them. Interviews with state officials showed that unpublished analyses are generally less valuable for holistically informing policy decisions because they are rarely shared across branches of government. Furthermore, Pew had no way to verify whether unpublished analyses meet the definitions. However, to try to include as many analyses as possible, Pew set a standard that states needed to “publish the results” (not the entire analysis). For example, North Carolina publishes only a one-page summary of its stress test findings, but the summary is sufficient to show that the state is meeting the definition.125 States publish results in a variety of ways: as stand-alone reports; as sections of other reports, such as executive budget proposals; and in more informal documents such as presentation slides.
Identifying leading practices
This report presents six leading practices each for long-term budget assessments and budget stress tests. These practices are not intended to provide a comprehensive guide for how to produce high-quality, long-term budget assessments and budget stress tests. Instead, they reflect key ideas that emerged from Pew’s research.
Pew’s interviews with experts and the review of the research literature served as the starting point for identifying leading practices. Then, to decide which practices should make the final lists and how they should be phrased or framed, the researchers drew insights from reading states’ long-term budget assessments and budget stress tests. Specifically, researchers:
- Reviewed how the analyses explained and justified their methodological decisions to judge whether they made a persuasive case for following certain practices.
- Compared analyses to one another, noting differences in thoroughness and rigor.
- Considered the findings and recommendations, looking for connections between the authors’ analytical approach and their ability to draw clear, well-supported policy conclusions.
Verifying state performance
Researchers contacted state officials to confirm that Pew had gathered all long-term budget assessments, long-term projections, and budget stress tests and to learn more about the purpose of the analyses, each state’s analytic approach, and how policymakers use the findings. In each state, Pew contacted at least one official each from the executive and legislative branches. Typical contacts were officials in the legislative fiscal office or executive budget office with authority over forecasting. For a few states in which neither the legislative nor the executive branch official responded, Pew contacted state-based research organizations. Pew used a mix of research interviews and email exchanges to verify information.
Pew began contacting state officials in January 2023. As a result, although Pew did not set a specific end date for analyses to be included in this report, the research may not reflect all state analyses published in 2023.
Endnotes
- National Association of State Budget Officers, “The Fiscal Survey of States: Fall 2022” (2022), 1-3, 58-60, https://higherlogicdownload.s3.amazonaws.com/NASBO/9d2d2db1-c943-4f1b-b750-0fca152d64c2/UploadedImages/Fiscal%20Survey/NASBO_Fall_2022_Fiscal_Survey_of_States_S.pdf.
- J. Codega and R. Gardiner (budget officer; chief of operations, Rhode Island Office of Management and Budget), interview with The Pew Charitable Trusts, Jan. 26, 2023; Maryland Department of Legislative Services, “Spending Affordability Committee 2022 Interim Report” (2022), 4, 33, https://dls.maryland.gov/pubs/prod/RecurRpt/Spending_Affordablity_Committee_2022_Interim_Report.pdf; Montana Legislative Fiscal Division, “Managing Volatility, Part IV: Updated Recommendations for Strengthening State Finances” (2022), https://leg.mt.gov/content/Publications/fiscal/2023-Interim/LFC/Volatility-IV-FINAL.pdf.
- New Mexico Legislative Finance Committee, “Mid-to Long-Term Revenue Options” (2022), 5, 8-10, https://www.nmlegis.gov/handouts/ALFC%20072022%20Item%207%20Mid-%20to%20Long-Term%20Revenue%20Options.pdf; D. Abbey, former director, New Mexico Legislative Finance Committee, email to Josh Goodman, The Pew Charitable Trusts, April 6, 2023.
- J. Tennert et al., “State Budget Stress Testing: How Utah Budget-Makers Are Shifting the Focus From a Balanced Budget to Fiscal Sustainability” (Kem C. Gardner Policy Institute, 2019), 14-15, https://gardner.utah.edu/wp-content/uploads/PEW-State-Budget-Stress-Testing.pdf; The Pew Charitable Trusts, “How States Can Manage Midyear Budget Gaps” (2022), 9, https://www.pewtrusts.org/-/media/assets/2022/03/midyearbudgetgaps_updated.pdf.
- National Conference of State Legislatures, “NCSL Fiscal Brief: State Balanced Budget Provisions” (2010), https://docs.house.gov/meetings/JU/JU00/20170727/106327/HHRG-115-JU00-20170727-SD002.pdf.
- M. Davey, “In Michigan, Deficits Defy Years of Cutting,” The New York Times, July 11, 2009, https://www.nytimes.com/2009/07/12/us/12michigan.html.
- Alaska Legislative Finance Division, “The Fiscal Year 2024 Budget: Legislative Fiscal Analyst’s Overview of the Governor’s Request” (2023), https://www.legfin.akleg.gov/Overview/Overview2024.pdf.
- L. Rogers and K. Wilder, “Shift in Working-Age Population Relative to Older and Younger Americans,” U.S. Census Bureau, June 25, 2020, https://www.census.gov/library/stories/2020/06/working-age-population-not-keeping-pace-with-growth-in-older-americans.html; The Pew Charitable Trusts, “The Long-Term Decline in Fertility—and What It Means for State Budgets” (2022), https://www.pewtrusts.org/en/research-and-analysis/issue-briefs/2022/12/the-long-term-decline-in-fertility-and-what-it-means-for-state-budgets; D. Boyd, “Demographics, Aging, and State Taxes” (State and Local Government Finance Project, Rockefeller College, SUNY Albany, 2019), https://www.pewtrusts.org/-/media/assets/2020/01/demographics_aging_and_state_taxes.pdf.
- The Volcker Alliance, “Truth and Integrity in State Budgeting: What Is the Reality?” (2017), 14-15, https://www.volckeralliance.org/sites/default/files/TruthAndIntegrityInStateBudgetingWhatIsTheReality.pdf; J. Goodman, “Budget Gimmicks Explained: Five Ways States Hide Deficits,” Stateline, June 23, 2011, https://stateline.org/2011/06/23/budget-gimmicks-explained-five-ways-states-hide-deficits.
- The Volcker Alliance, “Truth and Integrity in State Budgeting: Preventing the Next Fiscal Crisis” (2018), 2, https://www.volckeralliance.org/sites/default/files/Truth%20and%20Integrity%20in%20State%20Budgeting%20-%20Preventing%20the%20Next%20Fiscal%20Crisis_0.pdf.
- The Pew Charitable Trusts, “Fiscal 50: State Trends and Analysis, Fiscal Balance,” accessed Sept. 19, 2023, https://www.pewtrusts.org/en/research-and-analysis/data-visualizations/2014/fiscal-50#ind9; Illinois Office of the Auditor General, “Performance Audit of the Vendor Payment Program” (2021), 98-101, https://www.auditor.illinois.gov/Audit-Reports/Performance-Special-Multi/Performance-Audits/2021_Releases/21-Vendor-Payment-Program-Perf-Full.pdf.
- Illinois Office of the Auditor General, “Performance Audit of the Vendor Payment Program,” 1-4.
- Illinois Commission on Government Forecasting and Accountability, “Three-Year Budget Forecast FY 2023-FY 2025” (2022), 6-7, https://cgfa.ilga.gov/Upload/3YearBudgetForecastFY2023-2025.pdf.
- Kentucky Chamber of Commerce, “The Leaky Bucket: 10 Years Later” (2020), 9-12, https://www.kychamber.com/sites/default/files/pdfs/Leaky%20Bucket%2010%20Years%20Later%202020.pdf; A. Ross, “Kentucky’s Universities Brace for ‘Bigger Cuts Than They’ve Ever Seen,’” Courier Journal, Dec. 21, 2017, https://www.courier-journal.com/story/news/education/2017/12/21/kentuckys-universitiesbrace-bigger-cuts/892176001; M. Watkins, “Kentucky’s 1 of Only 5 States to Cut Money for Higher Education This Year,” Courier Journal, Feb. 11, 2019, https://www.courier-journal.com/story/news/politics/2019/02/11/kentucky-colleges-university-louisville-uk-face-budgetcuts/2704766002.
- J. Goodman and M. Robyn, “When Will the Impact of Coronavirus Hit State Budgets?” (The Pew Charitable Trusts, April 2, 2020), https://www.pewtrusts.org/en/research-and-analysis/articles/2020/04/02/when-will-the-impact-of-coronavirus-hit-state-budgets.
- Congressional Research Service, “Impact of the Recession on Medicaid” (2020), https://crsreports.congress.gov/product/pdf/IF/IF11686.
- The Pew Charitable Trusts, “Managing Uncertainty” (2014), 3-4, https://www.pewtrusts.org/en/research-and-analysis/reports/2014/02/04/managing-uncertainty.
- C.K. Jackson, C. Wigger, and H. Xiong, “Do School Spending Cuts Matter? Evidence From the Great Recession” (2018), 1, https://www.nber.org/system/files/working_papers/w24203/w24203.pdf.
- Ibid., 2-4.
- The Pew Charitable Trusts, “‘Lost Decade’ Casts a Post-Recession Shadow on State Finances” (2019), https://www.pewtrusts.org/en/research-and-analysis/issue-briefs/2019/06/lost-decade-casts-a-post-recession-shadow-on-state-finances.
- M. Taylor, “The Great Recession and California’s Recovery” (California Legislative Analyst’s Office, 2018), 3-5, https://lao.ca.gov/reports/2018/3910/recession-recovery-121318.pdf.
- J. Myers, “Column: Political Road Map: Gov. Jerry Brown’s Wall of Debt Has Crumbled, but There Are More Walls Behind It,” Los Angeles Times, July 2, 2017, https://www.latimes.com/politics/la-pol-ca-road-map-jerry-brown-budget-wall-of-debt-20170702-story.html.
- Florida Senate Committee on Appropriations, House Appropriations Committee, and Legislative Office of Economic and Demographic Research, “Long-Range Financial Outlook, Fiscal Years 2023-24 Through 2025-26” (2022), http://edr.state.fl.us/Content/long-range-financial-outlook/3-Year-Plan_Fall-2022_2024-2226.pdf; Illinois Commission on Government Forecasting and Accountability, “Three-Year Budget Forecast FY 2024-FY 2026” (2023), https://cgfa.ilga.gov/Upload/3YearBudgetForecastFY2024-FY2026.pdf; Rhode Island Office of Management and Budget, “Fiscal Year 2024 Budget Proposal Executive Summary,” Appendix B, https://omb.ri.gov/sites/g/files/xkgbur751/files/2023-01/Executive%20Summary_0.pdf.
- E. Mandel, H. Curtin, and B. Ryan, “Stress-Testing States: Looking Toward the Next Recession” (Moody’s Analytics, 2022), 6, https://www.economy.com/getlocal?q=a7a91c91-cad1-447d-a03f-cd48c8cdaa21&app=eccafile.
- B. Rosewicz, J. Theal, and A. Fall, “Pandemic Drives Historic State Tax Revenue Drop,” The Pew Charitable Trusts, Feb. 17, 2021, https://www.pewtrusts.org/en/research-and-analysis/articles/2021/02/17/pandemic-drives-historic-state-tax-revenue-drop; D.A. Lieb, “States Tapping Historic Surpluses for Tax Cuts and Rebates,” Associated Press, Aug. 31, 2022, https://apnews.com/article/inflation-covid-healthpersonal-taxes-legislature-5062f53df342140f945f98e99dc923d6.
- Rhode Island Office of Management and Budget, “FY 2024 Budget Overview” (2023), 3, https://omb.ri.gov/sites/g/files/xkgbur751/files/2023-01/FY%202024%20Budget%20Media%20Presentation.pdf.
- Rhode Island Office of Management and Budget, “Fiscal Year 2024 Budget Proposal Executive Summary,” B-1.
- P. Anderson and K. Gregg, “RI Budget, Topping $14B for First Time, Wins Initial Approval. Here’s What’s in It—and Not,” Providence Journal, updated June 3, 2023, https://www.providencejournal.com/story/news/politics/state/2023/06/02/the-ri-budget-for-next-yearheads-to-senate-finance-committee-tonight/70281561007; Rhode Island Office of the Governor, “Governor McKee Signs FY24 RI Ready Budget, Positions Rhode Island to Maintain Economic Momentum,” https://governor.ri.gov/press-releases/governor-mckee-signs-fy24-ri-ready-budget-positions-rhode-island-maintain-economic.
- National Association of State Budget Officers, “The Fiscal Survey of States,” 1-3, 58-60.
- J. Theal and A. Fall, “Record State Budget Reserves Buffer Against Mounting Fiscal Threats,” The Pew Charitable Trusts, updated March 22, 2023, https://www.pewtrusts.org/en/research-and-analysis/articles/2023/03/16/record-state-budget-reserves-buffer-against-mounting-fiscal-threats; J. Brainerd, “States Pursue Tax Relief in 2022,” National Conference of State Legislatures, updated June 28, 2022, https://www.ncsl.org/fiscal/states-pursue-tax-relief-in-2022; National Association of State Budget Officers, “The Fiscal Survey of States,” vii.
- New Mexico Legislative Finance Committee, “Mid-to Long-Term Revenue Options.”
- Ibid.
- Abbey, email.
- D. Abbey (former director, New Mexico Legislative Finance Committee), interview with The Pew Charitable Trusts, Feb. 27, 2023.
- S.M. Bryan, “New Mexico Enjoys Revenue Windfall, as Economists Warn of Uncertain Future,” Associated Press, June 8, 2023, https://apnews.com/article/new-mexico-spending-budget-oil-gas-revenues-7ae56a7bbe443401157b6e4f1b41ae1b; New Mexico Legislative Finance Committee, “LFC 2023 Staff Interim Work Plans” (2023), 52, https://www.nmlegis.gov/Entity/LFC/Documents/2023%20All%20Work%20Plans.pdf.
- C. Groh, “Alaska’s Fiscal Crisis—and a Proposed Solution,” Anchorage Daily News, updated July 3, 2021, https://www.adn.com/opinions/2021/07/03/alaskas-fiscal-crisis-and-a-proposed-solution; Alaska House Coalition, “Legislature Announces Fiscal Policy Working Group,” https://akhouse.org/2021/07/06/legislature-announces-fiscal-policy-working-group.
- Alaska Fiscal Policy Working Group, “Final Report” (2021), https://akleg.gov/docs/pdf/2021_Fiscal_Policy_Working_Group-Final_Report.pdf.
- Ibid.
- A. Painter (director, Alaska Legislative Finance Division), interview with The Pew Charitable Trusts, Dec. 16, 2021.
- J. Kreiss-Tomkins (former member, Alaska House of Representatives), interview with The Pew Charitable Trusts, May 10, 2023.
- Alaska Fiscal Policy Working Group, “Final Report.”
- J. Brooks, “Fix the Permanent Fund Dividend? There’s No Shortage of Ideas in the Alaska Legislature,” Alaska Beacon, March 20, 2023, https://alaskabeacon.com/2023/03/20/fix-the-permanent-fund-dividend-theres-no-shortage-of-ideas-in-the-alaska-legislature; Kreiss-Tomkins, interview.
- Tennert et al., “State Budget Stress Testing,” 1.
- Ibid.; The Pew Charitable Trusts, “Why States Save: Using Evidence to Inform How Large Rainy Day Funds Should Grow” (2015), https://www.pewtrusts.org/~/media/assets/2015/12/whystatessavereport.pdf.
- National Association of State Budget Officers, “State Budgeting and Lessons Learned From the Economic Downturn” (2013), 2, https://higherlogicdownload.s3.amazonaws.com/NASBO/9d2d2db1-c943-4f1b-b750-0fca152d64c2/UploadedImages/Reports/State%20Budgeting%20and%20Lessons%20Learned%20from%20the%20Economic%20Downturn-final.pdf.
- N. Cartrette, “State Passes Budget With Largest Cuts in History: Sales Tax Increase, Income Tax Surcharge Included,” The News Reporter, Aug. 7, 2009, https://advance.lexis.com/api/permalink/aed21355-5858-4969-a935-07aa4b6f6202/?context=1519360.
- North Carolina Gen. Stat. § 143C-4-2, https://www.ncleg.net/EnactedLegislation/Statutes/HTML/BySection/Chapter_143C/GS_143C-4-2.html.
- C. Jarvis, “NC Leaders Announce How Much They’ll Spend on Hurricane Florence Recovery,” The News & Observer, Oct. 13, 2018, https://www.newsobserver.com/news/politics-government/article220000650.html; The Pew Charitable Trusts, “Fiscal 50: State Trends and Analysis, Reserves and Balances,” accessed Sept. 19, 2023, https://www.pewtrusts.org/en/research-and-analysis/data-visualizations/2014/fiscal-50#ind5.
- E. McLenaghan (assistant state budget officer, demographic and economic analysis, North Carolina Office of State Budget and Management), interview with The Pew Charitable Trusts, Jan. 20, 2023.
- PFM Group Consulting LLC, “Recession Readiness in the Public Sector: Budget Stress Testing and Action Plans for Fiscal Sustainability” (2019), https://www.pfm.com/docs/default-source/default-document-library/perspectives---recession-readiness-in-the-public-sector---june-2019.pdf?sfvrsn=c27b83b7_0; Fitch Ratings, “Fitch Analytical Stress Test,” accessed Sept. 19, 2023, https://www.fitchratings.com/us-public-finance/fitch-analytical-stress-test.
- Mandel, Curtin, and Ryan, “Stress-Testing States.”
- Ibid.
- D. White and E. Mandel (former senior director of economic research; associate director-senior economist, Moody’s Analytics), interview with The Pew Charitable Trusts, Aug. 31, 2022.
- The Pew Charitable Trusts, “Fiscal 50: State Trends and Analysis, Reserves and Balances.”
- Montana Legislative Fiscal Division, “Managing Volatility, Part IV,” 10.
- L. Jones (member, Montana House of Representatives), interview with The Pew Charitable Trusts, May 19, 2023.
- Montana H.B. 424, 68th regular session of the Montana Legislature (2023), https://leg.mt.gov/bills/2023/sesslaws/ch0722.pdf.
- Tennert et al., “State Budget Stress Testing,” 14-16.
- D. Evans (senior managing director of budget and operations, Utah Governor’s Office of Planning and Budget), interview with The Pew Charitable Trusts, Jan. 23, 2023.
- Utah Office of the Legislative Fiscal Analyst and Governor’s Office of Planning and Budget, “Budget Stress Testing 2022” (2022), 7, https://le.utah.gov/interim/2022/pdf/00004778.pdf.
- K. Fulford (deputy director, Alabama Legislative Services Agency, Fiscal Division), interview with The Pew Charitable Trusts, Sept. 8, 2023; H.4040, 193rd General Court of the Commonwealth of Massachusetts (2023), https://malegislature.gov/Bills/193/H4040/RollCall; S. Coffman, fiscal analyst, Nevada Legislature, email to Josh Goodman, The Pew Charitable Trusts, Aug. 22, 2023; Oklahoma Legislative Office of Fiscal Transparency, “2022-2023 Work Plan—Program Evaluation Projects” (2022), https://dy8iim215g2zo.cloudfront.net/FY_23_Approved_Work_Plan_edd9add8ce.pdf?updated_at=2022-09-02T16:09:10.568Z.
- Maine Rev. Stat. Tit. 5, § 1710-G, https://legislature.maine.gov/statutes/5/title5sec1710-G.html.
- California State Treasurer, “California’s Current Credit Ratings,” accessed Sept. 19, 2023, https://www.treasurer.ca.gov/ratings/current.asp.
- Oregon Office of Economic Analysis, “Oregon Economic and Revenue Forecast: March 2023, Volume XLIII, No. 1” (2023), 11-12, 24, https://www.oregon.gov/das/OEA/Documents/forecast0323.pdf; Washington Economic and Revenue Forecast Council, “Washington State Economic and Revenue Forecast: November 2022, Volume XLVII, No. 4” (2022), 56, https://erfc.wa.gov/sites/default/files/public/documents/publications/nov22pub.pdf.
- Washington Rev. Code Ann. § 43.88.055, https://app.leg.wa.gov/RCW/default.aspx?cite=43.88.055; D. Johnson and J. Terwilliger (state economist; commissioner, South Dakota Bureau of Finance and Management), interview with The Pew Charitable Trusts, April 11, 2023.
- California Legislative Analyst’s Office, “The 2022-23 Budget: California’s Fiscal Outlook” (2021), https://www.lao.ca.gov/reports/2021/4472/fiscal-outlook-111721.pdf.
- D.W. Williams and T.D. Calabrese, “The Status of Budget Forecasting,” Journal of Public and Nonprofit Affairs 2, no. 2 (2016): 127-60, http://doi.org/10.20899/jpna.2.2.127-160.
- D. White (former senior director of economic research, Moody’s Analytics), interview with The Pew Charitable Trusts, Aug. 31, 2022.
- Utah Office of the Legislative Fiscal Analyst and Governor’s Office of Planning and Budget, “Budget Stress Testing 2022,” 3-7.
- National Association of State Budget Officers, “2022 State Expenditure Report: Fiscal Years 2020-2022” (2022), 8, https://higherlogicdownload.s3.amazonaws.com/NASBO/9d2d2db1-c943-4f1b-b750-0fca152d64c2/UploadedImages/SER%20Archive/2022_State_Expenditure_Report_-_S.pdf.
- Connecticut Office of Fiscal Analysis, “Fiscal Accountability Report: FY 23-FY 26” (2022), 18-20, https://www.cga.ct.gov/ofa/Documents/year/FF/2023FF-20221118_Fiscal%20Accountability%20Report%20FY%2023%20-%20FY%2026.pdf.
- Connecticut Office of Policy and Management, “Fiscal Accountability Report: Fiscal Years 2023-2026” (2022), 20, https://portal.ct.gov/-/media/OPM/Budget/FiscalAccountability/OPM-2022-Fiscal-Accountability-Report.pdf.
- D. Williams (professor of public affairs, Marxe School of Public and International Affairs, Baruch College), interview with The Pew Charitable Trusts, July 21, 2022; E. Kim (senior director, head of U.S. state ratings, Fitch Ratings), interview with The Pew Charitable Trusts, July 28, 2022.
- Pew Center on the States and Nelson A. Rockefeller Institute of Government, “States’ Revenue Estimating: Cracks in the Crystal Ball” (2011), 7-10, https://www.pewtrusts.org/~/media/assets/2011/03/01/003_11_ri-states-revenue-estimates-report_v1040711.pdf.
- D. Hitchcock (former senior director, S&P Global Ratings), interview with The Pew Charitable Trusts, Aug. 25, 2022.
- S. Kavanagh (senior manager of research, Government Finance Officers Association), interview with The Pew Charitable Trusts, Aug 26, 2022.
- Brainerd, “States Pursue Tax Relief in 2022.”
- Arizona Rev. Stat. § 35-125, https://www.azleg.gov/ars/35/00125.htm; Florida Const. Art. III, § 19(C)(1), http://www.leg.state.fl.us/Statutes/index.cfm?Mode=Constitution&Submenu=3&Tab=statutes#A3S19; Pennsylvania Administrative Code of 1929, Sec. 604-B (a)(2), https://www.legis.state.pa.us/cfdocs/legis/LI/uconsCheck.cfm?txtType=HTM&yr=1929&sessInd=0&smthLwInd=0&act=175&chpt=6B&sctn=4&subsctn=0.
- E. McNichol and D. Grundman, “The Current Services Baseline: A Tool for Understanding Budget Choices” (Center on Budget and Policy Priorities, 2011), https://www.cbpp.org/sites/default/files/atoms/files/10-21-11sfp.pdf.
- Pennsylvania Independent Fiscal Office, “Pennsylvania Economic & Budget Outlook: Fiscal Years 2022-23 to 2027-28” (2022), 29, http://www.ifo.state.pa.us/download.cfm?file=Resources/Documents/Five_Year_Outlook_2022.pdf.
- Ibid., 30, 41.
- Ibid., 30.
- Montana Legislative Fiscal Division, “2025 Biennium Outlook Report” (2022), 5-6, https://leg.mt.gov/content/publications/fiscal/2023-Interim/June-2022/Outlook-Report.pdf.
- California Legislative Analyst’s Office, “The 2022-23 Budget: California’s Fiscal Outlook,” 10-11.
- Ibid., 11-12.
- California Legislative Analyst’s Office, “The 2023-24 Budget: California’s Fiscal Outlook” (2022), 3-7, https://www.lao.ca.gov/reports/2022/4646/CA-Fiscal-Outlook-111622.pdf.
- Illinois Commission on Government Forecasting and Accountability, “Three-Year Budget Forecast FY 2023-FY2025,” 13-16.
- J. Chapman, C. Foard, and C. Hall, “How Today’s Surpluses Can Help States Invest in Budget Stability,” The Pew Charitable Trusts, April 13, 2023, https://www.pewtrusts.org/en/research-and-analysis/articles/2023/04/13/how-todays-surpluses-can-help-states-invest-in-budget-stability.
- Arizona Joint Legislative Budget Committee, “JLBC Staff—October Budget Update” (2022), 7, https://www.azjlbc.gov/budget/100622revenueandbudgetupdate.pdf; Florida Senate Committee on Appropriations, House Appropriations Committee, and Legislative Office of Economic and Demographic Research, “Long-Range Financial Outlook,” 44-45; Maryland Department of Legislative Services, “Spending Affordability Committee 2022 Interim Report,” 4.
- Maryland Department of Legislative Services, “Spending Affordability Committee 2022 Interim Report,” 4.
- Ibid.
- M. Fabian and L. Washburn, “Sustainable State and Local Budgeting and Borrowing” (The Volcker Alliance, 2023), 8, https://www.volckeralliance.org/sites/default/files/2023-01/Volcker_Sustainable_State_Local.pdf.
- Ibid., 8-9.
- Colorado Office of State Planning and Budgeting, “FY 2023-24 Long-Range Financial Plan Executive Summary” (2022), 3, 11, https://drive.google.com/drive/folders/1KfQOAGZZakShyYavVQh9znx0c_ha3Syy.
- Ibid., 9.
- Florida Senate Committee on Appropriations, House Appropriations Committee, and Legislative Office of Economic and Demographic Research, “Long-Range Financial Outlook,” 41.
- Ibid., 41-42.
- Illinois Commission on Government Forecasting and Accountability, “Three-Year Budget Forecast FY 2024-FY 2026,” 8.
- Boyd Center for Business and Economic Research, “An Economic Report to the Governor of the State of Tennessee, January 2019” (2019), 31, https://haslam.utk.edu/wp-content/uploads/2019/06/20190101.pdf.
- New Mexico Legislative Finance Committee, “General Fund Consensus Revenue Estimate: December 2022” (2022), https://www.nmlegis.gov/Entity/LFC/Documents/Revenue_Reports/General_Fund_Revenue_Forecast/2022/Consensus%20Revenue%20Estimate%20-%20December%202022.pdf.
- White, interview.
- California Legislative Analyst’s Office, “The 2022-23 Budget: California’s Fiscal Outlook,” 11.
- Montana Legislative Fiscal Division, “Managing Volatility, Part IV,” 6-7.
- Ibid., 7-10.
- Congressional Research Service, “Impact of the Recession on Medicaid.”
- Mandel, Curtin, and Ryan, “Stress-Testing States,” 7.
- R. Chapoco, “Recession Rocks State and Local Pensions, ‘Funding Gap’ Possible,” Bloomberg Tax, June 25, 2020, https://news.bloombergtax.com/daily-tax-report/recession-rocks-state-and-local-pensions-funding-gap-possible; J. Barshay, “How the Last Recession Affected Higher Education. Will History Repeat?” The Hechinger Report, April 6, 2020, https://hechingerreport.org/how-the-2008-great-recession-affected-higher-education-will-history-repeat.
- Utah Office of the Legislative Fiscal Analyst and Governor’s Office of Planning and Budget, “Budget Stress Testing 2022,” 3-6.
- Ibid., 6-7.
- California Legislative Analyst’s Office, “The 2023-24 Budget: California’s Fiscal Outlook,” 6-12.
- National Bureau of Economic Research, “US Business Cycle Expansions and Contractions,” accessed Sept. 19, 2023, https://www.nber.org/research/data/us-business-cycle-expansions-and-contractions; National Bureau of Economic Research, “Business Cycle Dating Procedure: Frequently Asked Questions,” accessed Sept. 19, 2023, https://www.nber.org/research/business-cycle-dating/business-cycle-dating-procedure-frequently-asked-questions.
- Goodman and Robyn, “When Will the Impact of Coronavirus Hit State Budgets?”
- Maine Consensus Economic Forecasting Commission and Revenue Forecasting Committee, “Stress-Testing Maine General Fund Revenues & Reserves FY2023-FY2027” (2022), 17-19, 21-26, https://legislature.maine.gov/doc/9043.
- Ibid., 3.
- The Pew Charitable Trusts, “When to Use State Rainy Day Funds” (2017), 6-14, https://www.pewtrusts.org/-/media/assets/2017/04/when-to-use-state-rainy-day-funds.pdf.
- Montana Legislative Fiscal Division, “Managing Volatility, Part IV,” 7-10.
- Ibid., 7.
- D. Bruce (director, Boyd Center for Business and Economic Research), interview with The Pew Charitable Trusts, March 29, 2023.
- Connecticut Office of Fiscal Analysis, “Fiscal Accountability Report: FY 19-FY 22” (2018), 31, https://www.cga.ct.gov/ofa/Documents/year/FF/2019FF-20181115_Fiscal%20Accountability%20Report%20FY%2019%20-%20FY%2022.pdf.
- Ibid., 31-32.
- R. Wilcox (senior economist, budget and policy analyst, Utah Governor’s Office of Planning and Budget), interview with The Pew Charitable Trusts, Jan. 23, 2023.
- Montana Legislative Fiscal Division, “Managing Volatility, Part IV,” 10; Montana H.B. 424.
- Government Finance Officers Association, “Best Practices: Long-Term Financial Planning,” accessed Sept. 19, 2023, https://www.gfoa.org/materials/long-term-financial-planning.
- The Volcker Alliance, “Truth and Integrity in State Budgeting,” accessed Sept. 19, 2023, https://www.volckeralliance.org/initiatives/truth-and-integrity-government-finance; National Association of State Budget Officers, “Budget Processes in the States, Spring 2021” (2021), 40, https://higherlogicdownload.s3.amazonaws.com/NASBO/9d2d2db1-c943-4f1b-b750-0fca152d64c2/UploadedImages/Budget%20Processess/NASBO_2021_Budget_Processes_in_the_States_S.pdf.
- K. Walker, budget director, state of North Carolina, memorandum to chairs of the House and Senate Appropriations and Finance committees, Jan. 26, 2023, https://www.osbm.nc.gov/ncga-report-savingsreservetargeteval-jan23/download?attachment.


ADDITIONAL RESOURCES


