The Effects of Changing Felony Theft Thresholds
More evidence that higher values have not led to increased property crime or larceny rates
Getty Images
Overview
Since 2000, at least 37 states have raised their felony theft thresholds, or the value of stolen money or goods above which prosecutors may charge theft offenses as felonies, rather than misdemeanors.1 Felony offenses typically carry a penalty of at least a year in state prison, while misdemeanors generally result in probation or less than a year in a locally run jail. Lawmakers have made these changes to prioritize costly prison space for more serious offenders and ensure that value-based penalties take inflation into account. A felony theft threshold of $1,000 established in 1985, for example, is equivalent to more than twice that much in 2015 dollars.2
Critics have warned that these higher cutoff points might embolden offenders and cause property crime, particularly larceny, to rise.3 To determine whether their concerns have proved to be true, The Pew Charitable Trusts examined crime trends in the 30 states that raised their felony theft thresholds between 2000 and 2012, a period that allows analysis of each jurisdiction from three years before to three years after the policy change. Pew also compared trends in states that raised their thresholds during this period with those that did not.
This chartbook, which updates and reinforces an analysis published in 2016, illustrates three important conclusions:
- Raising the felony theft threshold has no impact on overall property crime or larceny rates.
- States that increased their thresholds reported roughly the same average decrease in crime as the 20 states that did not change their theft laws.
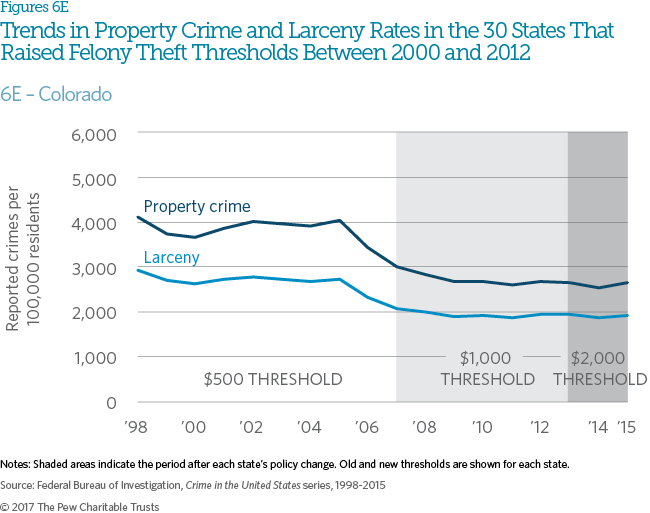
- The amount of a state’s felony theft threshold—whether it is $500, $1,000, $2,000, or more—is not correlated with its property crime and larceny rates.
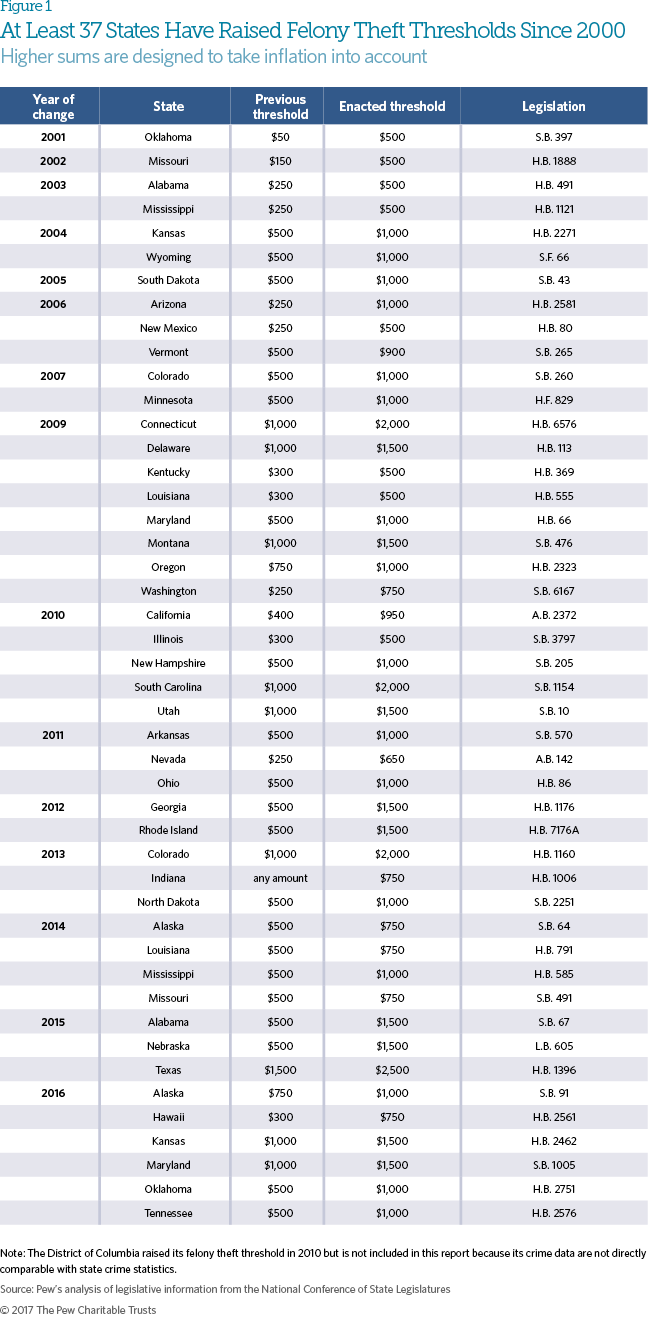
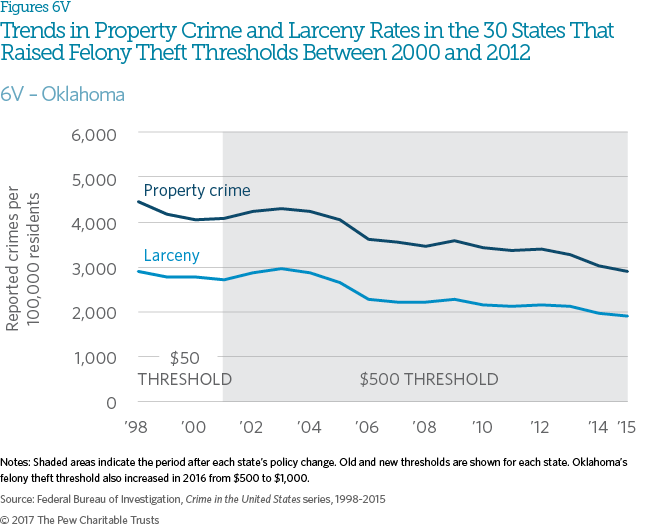
Since 2000, at least 37 states have raised their felony theft thresholds, including nine that did so twice.4 In terms of percentage, Oklahoma’s tenfold increase, from $50 to $500 in 2001, was the largest in the nation.
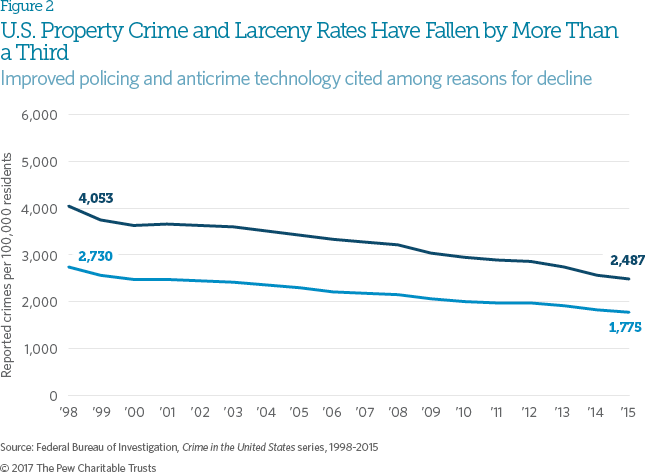
Changes in state felony theft thresholds have not interrupted the long nationwide decline in property crime and larceny rates that began in the early 1990s. The U.S. property crime rate fell 39 percent from 1998—three years before Oklahoma enacted the first of the state threshold hikes included in this analysis—to 2015, the most recent year for which data are available.5 The U.S. larceny rate fell 35 percent during that span.6
Experts attribute the nation’s sustained drop in violent and property crime rates to a host of factors, including better policing; the increased incarceration of certain repeat offenders; an expansion in private security personnel; an aging population that is less prone to criminal behavior; and technological advances, such as the widespread use of surveillance cameras, car- and home-alarm systems, and digital transactions that have reduced the need for cash.7
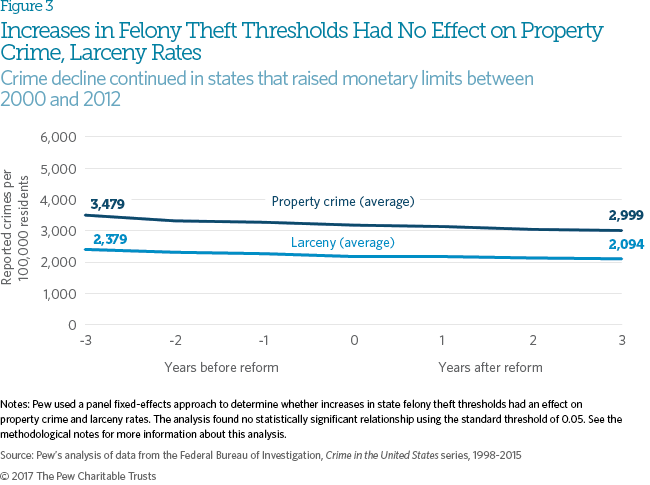
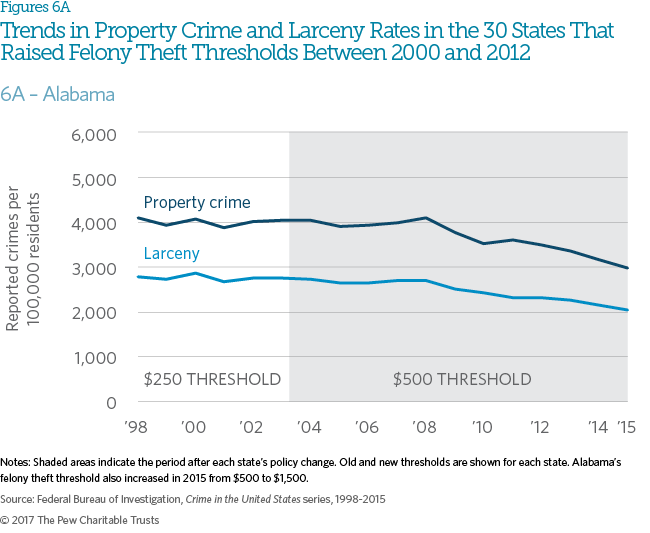
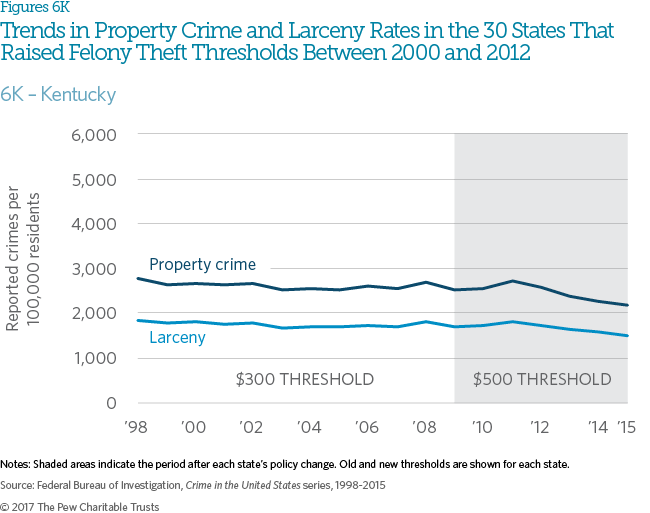
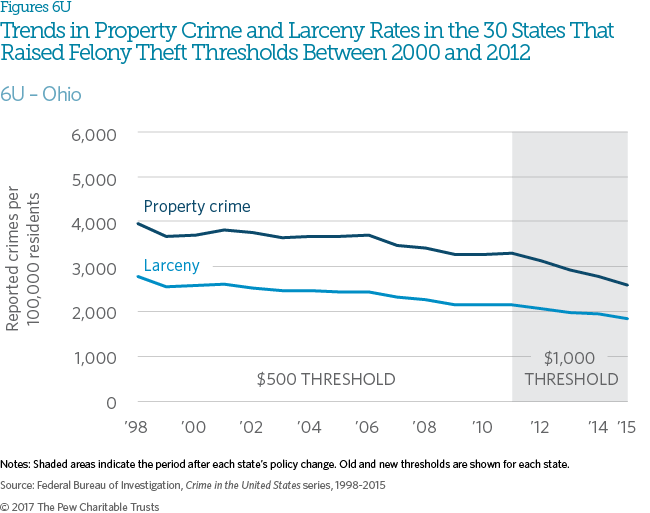
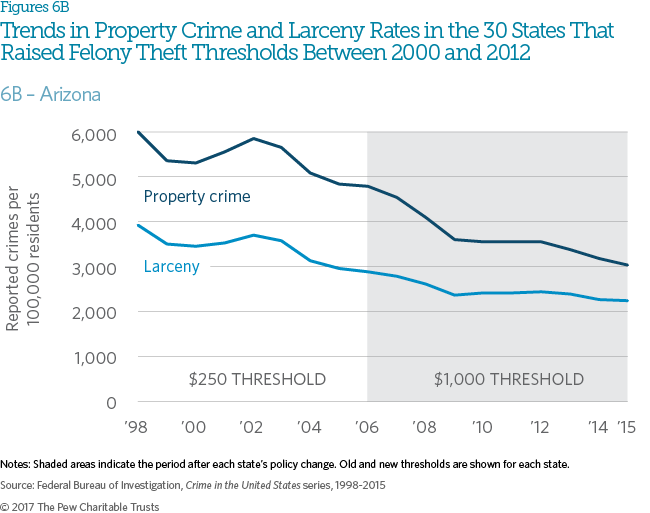
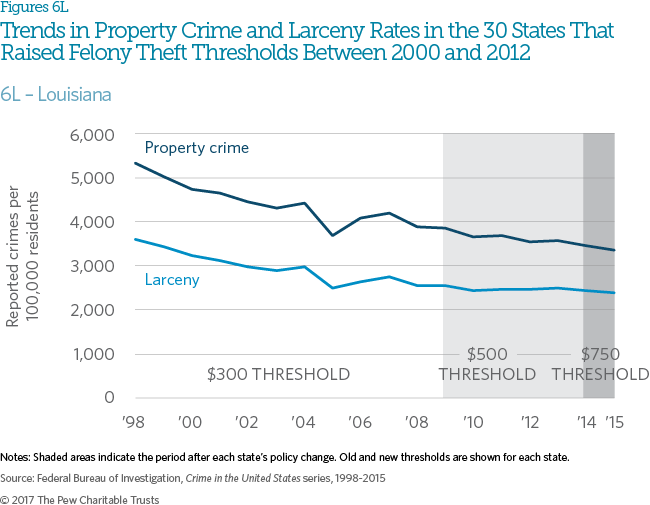
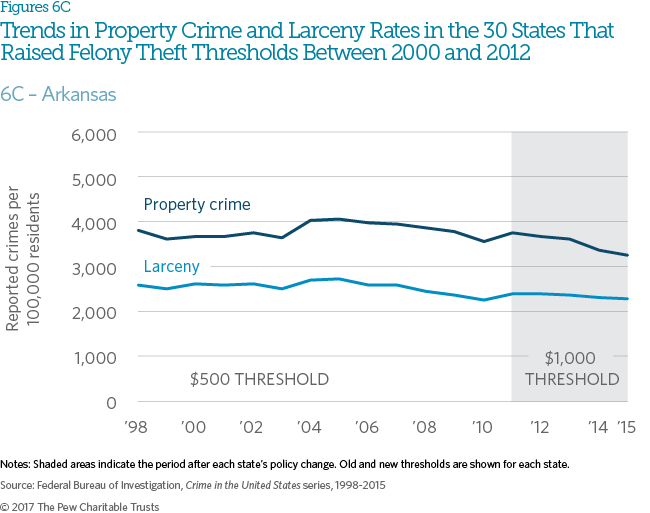
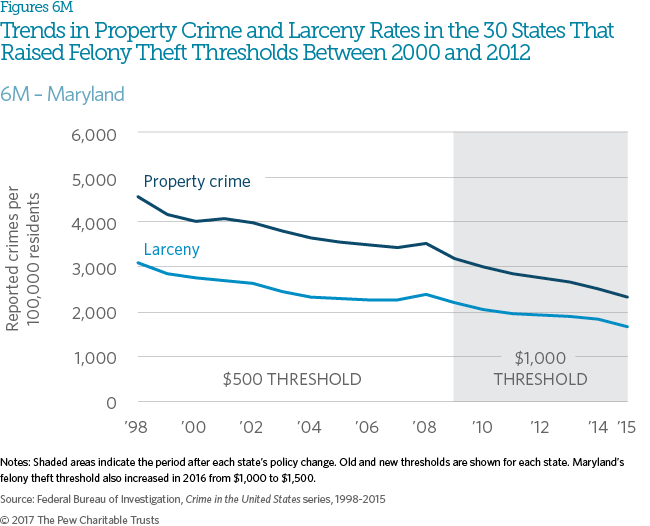
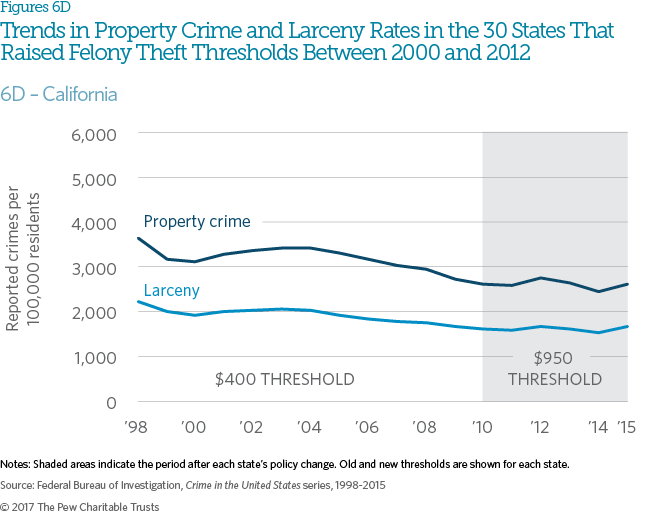
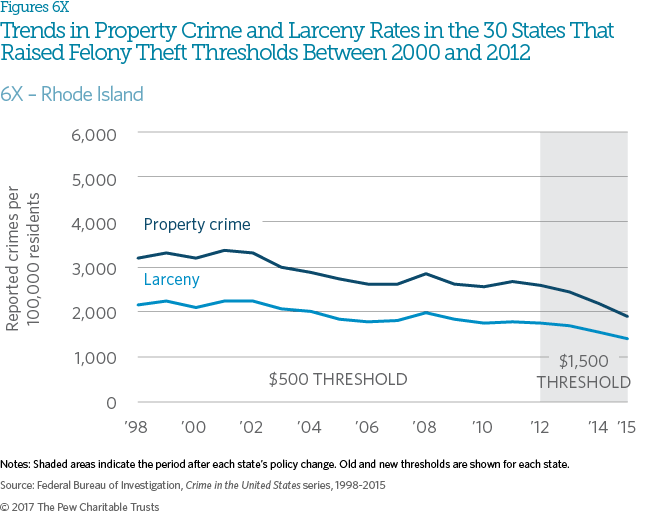
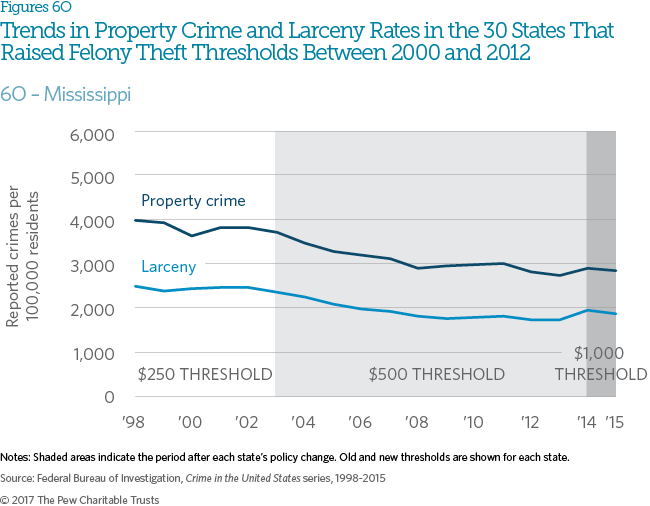
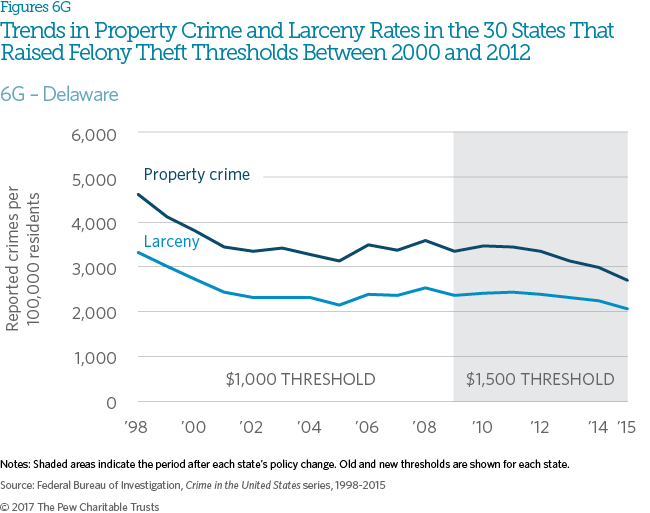
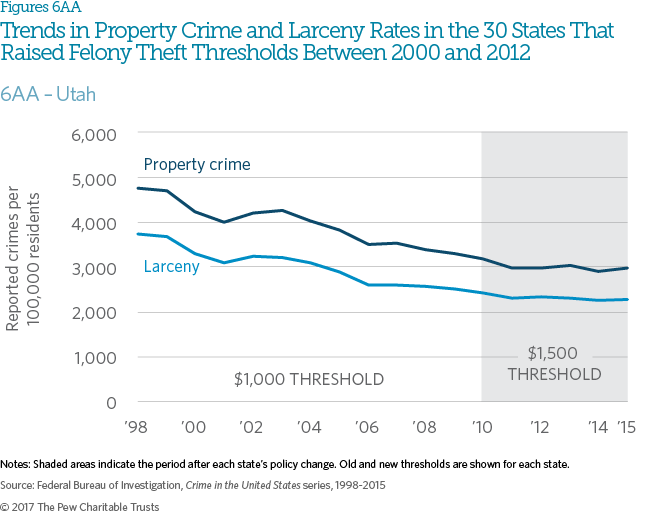
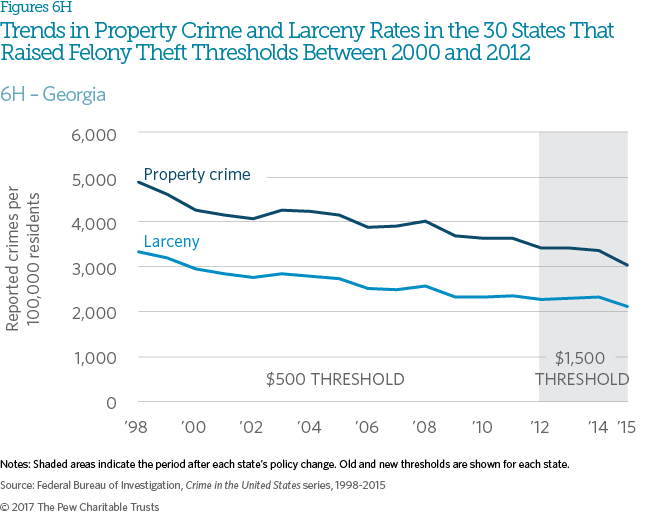
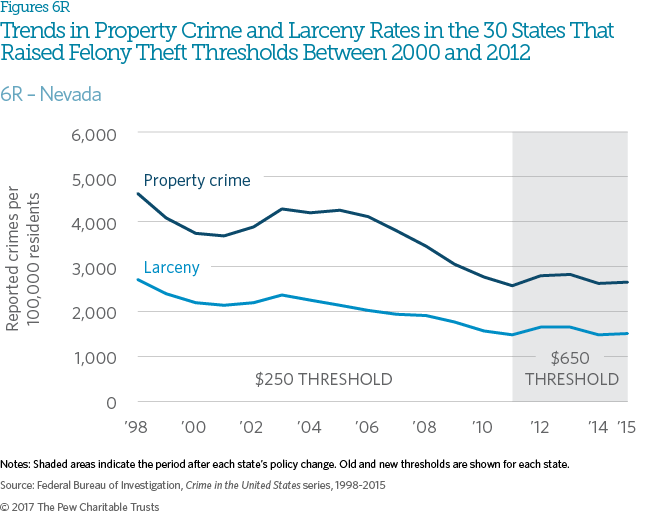
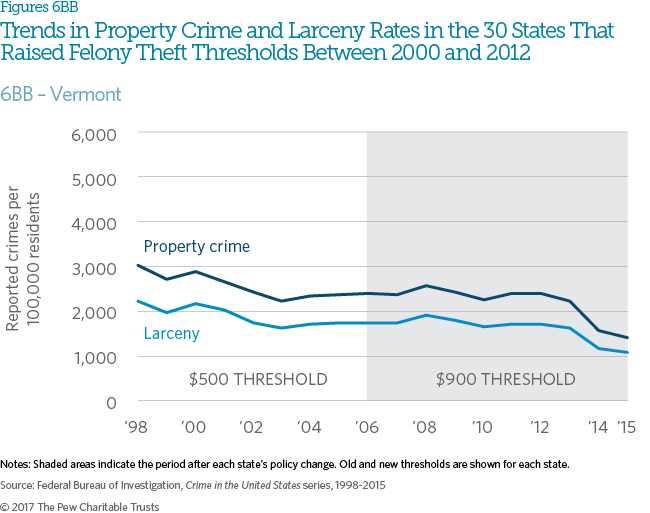
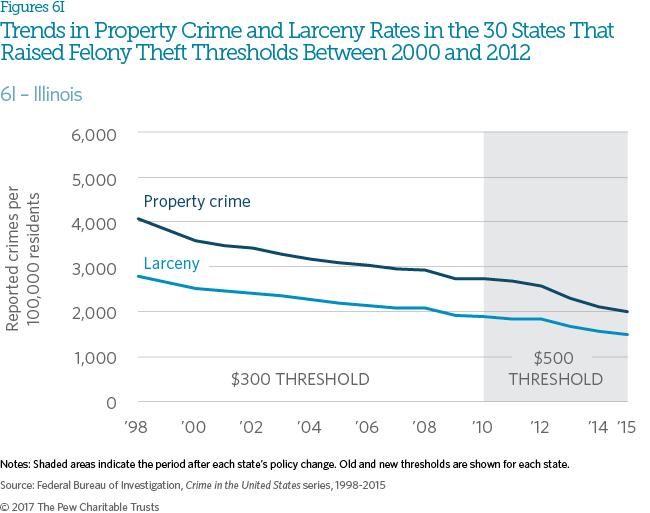
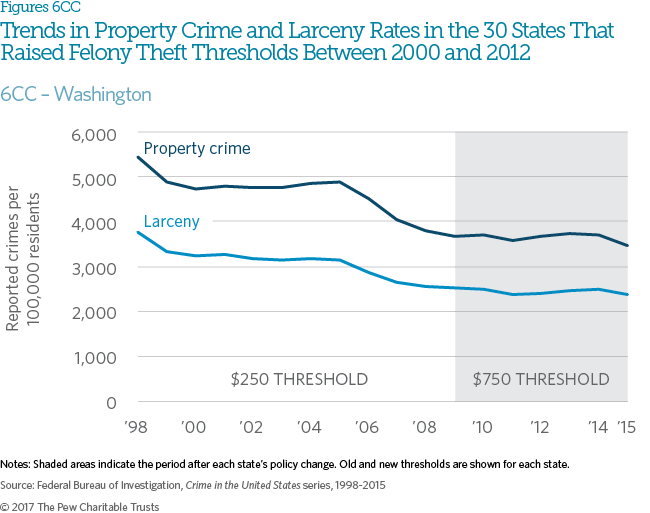
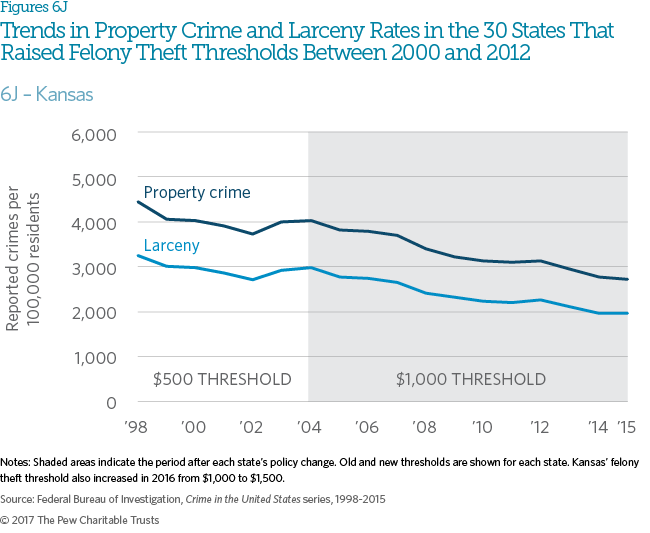
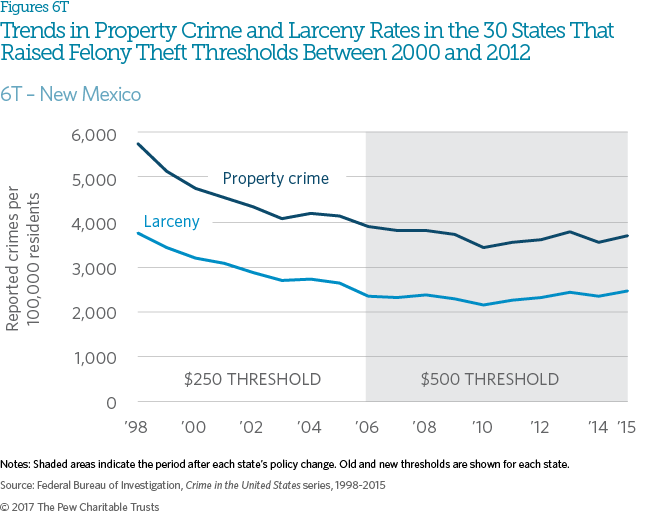
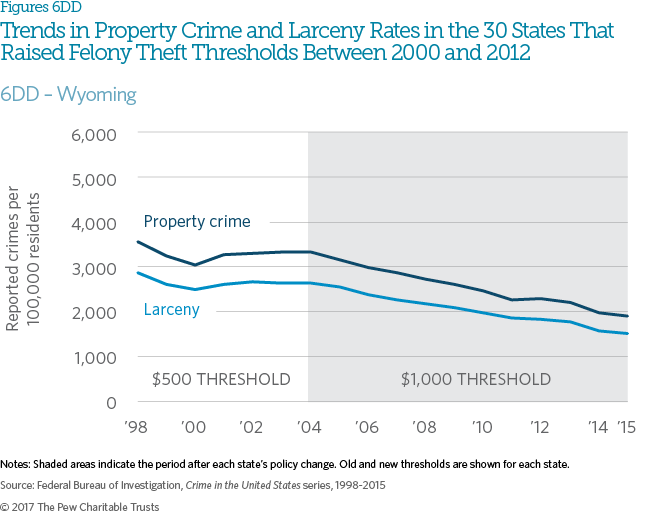
Because property crime and larceny rates have been on a downward trajectory nationwide, it is important to evaluate whether the same trend can be observed in states that have raised their felony theft thresholds. Average property crime and larceny rates continued to fall in the states that raised their thresholds between 2000 and 2012.
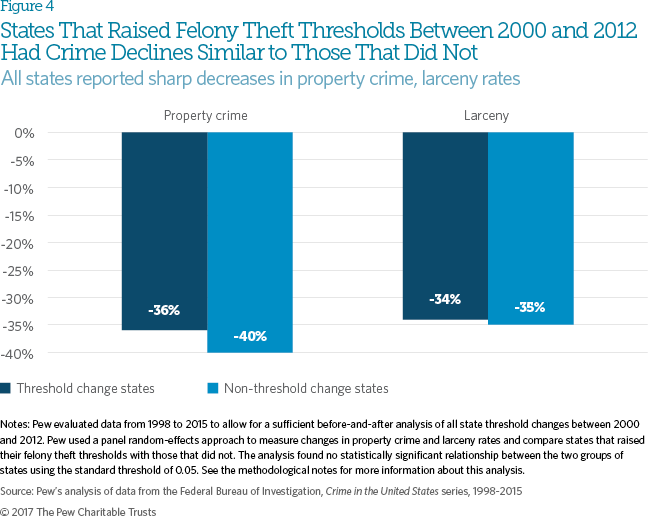
When comparing the 30 states that raised their felony theft thresholds between 2000 and 2012 with the 20 that did not, property crime and larceny rates fell slightly more in the latter group, although the differences were not statistically significant.
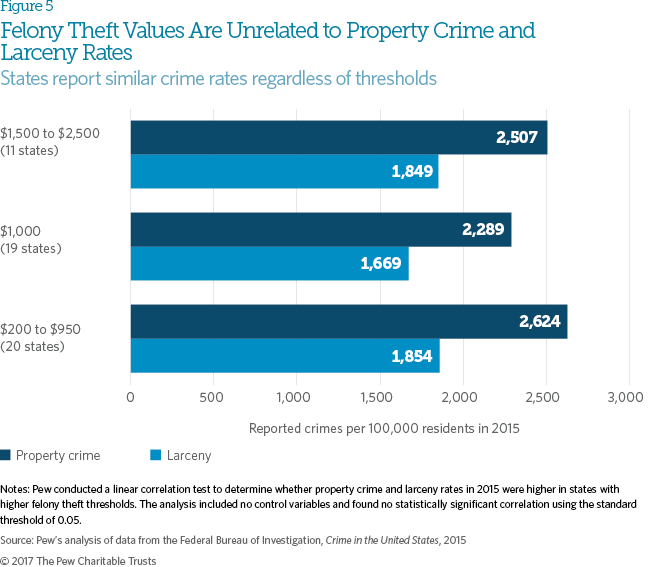
The value of states’ felony theft thresholds—whether set at $500, $1,000, or $2,000—is not correlated with property crime and larceny rates. Florida, for example, treats theft as a felony if the value of stolen money or goods exceeds $300, but its property crime and larceny rates are considerably higher than those in Pennsylvania, where the threshold is $2,000.
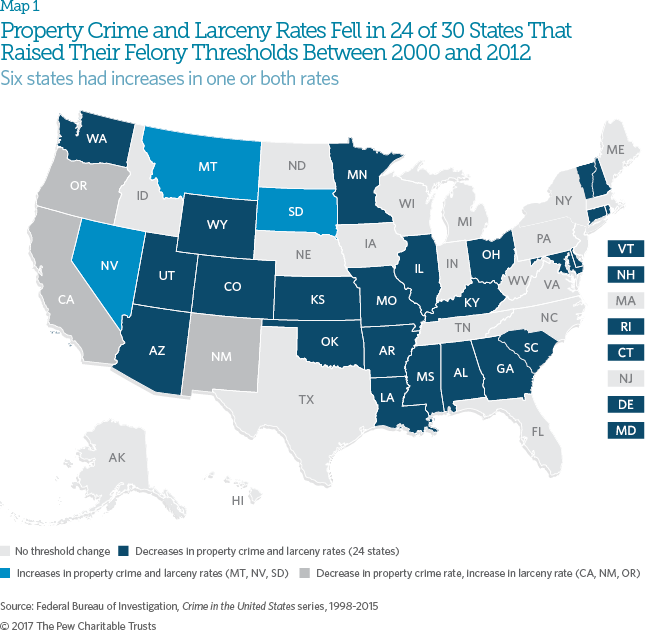
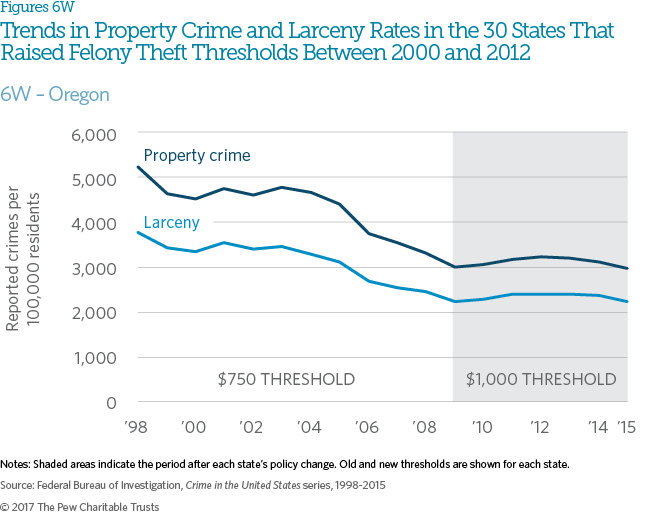
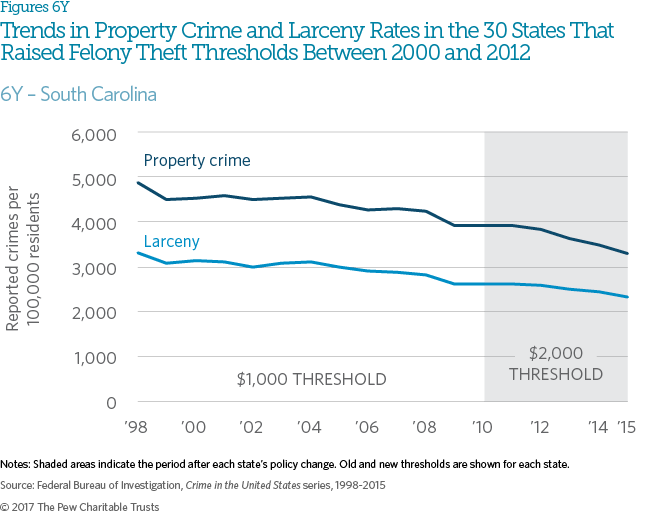
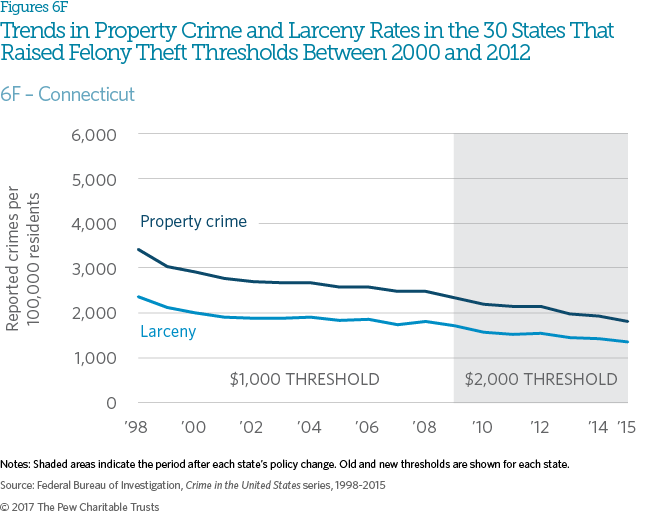
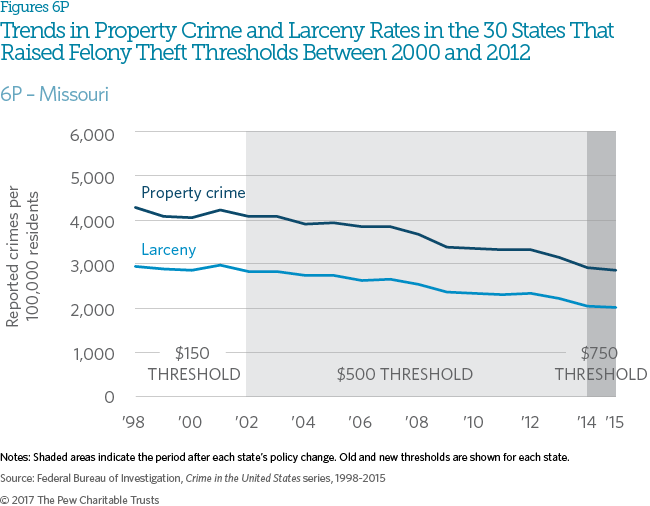
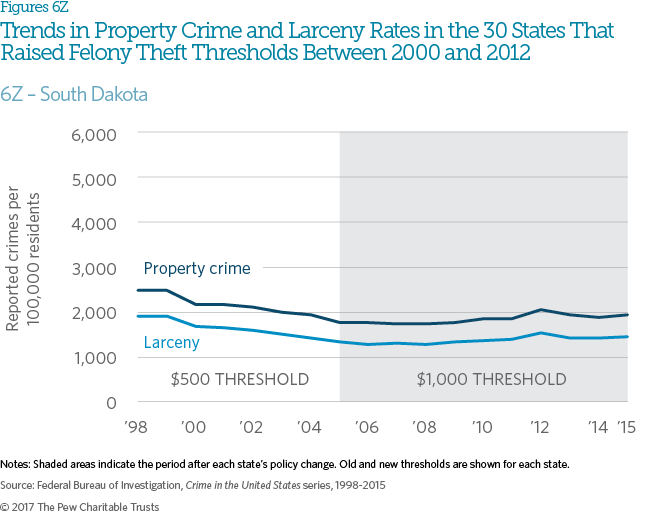
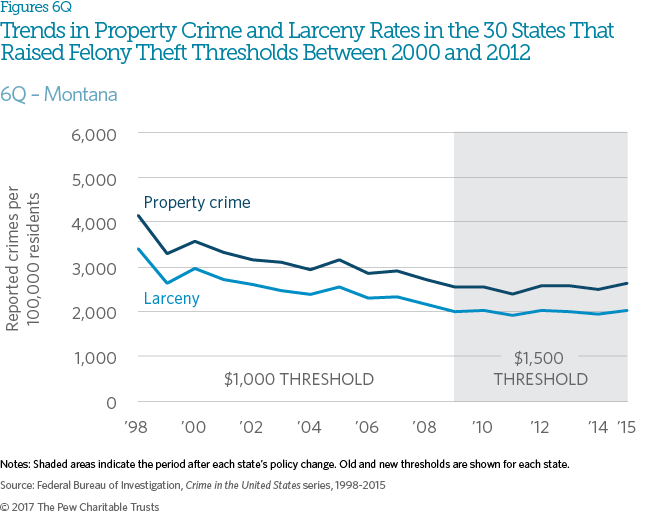
An examination of long-term trends in property crime and larceny rates shows year-over-year fluctuations within many of the 30 states that raised their felony theft thresholds between 2000 and 2012. Nevertheless, for all but six of the 30 states—California, Montana, Nevada, New Mexico, Oregon, and South Dakota—property crime and larceny rates were lower in 2015 than in the year in which each state raised its threshold.8
Methodological notes
The statistical models for Figures 3 and 4 isolated the impact of threshold changes on property crime and larceny rates in each state in the year after the policy change and controlled for annual demographic, employment, and income information. The strength of this strategy is that only variables that change over time within each state must be controlled. Demographic data are drawn from the U.S. Census Bureau, and unemployment and income data are derived from the U.S. Bureau of Labor Statistics. State property crime and larceny rates are published by the FBI and are per 100,000 residents. The natural log of property crime and larceny rates was used in the model to account for general declines in rates over time.
Endnotes
- Pew analysis of legislative information from the National Conference of State Legislatures. The District of Columbia raised its felony theft threshold in 2010 but is not included in this analysis because its crime data are not directly comparable with state crime statistics.
- Bureau of Labor Statistics, Consumer Price Index Inflation Calculator, http://data.bls.gov/cgi-bin/cpicalc.pl.
- Property crime includes the offenses of burglary, larceny-theft, motor vehicle theft, and arson. Larceny-theft includes offenses such as shoplifting and bicycle theft but does not include offenses such as embezzlement, forgery, and fraud. Definitions are set nationally by the Federal Bureau of Investigation and are not affected by individual states’ crime definitions or penalty levels.
- Pew analysis of legislative information from the National Conference of State Legislatures.
- Federal Bureau of Investigation, Uniform Crime Reporting data tool, http://www.ucrdatatool.gov; and Federal Bureau of Investigation, “Crime in the U.S., 2015,” https://ucr.fbi.gov/crime-in-the-u.s/2015.
- Ibid.
- The Pew Charitable Trusts, “Weighing Imprisonment and Crime” (February 2015), http://www.pewtrusts.org/~/media/assets/2015/02/pspp_qa_experts_brief.pdf.
- Property crime and larceny rates were higher in Montana, Nevada, and South Dakota. The larceny rate was higher in California, New Mexico, and Oregon.


