7 Years After Recession, States Are Still Rebuilding Reserves
Note: These data have been updated. To see the most recent data and analysis, visit Fiscal 50
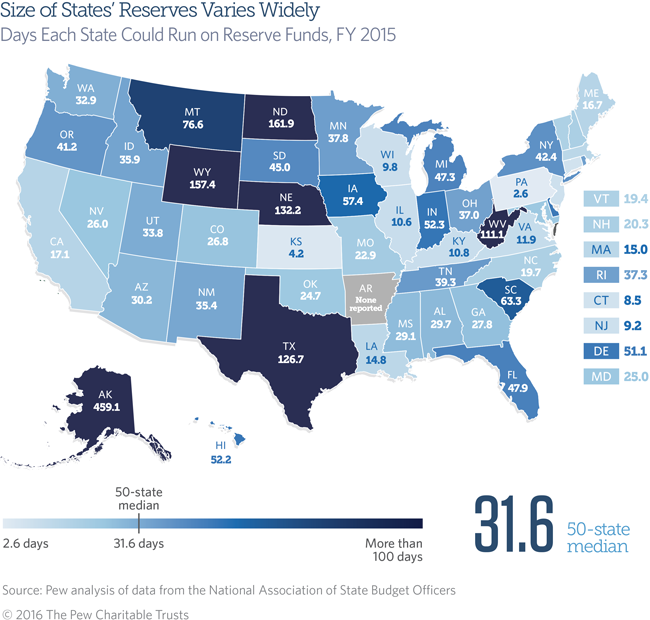
Most states have thinner financial cushions now than they did heading into the Great Recession. Overall, states had enough money in general fund budget reserves in fiscal year 2007—just before the economic downturn—to run government operations for a median of 41.3 days. That compares with 31.6 days in fiscal 2015 and an estimated 29.2 days in fiscal 2016.
For many states, even pre-recession reserve levels were inadequate to plug huge budget gaps that opened as a result of the 2007-09 recession. Still, in fiscal 2015, just 19 states could cover more days’ worth of operating expenses with their reserves—counting both rainy day funds and end-of-year balances—than they could before the downturn. Only 15 states expected to end fiscal 2016 with a larger financial cushion than before the recession, according to estimates made before the fiscal year ended in most states on June 30.
Since dropping in the recession, states’ financial cushions have improved largely because of growth in rainy day funds. End-of-year balances, which make up the amount left at the end of a fiscal year in what functions as a state’s main checking account, have been more volatile.
Based on data collected by the National Association of State Budget Officers (NASBO), states’ budget stabilization funds, also called rainy day funds, totaled $47.2 billion in fiscal 2015—greater than before the recession in both nominal dollars and as a share of government expenditures. Meanwhile, states’ end-of-year balances totaled $30.5 billion in fiscal 2015, lower than at their pre-recession peak in both dollars and as a share of expenditures.
Although final numbers have not yet been tallied for fiscal 2016, 31 states estimated that their reserves would drop relative to operating expenditures from a year earlier. Those preliminary results are highly likely to change. However, states braced for the biggest declines were Alaska and North Dakota, where falling oil prices led each to withdraw substantial amounts from their rainy day funds in fiscal 2016 to make up for tax revenue shortfalls.
State highlights
According to states’ results for fiscal 2015 and estimates for fiscal 2016:
- Alaska ended fiscal 2015 with the nation’s largest reserves as a share of operating costs (459.1 days), despite drawing down more than a third of its rainy day funds to shore up retirement accounts and cover a budget shortfall as oil-related revenue plunged. However, reserves fell for the fifth year in a row in fiscal 2016—to an estimated 219 days’ worth of operating costs—as lawmakers again tapped savings to make up for lost revenue.
- Five other states also ended fiscal 2015 with more than 100 days of operating costs in reserves: North Dakota (161.9 days), Wyoming (157.4 days), Nebraska (132.3 days), Texas (126.7 days), and West Virginia (111.1 days). However, all but Wyoming predicted declines in fiscal 2016—particularly North Dakota, which drained the last of its budget stabilization fund in a special legislative session in August 2016 to plug an end-of-year budget shortfall.
- The smallest reserves—less than a week’s worth of operating costs—were in Arkansas (0 days), Pennsylvania (2.6 days), and Kansas (4.2 days) in fiscal 2015. In fiscal 2016, those states were joined by Illinois, Virginia, and Wisconsin in forecasting reserves of less than seven days.
- In fiscal 2015, three states’ reserves could cover more days’ worth of operating costs than at any point since at least 2000: New York (42.4 days), Rhode Island (37.3 days), and Texas (126.7 days). All three, though, forecast lower levels in fiscal 2016. New York’s total spiked in fiscal 2015 because of $4.7 billion in one-time money it collected from legal settlements reached with financial institutions.
Fiscal 50’s ranking of states by reserve fund levels is based on fiscal 2015 results, because fiscal 2016 data are highly likely to change once states officially close their books. In recent years, final figures have been higher than estimates, because it is difficult for states to pinpoint ending balances before all of their bills are paid and revenue is collected.
Why reserves matter
States use reserves and balances to manage budgetary uncertainty, deal with revenue forecasting errors, prevent severe spending cuts and tax increases, and cope with unforeseen emergencies. Because reserves and balances are vital to managing unexpected changes and maintaining fiscal health, their levels are tracked closely by bond rating agencies. For example, S&P Global Ratings downgraded Kansas’ credit rating in July 2016, citing withdrawals from its reserves “during a period of national economic expansion” as one sign of budget pressures facing the state.
Building up reserves and balances is a sign of fiscal recovery, but there is no one-size-fits-all rule on when, how, and how much to save. States with a history of significant revenue or economic volatility may desire larger cushions. According to a December 2015 report by Pew, the optimal savings target of state rainy day funds depends on three factors: the explicitly defined purpose of funds, the volatility of a state’s tax revenue, and the level of coverage—similar to an insurance policy—that the state seeks to provide for its budget.
This measure does not take into account additional resources that some states may have available to soften downturns, such as dedicated reserves outside of their general funds or rainy day accounts, so it may not reflect a state’s complete fiscal cushion. For example, Arkansas reports zero to NASBO for both its ending balance and its rainy day funds, even though the state sets money aside. In addition, some states undertake considerable spending outside of the general fund, so comparisons across states should be made with caution.
Download the data to see individual state trends. Visit Pew's interactive resource Fiscal 50: State Trends and Analysis to sort and analyze data for other indicators of state fiscal health.

ADDITIONAL RESOURCES
Fact Sheet


