Getting Into High School in Philadelphia
The workings of a complicated system
Overview
In the School District of Philadelphia, students are not required to attend a particular high school. A wide—and potentially bewildering—variety of choices confronts eighth-graders and their parents. To go anywhere other than their neighborhood high schools, they must identify the options they think fit their needs and apply to them.
Counting charter schools, Philadelphia has 98 publicly funded high schools, some of which offer multiple programs. These include 24 neighborhood schools, the majority of which are rated as low-quality under the district’s accountability system. Most eighth-graders apply to other programs that get better ratings and are more selective, including 21 highly competitive “special admission” programs—all of which have academic standards for admission—and 121 less competitive programs categorized by the district as “citywide admission.” Also available are 43 charter high schools, which are publicly funded but not operated by the school district.
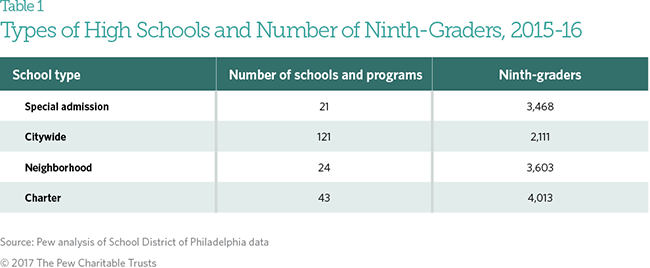
The Pew Charitable Trusts, working with data provided by the School District of Philadelphia, analyzed the process of matching students who were eighth-graders in 2014-15 with district-run high schools for the subsequent school year. The analysis sought to shed light on two central topics: How the application, admission, and enrollment process worked for students applying to ninth grade—and who attended the special admission schools, presumably the most desirable of the district-run institutions. In the end, 3,468 students went to these schools, accounting for 26 percent of the ninth-graders districtwide. The system, which has changed little since then, had elements that were complex and potentially challenging for students and parents to navigate.
The vast majority of students participated in a centralized application process. First they filled out an online form, listing up to five schools in order of preference. Then they found out which schools had admitted them and chose among the available options. In addition, other decisions made by students and their families affected the outcomes.
Some eighth-graders with qualifying test scores made no attempt to get into the special admission schools. Other students, once accepted, turned down the offers, enrolling at their neighborhood schools or somewhere else. And a number of students, once enrolled, did not come to school when the academic year opened in September. Opting out at these decision points was more common among certain groups of students, particularly Latinos. Superintendent William R. Hite Jr. called the disappearance of any qualified student from the special admission pipeline a “lost opportunity” for both the district and the student.
The analysis found that acceptance to the special admission schools for 2015-16 depended on three factors:
- The academic qualifications of the student, with test scores playing a key role. For each school, minimum applicant scores on the Pennsylvania System of School Assessment (PSSA) test were listed in the district’s high school directory; many students who did not have those scores applied anyway.
- Student and parent/guardian participation in the application process, through which they selected the schools the students wanted to attend.
- Admission decisions made independently by administrators at individual schools.
Even though school officials said a student’s test scores are a key to acceptance at the special admission schools, some eighth-graders who lacked the minimum scores got in—11 percent of admitted students came from this group—and some who had the scores were rejected. District officials said the admission of students who did not meet the test-score criteria occurred in some cases because individual schools did not have enough qualified applicants. Rejections of students who did have the minimum scores were probably based on their grades, poor performance in an interview or audition, attendance and behavior records, or lack of space.
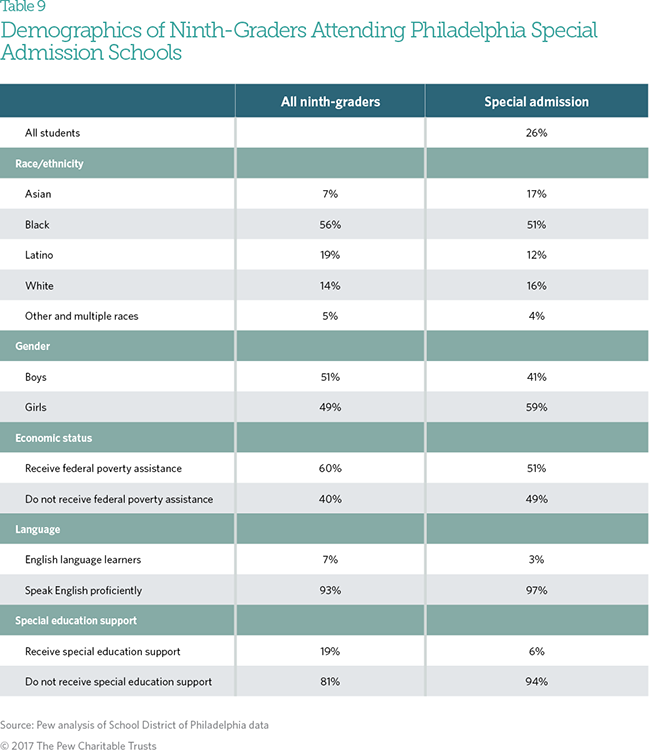
All of these factors resulted in ninth-grade student bodies at the special admission schools in 2015-16 that differed in a number of ways from the district’s ninth-graders as a whole:
- There were higher percentages of Asians and whites, and lower percentages of Latinos and blacks. Among all ninth-graders, 56 percent were black, 19 percent Latino, 14 percent white, and 7 percent Asian. At the special admission schools, the numbers were 51 percent black, 12 percent Latino, 16 percent white, and 17 percent Asian.
- There were smaller percentages of low-income students. Although individuals receiving federal poverty assistance accounted for 60 percent of all ninth-graders, they represented 51 percent of those in the special admission schools.
- There were more girls and fewer boys. In the district as a whole, 51 percent of ninth-graders were boys and 49 percent girls, but at the special admission schools, the figures were 41 percent boys and 59 percent girls.
Also present at lower percentages in special admission schools than in the district as a whole were English language learners and students receiving special education support because of learning difficulties or physical disabilities.
The analysis indicates that test scores were a key reason for some groups’ greater success in getting into the special admission schools. For instance, 61 percent of white and 71 percent of Asian students for whom data were available—mostly eighth-graders who attended district-run schools—had the minimum standardized test scores for nearly all of the special admission schools. But only 33 percent of black and 34 percent of Latino students had the necessary scores.
Among students with qualifying test scores, the special admission schools rejected higher percentages of some groups of students. Those groups included Latinos, blacks, boys, students receiving federal poverty assistance, and those getting special education support. And among those who did not meet the test score criteria, acceptance rates at the special admission schools were higher among Asians and individuals not receiving federal poverty assistance—and lower among Latinos and students receiving special education support.
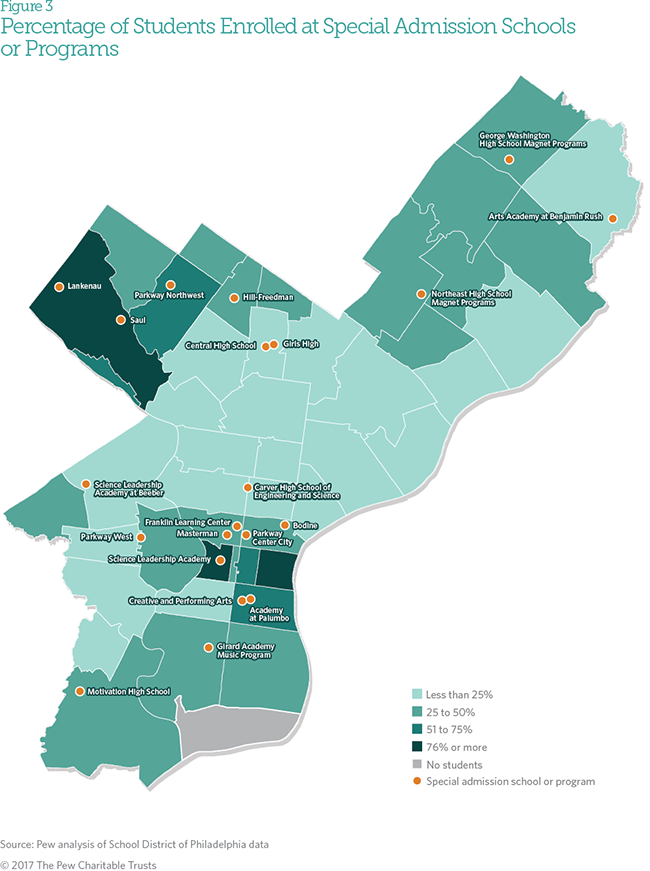
Analysis of the data indicated that students’ neighborhoods mattered as well. In five city ZIP codes, covering mostly high-income parts of Center City and Northwest Philadelphia, more than half of the eighth-graders enrolled in Philadelphia public schools wound up in special admission schools. In much of West Philadelphia, North Philadelphia, and Northeast Philadelphia, the percentage of eighth-graders who went to these schools was below 25 percent. This appeared to be not just a matter of where the students lived but where the schools were located. Enrollment was lower in ZIP codes where the schools were relatively far from or not readily accessible by public transportation.
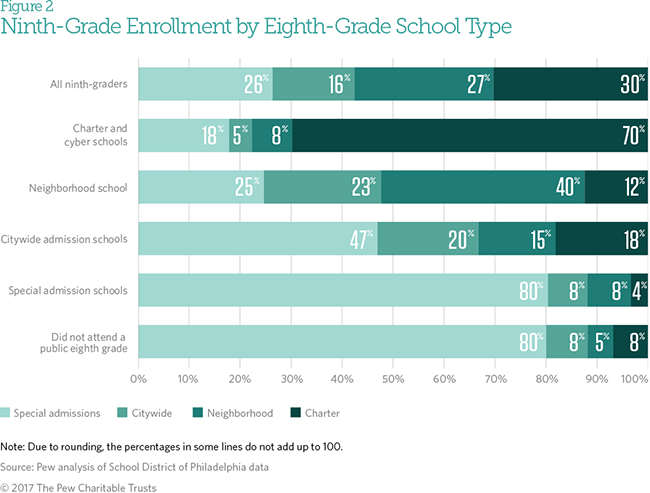
Finally, the type of schools that students attended in eighth grade was a factor. In 2014-15, there were eight special admission schools or programs open to eighth-graders, all of which had academic admission standards. Eighty percent of eighth-graders who attended these programs went on to special admission high schools. Seventy-three percent of students who went to charter schools for ninth grade also attended charters in eighth grade.
In some ways, this mirrors the college application process: Students apply to multiple schools, some more difficult to get into than others, with the differences in quality having potential implications for students’ futures. Each school has its own standards, and administrators at each one make decisions on the applications without knowing where else the student has applied. Students may be admitted to multiple schools or none at all.
In some other urban districts, each student is admitted to a single school after expressing a preference. The central question examined in this report is how the Philadelphia system for placing students in various high schools and programs works—with particular focus on the highly competitive special admission programs.


The State of Education in Philadelphia, 2019


Pew Examines High School Selection Process in Philadelphia
Report sheds light on which students attended 21 special admission programs


A School Funding Formula for Philadelphia
Lessons from urban districts across the United States


How Charter School Governance in Pennsylvania and Philadelphia Measures Up
Read the full issue brief
ADDITIONAL RESOURCES

Article


