State, Local Government Spending on Health Care Grew Faster Than National Rate in 2012
Overview
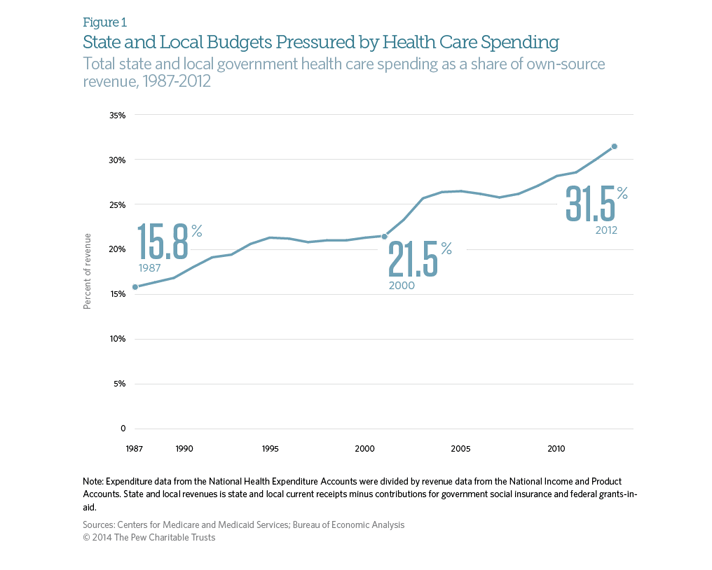
Total US health care spending grew slowly in 2012, rising about 4 percent, but the story for state and local governments was dramatically different Health care spending by states and localities increased 8 percent, according to the latest data from the Centers for Medicare and Medicaid Services, consuming a larger share of revenue—about $3 of every $10—than has been the case for such expenses since at least 1987, the earliest year for which complete data are available 1As state and local governments continue to navigate the aftermath of the Great Recession, health care spending remains a main source of fiscal pressure.
Spending accelerates after a brief slowdown
State and local government health spending data from 2012 indicate that much of the slower rate of growth (2 percent) from 2008 to 2010 can be traced to a temporary surge in federal Medicaid funding, not a change in long-term spending trends. The aid stopped flowing in July 2011 and was the primary reason state Medicaid expenditures rose steeply that year (22 percent) and in 2012 (15 percent).
Under the American Recovery and Reinvestment Act of 2009 and later legislation that extended certain provisions of the law, the federal government contributed an extra $103 billion to Medicaid, with states receiving the bulk of that total in 2009 and 2010. The Great Recession swelled Medicaid rolls and drove increases in total program expenditures, but the states' share of Medicaid spending declined from $146 billion in 2008 to $135 billion in 2010 because of federal stimulus money.2 The year-over-year decline in total state Medicaid spending in 2009 was only the second nominal decrease since the program's creation in 1965.3
Long-term outlook
Growing health care spending poses serious fiscal challenges at all levels of government. This is especially true for states and localities that must balance their spending and revenue each year.
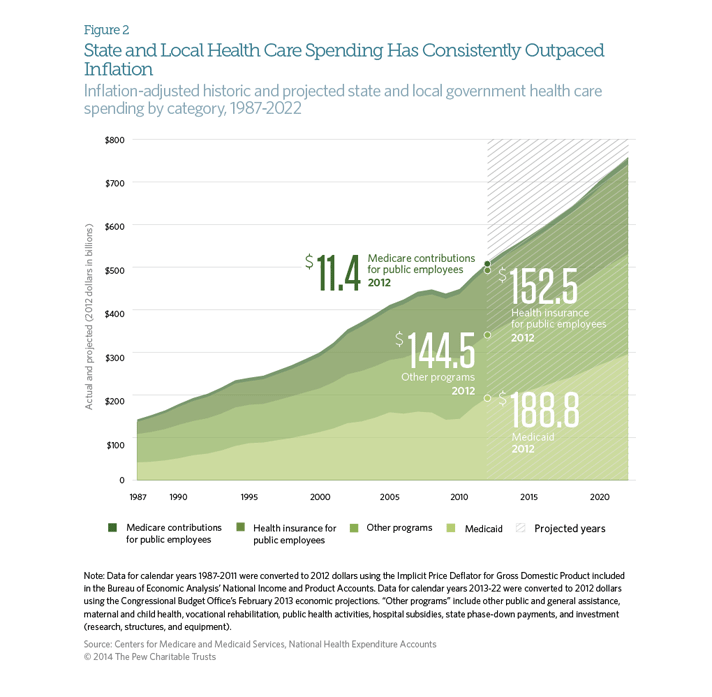
For state and local governments, health care spending as a share of revenue increased from 16 percent in 1987 to 31 percent in 2012. Combined health care expenditures by state and local governments increased an inflation-adjusted 260 percent during that time.4

The most significant elements of this expansion were state and local contributions to public employee health insurance premiums and to Medicaid, which experienced inflation-adjusted increases of 444 percent and 375 percent, respectively.
In the years ahead, the Centers for Medicare and Medicaid Services projects that state and local government spending will rise by 49 percent in inflation-adjusted dollars from 2012 to 2022.

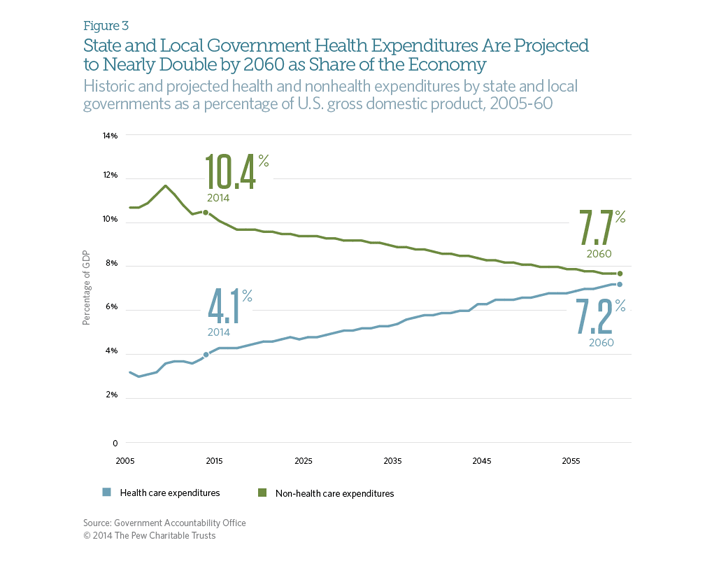
Looking further ahead, the Government Accountability Office—the nonpartisan investigative arm of Congress—warns that health care spending is the primary driver of the long-term fiscal challenges that it expects state and local governments to face. According to the GAO's simulation, state and local health-related expenditures will nearly double as a percentage of gross domestic product from 2014 to 2060.5

Forthcoming research
In the months ahead, Pew will analyze state health care spending trends across a range of categories, including Medicaid and public employee health insurance premiums, as well as others.
The State Health Care Spending Project is an initiative of The Pew Charitable Trusts and the John D. and Catherine T. MacArthur Foundation.
Endnotes
1 Centers for Medicare and Medicaid Services, National Health Expenditure Accounts, “Sponsor Highlights,” January 2014,http://www.cms.gov/Research-Statistics-Data-and-Systems/Statistics-Trends-and-Reports/NationalHealthExpendData/NationalHealthAccountsHistorical.html; and Bureau of Economic Analysis, National Income and Product Accounts, “Table 3.3, State and Local Government Current Receipts and Expenditures, http://www.bea.gov/iTable/iTable.cfm?ReqID=9&step=1#reqid=9&step=1&isuri=1.
2 Kaiser Family Foundation, “Impact of the Medicaid Fiscal Relief Provisions in the American Recovery and Reinvestment Act (ARRA)” (Oct. 1, 2011), http://www.kff.org/medicaid/upload/8252.pdf.
3 Centers for Medicare and Medicaid Services, National Health Expenditures by Type of Service and Source of Funds (January 2014), http://www.cms.gov/Research-Statistics-Data-and-Systems/Statistics-Trends-and-Reports/NationalHealthExpendData/NationalHealthAccountsHistorical.html.
4 For all inflation adjustments, data for calendar years 1987 to 2011 were converted into 2012 dollars using the Implicit Price Deflator for Gross Domestic Product included in the Bureau of Economic Analysis' National Income and Product Accounts, http://www.bea.gov/iTable/iTable.cfm?ReqID=9&step=1#reqid=9&step=1&isuri=1. Data for calendar years 2013-22 were converted into 2012 dollars using the Congressional Budget Office's economic projections in The Budget and Economic Outlook: Fiscal Years 2013 to 2023 (February 2013), http://www.cbo.gov/sites/default/files/cbofiles/attachments/43907-BudgetOutlook.pdf.
5 Government Accountability Office, “State and Local Governments' Fiscal Outlook: April 2013 Update” (April 2013), http://www.gao.gov/special.pubs/longterm/state/index.html.


