What Factors Drive Broadband Affordability for Middle-Class Families?
Overview
States have begun implementing the federal Broadband Equity, Access, and Deployment Program (BEAD). The program, which was created in 2021 under the Infrastructure Investment and Jobs Act, provides $42.45 billion to states to expand the availability of high-speed internet service and requires them to ensure that “high-quality broadband services are available to all middle-class families … at reasonable prices.”
Previous research by The Pew Charitable Trusts calculated middle-class affordability regionally and at the state and county levels using the Federal Communications Commission’s benchmark of 2% of monthly household income and assuming, based on previous work from the Brookings Institution and Pew Research Center, that middle-class household incomes range from $40,000 to $150,000 nationally. That analysis revealed substantial variation throughout the country, including across metro, metro-adjacent, and rural areas; identified some limitations of the 2% benchmark as an affordability metric; and recommended that state policymakers develop customized solutions when crafting middle-class affordability plans.
This brief builds on those findings by examining how place-based factors—such as education levels, social vulnerability, regional economic strength, and measures of income inequality—influence broadband affordability. Further, these measures reinforce that income is not the only factor policymakers should consider when seeking to understand broadband affordability and adoption challenges. Together, these metrics provide a more holistic understanding of the variables that affect households’ ability to adopt broadband, which can help states compensate for the 2% benchmark’s limitations and develop effective, targeted policies for delivering affordable broadband to middle-class families.
Pew’s analysis indicates that these and other social and demographic factors drive middle-class broadband affordability and that state broadband offices must account for these variables when evaluating whether their definition of “reasonable prices” is sufficient to yield truly affordable subscription plans for their communities.
Accordingly, state policymakers should:
- Incorporate local social and economic demographics in their scoring metrics for BEAD applications to better reflect middle-class affordability in their communities.
- Consider multiple factors when crafting affordability plans to avoid pricing out targeted households.
What factors are associated with broadband affordability?
The 2% benchmark revealed how affordability differs across states, counties, and regions based on the median income levels in those places, reflecting the various cost-of-living standards throughout the country. Pew found that county-level affordability baselines ranged from $28.52 in Issaquena County, Mississippi, to $261.37 in Loudoun County, Virginia. However, those findings did not capture the household and community factors that might contribute to this wide variation.
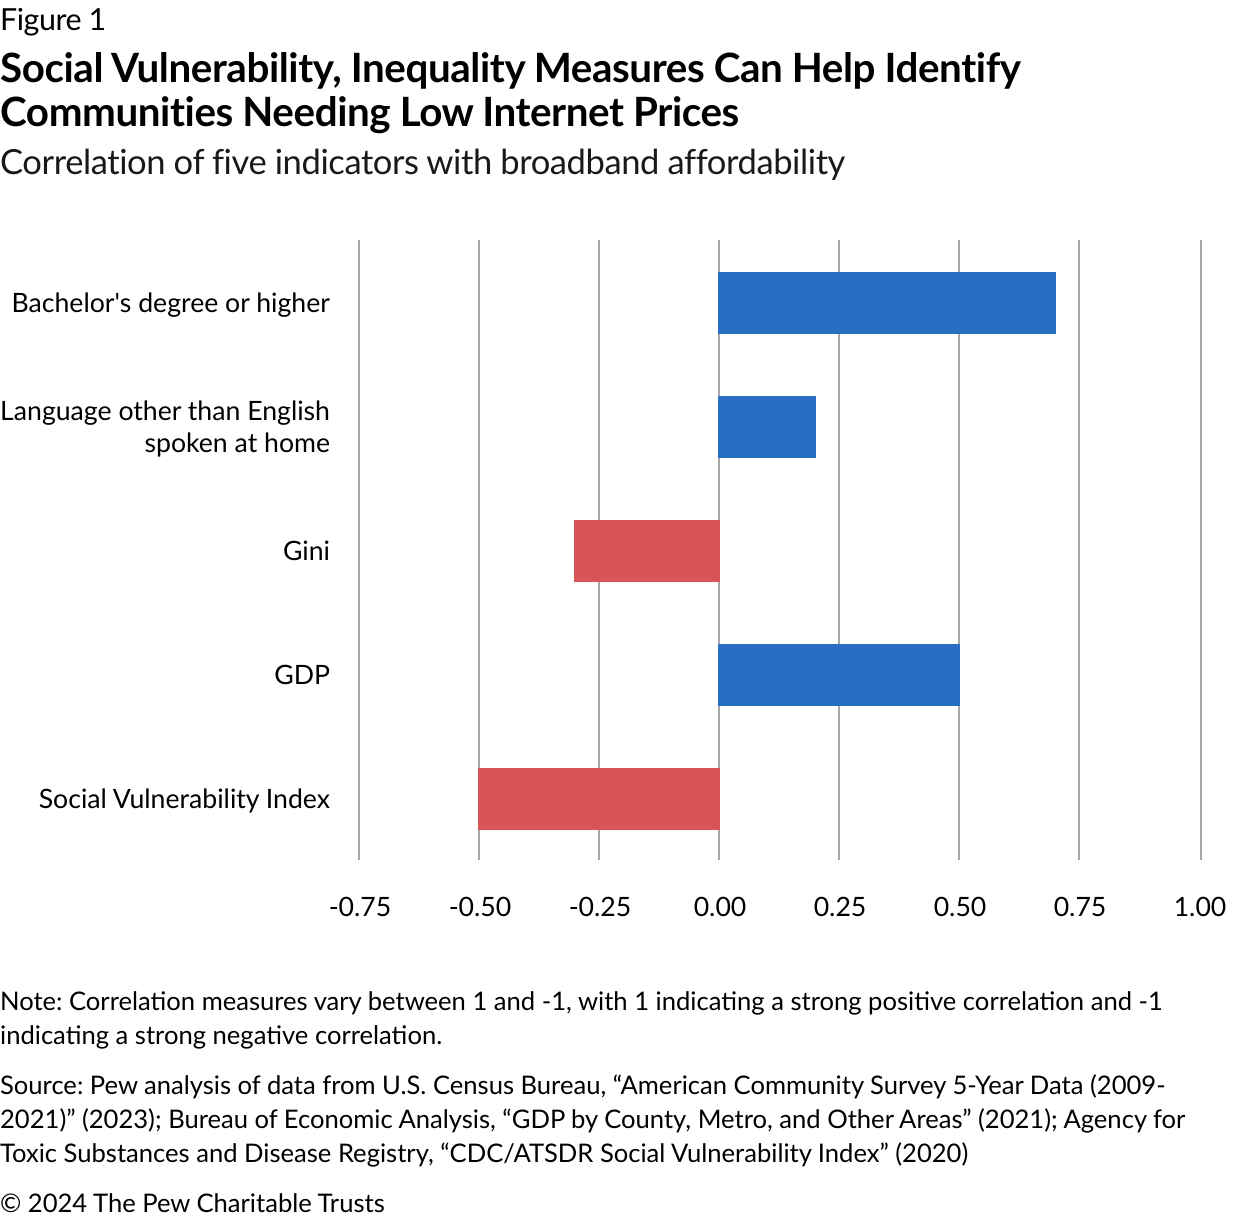
To better understand what variables are associated with local broadband affordability, Pew assessed five metrics in relation to the mean national affordability figure of $96.80. Those metrics are:
- The Centers for Disease Control and Prevention/Agency for Toxic Substances and Disease Registry’s Social Vulnerability Index (SVI), which measures the extent to which various populations exhibit “certain social conditions that … may affect that community’s ability to prevent human suffering and financial loss in the event of disaster.”
- The Gini Index, which measures income equality.
- Gross Domestic Product (GDP) for each county in the nation.
- Educational attainment, specifically the share of the population with at least a bachelor’s degree.
- Language spoken at home, particularly the share of homes in which English is not the primary language.
Together, these tools and metrics, which rely on readily available data, provide insights into the economic conditions in local communities. This analysis evaluated each factor to determine the strength of its association with broadband affordability. State broadband offices can also use these data sources to inform customized definitions of middle-class and broadband affordability for counties throughout the country.
Importantly, this analysis evaluates only whether a relationship exists between each of these measures and broadband affordability, not whether any metric causes changes in affordability. Nevertheless, identifying these relationships does highlight metrics worthy of further study to determine whether and to what extent they drive middle-class affordability.
Pew’s analysis showed that among these variables, high social vulnerability was most closely associated with a need for low broadband prices, followed by higher levels of local economic inequality. Conversely, the share of the community that holds at least a bachelor’s degree was the strongest indicator of an ability to afford higher broadband prices, followed by local GDP and having a language other than English spoken at home.
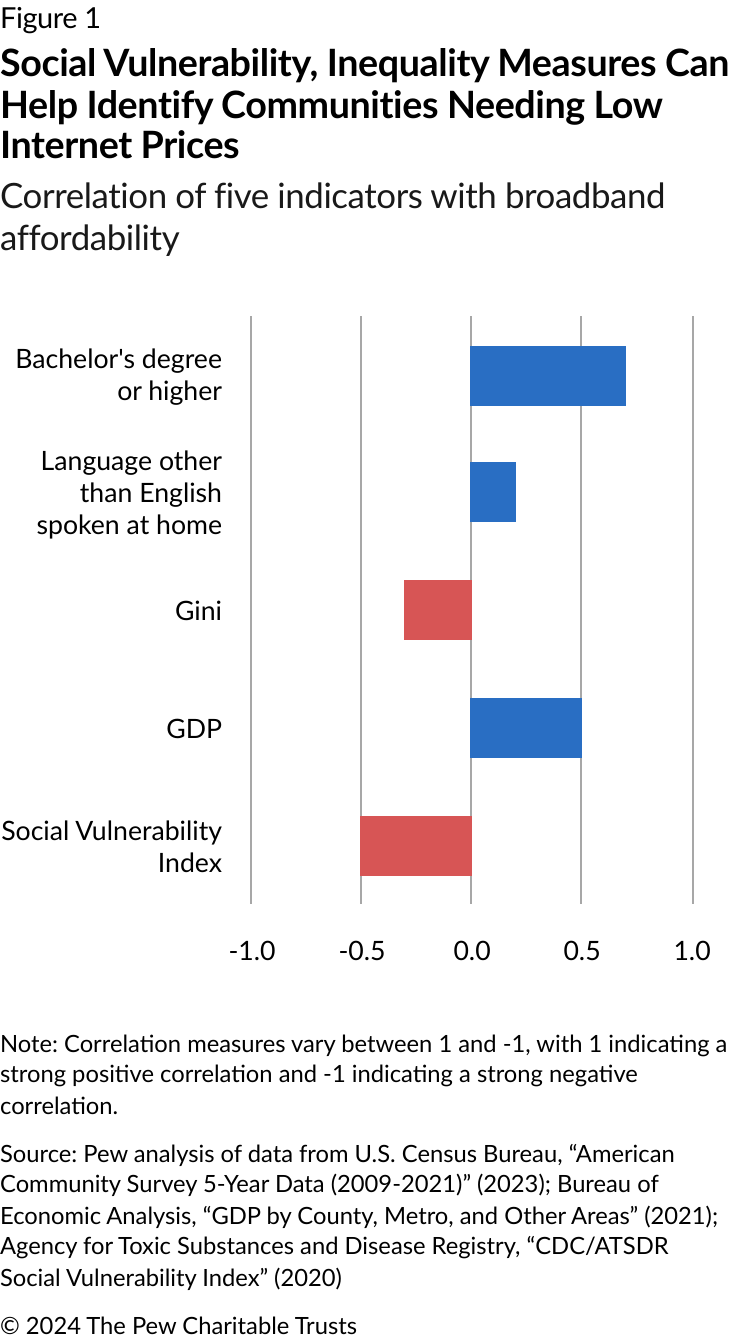
To further understand the association between these variables—particularly social vulnerability because of its strong correlation—and affordability, Pew then mapped the 2% benchmark figures for each county over the county’s SVI score. This analysis found that specific price ranges aligned closely with levels of social vulnerability and, not surprisingly, that the least vulnerable communities can afford the widest range of subscription prices.
However, the value of applying community variables is most evident when evaluating affordability for the middle class because the middle class is more variable and difficult to assess than the income extremes. Specifically, Pew’s previous analysis found that the average national affordability figure was nearly $100, and yet affordability drops to between $50 and $100 for the low end of the middle class—defined in this analysis as households with SVI scores of .30 and above. (See Figure 2.)
Pew researchers then conducted the same analysis using the Gini Index and found similar results: Residents of counties with higher levels of income inequality were less able to afford broadband than those in counties with lower inequality.
Next, Pew’s researchers estimated how these variables would be likely to increase or decrease affordable broadband pricing from the average national affordability figure of $96.80. (See Table 1.) The results suggest that inequality and social vulnerability as measured by the SVI and Gini Index are associated with lower affordability, indicating that state broadband offices should include these metrics in their middle-class affordability plans.
Table 1
Economic Metrics May Have Dramatic Effects on What Middle-Class Families Can Pay for Broadband
Estimated change in monthly affordability standard per 1 unit change in each metric, in dollars
| Estimated change in affordability | |
|---|---|
| Social vulnerability | -$31.25 |
| Inequality | -$160.73 |
| GDP (logged) | $4.46 |
| Bachelor’s degree or higher | $1.08 |
| Language other than English spoken at home | $0.39 |
| Number of counties | 3,112 |
| Source: Pew analysis of data from U.S. Census Bureau, “American Community Survey 5-Year Data (2009-2021)” (2023); Bureau of Economic Analysis, “GDP by County, Metro, and Other Areas” (2021); Agency for Toxic Substances and Disease Registry, “CDC/ATSDR Social Vulnerability Index” (2020) |
Considerations for policymakers
Pew’s analysis points to the difficulty and risks of establishing broad standards for middle-class affordability. Policymakers must consider the effect of any affordability benchmark on household budgets.
For instance, this analysis predicted that the national median affordable broadband price would be $96.63 but also that the monthly affordability standard for households earning between $30,000 and $75,000 would be roughly $50 to $125 per month. (See Figure 3.)
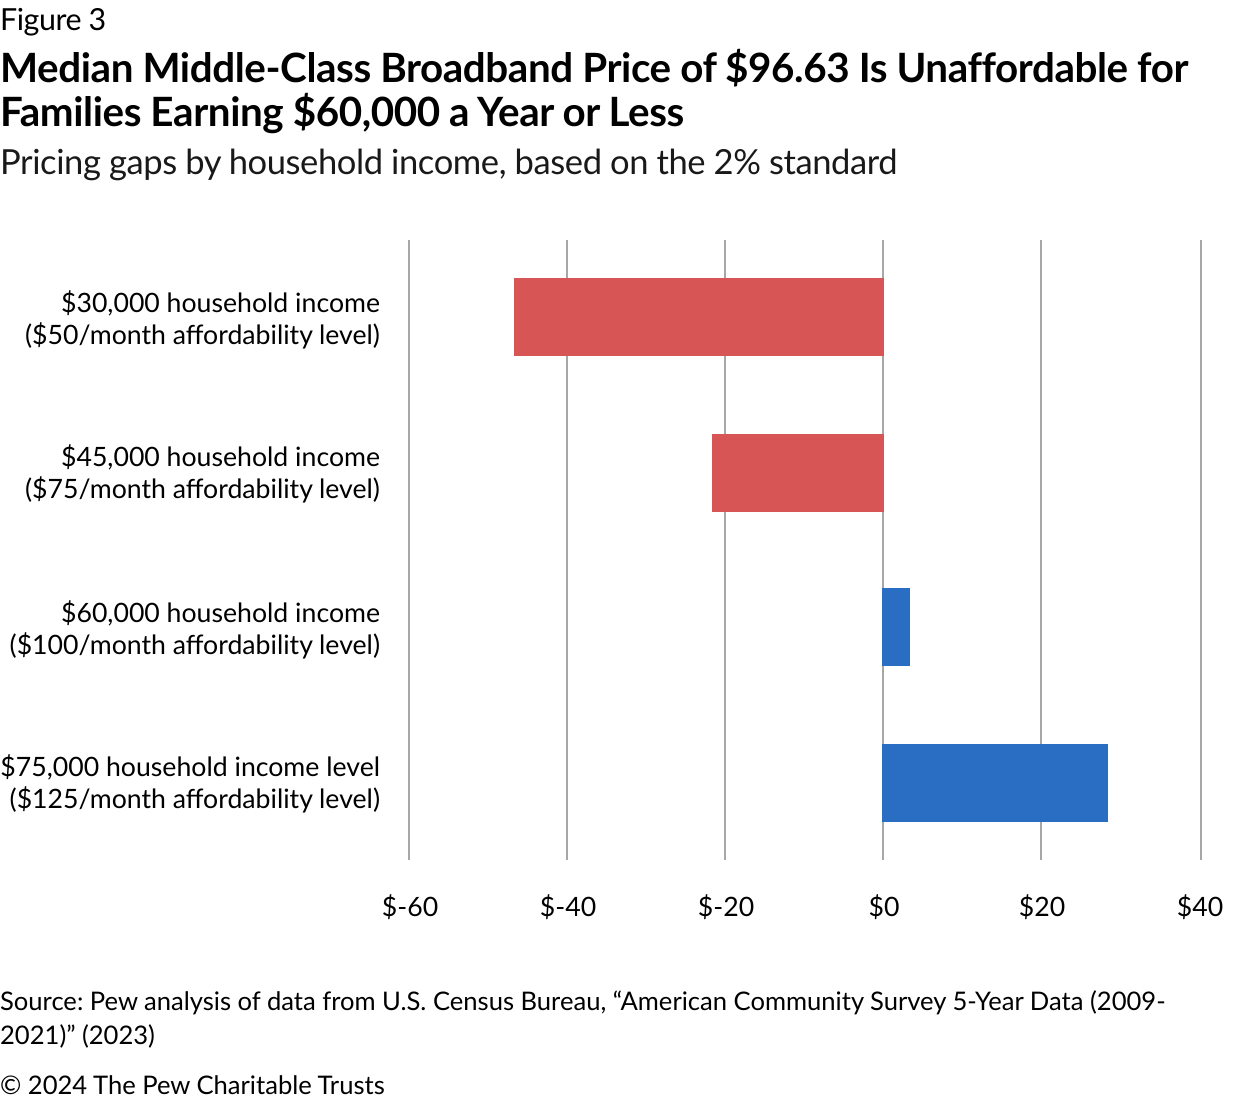
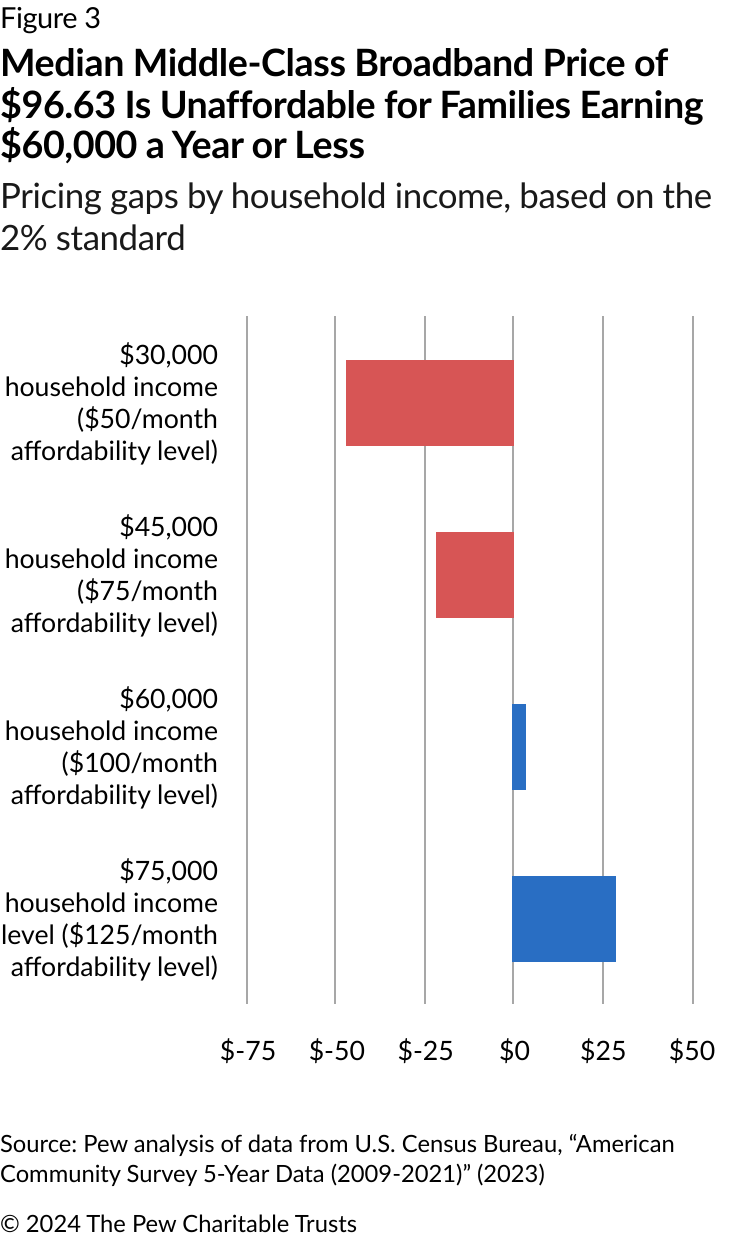
Although these estimates do not encompass the entire range of middle-class incomes, they do illustrate the prices at which the lower end of the middle class can no longer afford broadband plans, a critical point for policymakers to consider when crafting affordability policies. For example, households earning $30,000 a year see their broadband subscription budgets fall short of the $96.63 median by almost half—$46.63 per month—while those making more than $60,000 a year and up comfortably meet this standard. Absent additional factors, middle-class families with incomes of $60,000 or less appear most at risk of being unable to afford broadband.
Conclusion
The federal mandate that states ensure the availability of affordable broadband plans for middle-class families presents a number of challenges, most notably the lack of an affordability standard. Without these elements, policymakers risk excluding vulnerable populations from their middle-class affordability plans.
However, available information, including the SVI and socioeconomic data from the U.S. Census Bureau, will be valuable in assessing affordability within each state to address this challenge. This analysis highlights key metrics that policymakers should consider when examining and establishing policies for broadband affordability. For example, state broadband offices could incorporate the selected measures into their competitive grant scoring, accounting for regional variance in affordability. To ensure that BEAD-funded networks can deliver affordable internet access nationwide, states will need to develop customized solutions based on community-level data.
Appendix: Methodology
Pew’s calculations for affordability relied on the Census Bureau’s American Community Survey (ACS) 5-Year Data for 2021. Key variables included:
- Median household income.
- Note: Pew derived its monthly affordability standard from ACS figures for median household income by county. Incomes were divided by 12 to reach a monthly figure, and then multiplied by 2% to reach the FCC’s benchmark.
- Language spoken at home.
- Gini Index.
- Educational attainment.
Additional data sets included GDP measures by county from the Bureau of Economic Analysis and the Centers for Disease Control and Prevention/Agency for Toxic Substances and Disease Registry’s Social Vulnerability Index.
Table A.1
National Broadband Affordability Measures Compared With County Characteristics
Lowest, average, and highest national values for various broadband and community metrics
| Mean | Min | Max | |
|---|---|---|---|
| Monthly affordability standard (2% benchmark) | $96.80 | $28.50 | $261.40 |
| Social Vulnerability Index (0 to 1) | 0.5 | 0 | 1 |
| Gini Index (0 to 1) | 0.4 | 0.2 | 0.7 |
| GDP (in thousands of dollars) | $6,233,345 | $11,677 | $711,874,201 |
| Bachelor’s degree or higher (percent of population) | 22.9% | 0.0% | 76.3% |
| Language other than English spoken at home (percent of population) | 9.5% | 0.2% | 92.3% |
| N (U.S. counties) | 3,112 | ||
| Source: Pew analysis of data from U.S. Census Bureau, “American Community Survey 5-Year Data (2009-2021)” (2023); Bureau of Economic Analysis, “GDP by County, Metro, and Other Areas” (2021); Agency for Toxic Substances and Disease Registry, “CDC/ATSDR Social Vulnerability Index” (2020) |
Research indicates that broadband adoption also correlates with education, English proficiency, and income levels. Supplemental data for each county was collected from the ACS on the percentage of the population from each county maintaining a bachelor’s degree or higher, those speaking a language other than English at home, and the Gini Index (a summary measure of income equality ranging from 0 to 1, with 0 being perfect equality and 1 representing perfect inequality). Each county's gross domestic product (GDP) was also pulled from the Bureau of Economic Analysis.
The SVI relies on 16 variables from the Census Bureau’s American Community Survey related to socioeconomic status, household characteristics, racial and ethnic minority status, and housing and transportation. This index ranges from 0 to 1, with higher values corresponding to greater social vulnerability.

ADDITIONAL RESOURCES


