The Long-Term Decline in Fertility—and What It Means for State Budgets
States with low birth rates and shrinking populations face fiscal risks
Overview
When the economy takes a downward turn, couples often temporarily put off having children.1 But in the years following the Great Recession, births never rebounded. Instead, fertility has largely continued to follow a downward trajectory across the country, falling to a record low in 2020.2 State budgets have started to feel the effects of this long-term decline. The future course of fertility represents a key source of fiscal uncertainty for states as smaller working-age populations may eventually threaten tax bases.
Fertility is one of several demographic pressures states are experiencing: In addition to recent declines in international migration and life expectancy, the broader aging of the population and the large-scale exit of Baby Boomers from the workforce will pose challenges to states over the long term.3 Total U.S. population growth hit a record low last year as the pandemic exacerbated some of these issues.4
This brief examines the historic decline in fertility and its wide-ranging potential effects on state budgets. Fewer births could yield cost savings: Many school districts are experiencing drops in enrollment and a sharp reduction in teenage pregnancies has already helped limit growth in health expenditures.5 In the coming decades, however, governments may face resource challenges, with a smaller pool of workers likely suppressing income, sales, and other tax revenue sources.
The Pew Charitable Trusts analyzed the most recent Centers for Disease Control and Prevention data and reviewed a cross-section of state budget reports detailing projected population trends and their fiscal effects. Among the key findings:
- Forty-three states recorded their lowest general fertility rate, which represents annual births per 1,000 women aged 15-44, in at least three decades in 2020.
- Every state except for North Dakota experienced losses when the most recently published 2020 rates are compared to averages over the decade ending in 2010.
- The severity of the declines over the past decade varies greatly, with Western states generally experiencing the most severe fertility rate drops. Arizona’s and Utah’s declines were more than double that of the 50-state average.
- States are already feeling some effects of low fertility, such as lower school enrollment, but many of the most significant potential hits to tax revenues won’t occur for decades.
- Some states are more vulnerable to potential budget pressures than others because of their tax structures, economies, and ability to attract working-age residents via migration.
Fertility’s steady decline
Changing societal norms and other factors have reshaped recent generations of American families. Following the baby boom from 1946 to 1964, birth rates plummeted through the early 1970s, then fluctuated little in succeeding decades. The Great Recession marked another turning point; fertility had slowly climbed in the years leading up to 2008 before tumbling.6 It has mostly continued to fall since then, with the latest available data covering 2020—and reflecting children conceived prior to the pandemic—showing 43 states recorded their lowest general fertility rate in at least three decades.7
General Fertility Rates Decline Across States
The United States recorded a rate of 56 births per 1,000 women in 2020
Line chart showing the general fertility rate for the 50 states, the District of Columbia, and the United States as a whole. All show a downward trend from 1990 to 2020. The maximum is 95.7 (Utah, 2007); the minimum is 44.7 (Vermont, 2020). The national rate was 70.9 in 1990 and 56 in 2020.
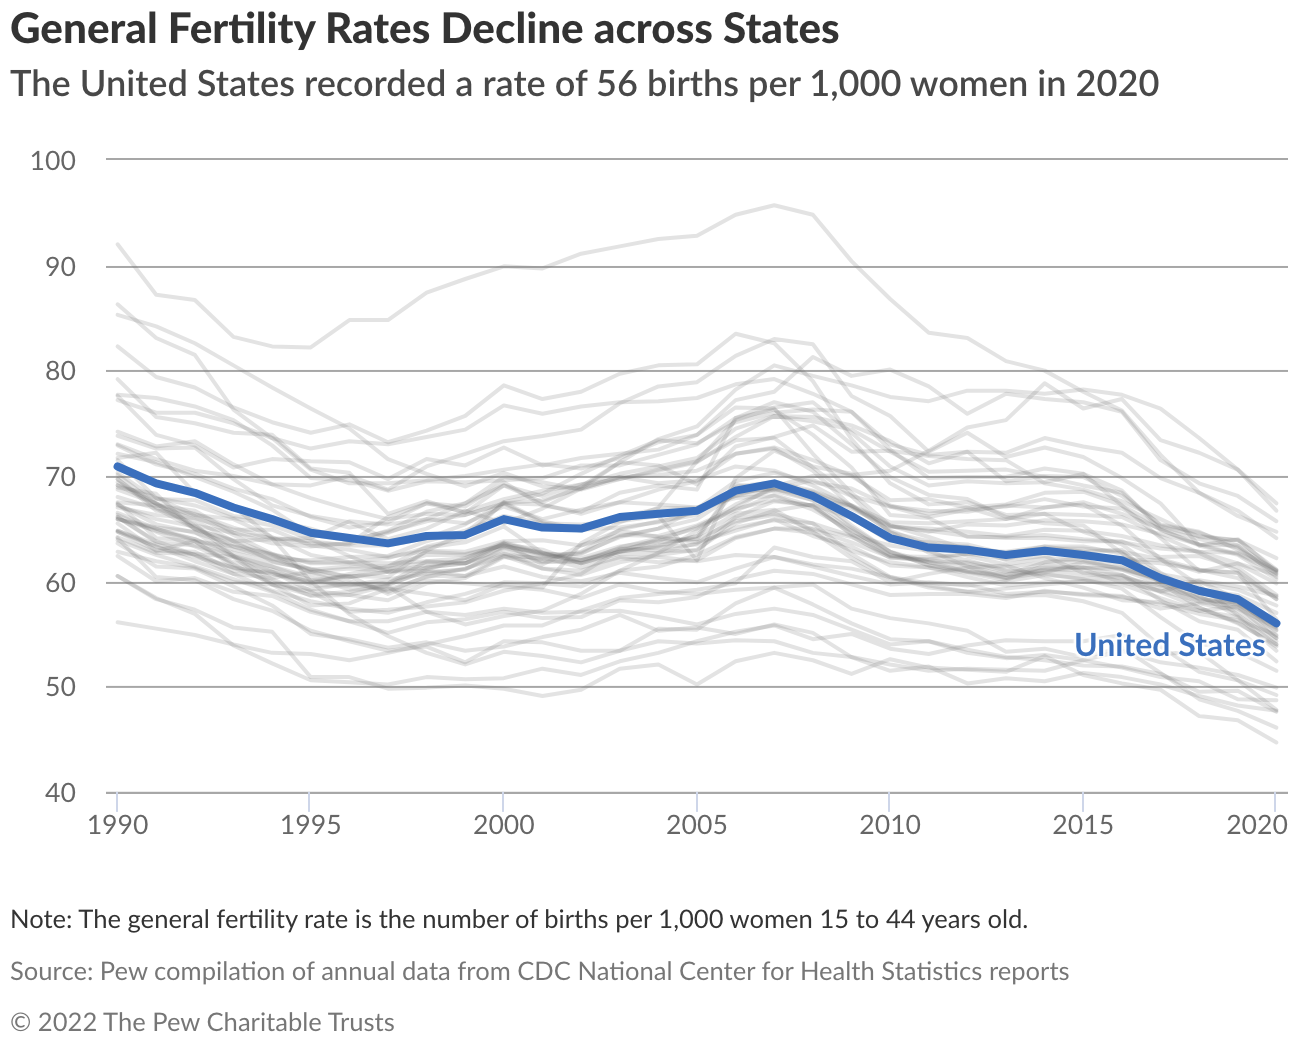
Note: The general fertility rate is the number of births per 1,000 women 15 to 44 years old.
Source: Pew compilation of annual data from CDC National Center for Health Statistics reports
© 2022 The Pew Charitable Trusts
To study how rates have changed in recent years, Pew compared each state’s 2020 general fertility rate (calculated by the Centers for Disease Control and Prevention) to that state’s average rate between 2001 to 2010. By using an average as the baseline, the results are less influenced by temporary fluctuations.
In 2020, the national general fertility rate was down 15.9% from its average over the decade ending in 2010, with 10 states experiencing reductions exceeding 20%. Mostly Western states led the way in incurring the most dramatic long-term fertility rate declines, despite often experiencing strong population gains overall, due largely to migration.
Demographics play an important role in driving states’ fertility declines. Many of the states with the sharpest fertility rate reductions have high concentrations of Hispanics, a group that experienced a particularly noticeable drop-off in fertility.8
Fertility among Hispanics has historically far exceeded that of non-Hispanics, which is primarily attributable to factors related to immigrant women.9 In recent years, however, Hispanic fertility has fallen nationwide to levels more in line with other groups. A drop-off in immigration from Mexico played a major role in this drop as fertility for native-born Hispanics also decreased.10 Domestic migration and immigration from abroad influence states’ overall birth trends.11
In Arizona, for example, the general fertility rate was down 31% from its 2001-2010 annual average, the largest overall reduction nationally. And among the state’s large Hispanic population, it dropped nearly 50% from pre-Great Recession levels, exceeding nearly all other states’ declines for Hispanic women.12 The bursting of the housing bubble and subsequent recession also hit Arizona’s economy especially hard, further deterring births.13
Nationwide, teenage fertility rates have also fallen by more than half from a decade ago, pushing down overall fertility rates.14 A Pew Research Center report cited greater awareness about (and use of) effective contraception, an increase in the number of teenagers who report never having had sex, and the Great Recession as factors.15 For example, Colorado—another state with one of the largest overall declines—experienced an especially sharp reduction in teenage births from its average over the decade ending in 2010. The state reported that a major investment in expanding access to long-acting reversible contraceptives, as well as operational support for family planning services, helped drive the decrease.16 In addition to the reduction in teen births, the State Demography Office has attributed Colorado’s overall drop in fertility to high unemployment during the Great Recession, a slowdown in international migration to the state, and women delaying childbirth to pursue education.17
A litany of other socioeconomic factors further explains the changing makeup of American families. In a recent Journal of Economic Perspectives article, researchers speculated that lower fertility rates reflected “broad societal changes that are hard to measure or quantify.”18
Among the cultural shifts affecting fertility rates, one of the more prominent changes has been Americans delaying or forgoing marriage. Women are marrying later in life, and birth rates for single women are less than half that of those who are married.19 Women are also delaying having children until later in life—part of the reason why fertility rates have dropped among women in their 20s, which has more than offset increases for women in their late 30s and 40s.20 A recent analysis by the Brookings Institution projected that for young women today, the average number of children they have over their lifetimes would fall compared with the average number for women in prior generations.21 A recent Pew Research Center survey found an increasing share of U.S. adults without children reporting they were unlikely to ever have children.22
After Arizona, states experiencing the largest fertility rate reductions from their 2001-2010 averages include Utah (-30.4%), Colorado (-25.1%), New Mexico (-25%), and Oregon and California (-24.6% each).23

It’s worth noting that many states with the largest declines still maintained relatively strong overall population growth because of migration. The total number of births statewide similarly didn’t decline nearly as sharply as the general fertility rate in Nevada, Utah, and some other states that women of childbearing age are moving to.
The lone state with fertility rates above where they were a decade ago was North Dakota, where improved economic conditions resulting from an oil boom helped to increase the birth rate.24 But its rate, too, has started to tick down more recently.
In 2020, North Dakota, South Dakota, and Alaska recorded the highest annual fertility rates. Conversely, Northeastern states reported the lowest fertility levels, as has historically been the case.
More recent provisional figures published by the CDC for 2021 showed a slight uptick in the national fertility rate—the first in seven years.25 However, the annual increase was a mere 1%, while total births were still lower than any other year since 1983.26 Officials said births rose throughout the year, reflecting families who postponed having children earlier in the pandemic.27
How low fertility will influence budgets
Although many of fertility’s short-term fiscal effects—such as reducing the cost of education and children’s health care—should be positive for state balance sheets, in the longer term the decline could lead to a decrease in major revenue streams, mirroring reductions in the labor force.28 In fact, ratings agencies, which take states’ demographics into account when establishing credit ratings, have cited slow population growth in ratings downgrades.29
In their recent budget proposals or revenue forecasts, several states noted declining fertility. California Governor Gavin Newsom’s fiscal 2023 budget proposal, for instance, called out the combination of early retirements that have taken place during the pandemic and lower fertility and migration rates: “With rising cost of living and an already tight housing market, it could become increasingly difficult for the remaining working-age Californians to support the aging population.”30
The following section assesses the potential effects of low fertility on different areas of revenue and spending, independent of other demographic trends and any policy responses.
Revenue
Low fertility is likely to affect several major revenue streams in the coming decades. Just how susceptible states’ revenues are to low fertility varies based on their tax structures; states more dependent on individual income taxes generally face greater risks than those that generate substantial revenue from sources—such as severance taxes levied on the extraction of natural resources and corporate income taxes—that are less affected by population growth.31
States that experience an influx of new residents from other states or abroad are better positioned to preserve their tax bases than those who are losing residents. For example, in a report issued in 2019, the Montana Legislative Fiscal Division report noted that the state may eventually need workers to move there to fill entry-level jobs.32
Today, low fertility is boosting labor force participation among women, supporting greater state income tax collections.33 However, because women are having fewer children than women in previous years, eventually there could be fewer workers paying income taxes. Colorado’s economic and fiscal outlook published in March, for example, projected that low birth rates would begin to affect the state’s labor force in five to six years.34 How much income taxes decline over the long term as a result will depend, in part, on how well employers are able to fill positions that are typically held by younger workers or vacated by retirees.
A paper published by the Federal Reserve Bank of Kansas City in late 2013 estimated that projected demographic changes from 2011 to 2030, which also reflect aging populations, would collectively reduce per capita state individual income tax revenue by 2.4% nationally, with the effects on future sales tax collections projected to be less severe.35
But sales tax reductions as a consequence of reduced fertility still pose a long-term risk in states that rely heavily on sales taxes, which account for nearly half of states’ total tax revenue.36 In fiscal 2020, sales taxes accounted for at least three-quarters of all tax revenue in Florida, Nevada, South Dakota, Tennessee, Texas, and Washington, according to Census Bureau data.37
In any case, the greatest effects of low fertility won’t be felt for several decades, when today’s children reach an age that they’ll be spending more and paying significant income taxes.38
In addition to leading to a possible decline in tax revenue, the drop in fertility could reduce states’ federal funding. Several major federal programs—including Title I grants and other education programs, the Children’s Health Insurance Program, and Head Start39—allocate money to states according to formulas that incorporate population counts. Fortunately for most states, these federal dollars are distributed proportionately, so the fact that fertility is relatively low everywhere should mitigate states’ losses. Those states with greater declines in their birth rates, though, may see their funding reduced disproportionately to other states.
Trends in fertility will also influence property taxes, a major source of revenue for many school districts and local governments. The Vermont Legislature’s Tax Structure Commission expects a trend toward smaller households to also lower the assessed values of larger homes, reducing property tax revenue funding for education.40 Officials in the state—which has had the nation’s lowest fertility rate for the past several years—have explored ways to address the issue. In May, lawmakers passed a child tax credit aimed in part at making it more affordable to start a family.41
Spending
On the spending side, fewer children should yield states near-term cost savings in several areas, especially education and health care.
For education, states typically allocate money to school districts, at least in part based on enrollment.42 In Minnesota, for example, expected declines in enrollment led the state to cut its February budget forecast for its main category of general fund education expenditures by 2.3% from prior end-of-session projections.43
Enrollment across most states is expected to drop. Recent projections published by the National Center for Education Statistics show total U.S. public elementary and secondary school enrollment will fall 4.4% from 2021 to 2030, partially because of lower fertility.44 States with the top projected public school enrollment declines include West Virginia (-19.9%), Mississippi (-17.5%), New Mexico (-16.8%), New Hampshire (-14.9%), and Vermont (-11.2%).45 On the flip side, falling enrollment means that school districts will receive less money from the federal and state governments. Although having fewer students will also lower some costs, many of a school district’s expenses are fixed—so funding cuts resulting from enrollment declines could pose financial hurdles.46
Source: U.S. Department of Education, National Center for Education Statistics, 2022 Digest of Education Statistics, Table 203.20
Low fertility since the Great Recession could similarly help to limit college enrollment costs in the coming decades.47 Higher education accounted for nearly 9% of total state government expenditures in fiscal 2021 and serves as a critical economic driver for college towns.48
Another major line item in state budgets benefitting from low fertility is health spending, particularly Medicaid and Children’s Health Insurance Program costs. Medicaid alone accounts for more than a quarter of total state government spending.49 Fewer births will help limit these costs, although states’ savings will likely be greatly offset by much higher expenses stemming from the country’s aging population.
In particular, drastic reductions in teenage pregnancies in recent decades have especially helped limit costs because teen mothers rely on publicly funded health care more than non-teenage mothers.50 About 78% of teenagers who gave birth in 2020 financed their deliveries via Medicaid, nearly twice the rate of mothers age 20 and older, for example.51 And several other public programs—including Temporary Assistance for Needy Families (TANF), the Supplemental Nutrition Assistance Program, and housing assistance—also serve a higher proportion of teenage mothers and their children than nonteenage mothers. Additionally, teen mothers are more than twice as likely as older parents to have their children placed in foster care, and boys born to teenage mothers are similarly more than twice as likely to end up in prison.52 One study estimated that prison costs nationwide would drop by $5.3 billion annually if the incarceration rate for sons of teen mothers matched that of the sons of women who gave birth in their early 20s.53
Revenue and spending caps
Some states have adopted tax and expenditure limits (TELs) prohibiting annual revenue or spending from exceeding caps set by formulas. TEL formulas frequently incorporate population figures as well as inflation, and other economic measures.54 When fewer babies are born, revenue or spending limits for states with population-based formulas are effectively lower than they would have otherwise been.
One of the more prominent TELs is Colorado’s Taxpayer’s Bill of Rights (TABOR). The TABOR amendment of the state constitution limits most sources of government revenue from exceeding the percentage change in the state population for the prior year plus the Denver metro area’s inflation rate.55 A recent forecast published by the Governor’s Office of State Planning and Budgeting noted population growth was slowing largely because of declining birth rates, lowering the state’s allowable revenue stipulated by TABOR.56
Uncertainty ahead for state budgets
In the coming years, the degree to which the fertility rate reshapes state budgets will hinge on multiple issues affecting the total population. Several states’ total populations were already declining prior to the pandemic, and a third of states lost residents last year.57
If there’s an X-factor in determining states’ future demographics, it’s migration. States can overcome reduced fertility levels by attracting residents from other states or abroad to boost their overall populations and add to their tax base. For instance, last year, deaths exceeded births in half of states, but migration easily offset the losses in states such as South Carolina and Tennessee.58 States are also contending with additional costs from increasing populations of older adults as well as Baby Boomers exiting the workforce. Although birth rates started falling around the beginning of the Great Recession, changes in the population of children since then pale in comparison to the rapidly growing number of Americans in their 60s and 70s. The aging of the population could further limit revenue growth and add to fiscal uncertainty, as discussed in a previous report commissioned by Pew.59

Future trends in fertility are difficult for states to project. Oregon, for example, in 2020 estimated its deaths wouldn’t exceed births until after 2025, but now reports that the inversion already occurred as a result of the pandemic.60 There’s also much uncertainty around how, over the long term, low fertility rates will influence labor force productivity, women in the workforce, and other issues.
Conclusion
The historic decline in fertility will touch nearly every area of state budgets in the coming years. Some fiscal effects have already emerged, while others will be relatively minor or won’t be felt for decades. The implications for individual states vary: Those with shrinking workforces that rely more than other states on taxes sensitive to population declines—such as income and sales taxes—are especially vulnerable to budget pressures. Other demographic shifts such as migration will also affect many sources of revenue and spending.
Today, most states find themselves in a relatively healthy fiscal position, with many enjoying robust budget surpluses.61 Fewer births in recent years have contributed appreciable cost savings. If low fertility persists, however, states will need to look more for other ways to grow their tax bases or they could face challenges over the long term.
Methodology
References to the fertility rate in this report refer to the general fertility rate, or number of births per 1,000 women ages 15 to 44. The most recent state-level rates published by the Centers for Disease Control and Prevention’s National Center for Health Statistics cover 2020. Rates for 2020 were compared to each state’s average annual rate from 2001 to 2010, compiled from annual reports and tables provided by CDC. While the general fertility rate is not influenced by the size of the total population, it is affected by fluctuations in the age distribution of women in their childbearing years. It is one of several measures states frequently use in tracking fertility trends.
Additional demographic trends affecting the total population, such as migration and life expectancy, should also be considered in any assessment of a state’s long-term fiscal outlook.
Endnotes
- A. Linn, “Weak Economy Means Fewer Babies (at Least for Now),” USA Today, July 9, 2013, https://www.today.com/money/weak-economy-means-fewer-babies-least-now-6c10471907; A. Morse, “Stable Fertility Rates 1990-2019 Mask Distinct Variations by Age,” U.S. Census Bureau, accessed June 15, 2022, https://www.census.gov/library/stories/2022/04/fertility-rates-declined-for-younger-women-increased-for-older-women.html; A.H. Munnell, A. Chen, and G.T. Sanzenbacher, “Is the Drop in Fertility Temporary or Permanent?” (Center for Retirement Research at Boston College, 2018), https://crr.bc.edu/briefs/is-the-drop-in-fertility-temporary-or-permanent/.
- M.J.K. Osterman et al., “Births: Final Data for 2020” (National Center for Health Statistics, 2022), https://dx.doi.org/10.15620/cdc:112078.
- J. Schachter, P. Borsella, and A. Knapp, “New Population Estimates Show COVID-19 Pandemic Significantly Disrupted MigrationAcross Borders,” U.S Census Bureau, accessed June 13, 2022, https://www.census.gov/library/stories/2021/12/net-international-migration-at-lowest-levels-in-decades.html.
- L. Rogers, “COVID-19, Declining Birth Rates and International Migration Resulted in Historically Small Population Gains,” U.S. Census Bureau, accessed June 14, 2022, https://www.census.gov/library/stories/2021/12/us-population-grew-in-2021-slowest-rate-since-founding-of-the-nation.html.
- National Center for Education Statistics, “Enrollment in Public Elementary and Secondary Schools, by Region, State, and Jurisdiction: Selected Years, Fall 1990 through Fall 2030,” Digest of Education Statistics, accessed Sept. 1, 2022, https://nces.ed.gov/programs/digest/d22/tables/dt22_203.20.asp; Power to Decide, “Progress Pays Off” (2018), https://powertodecide.org/sites/default/files/media/savings-fact-sheet-national.pdf.
- Morse, “Stable Fertility Rates 1990-2019.”
- Historical figures were compiled from annual National Vital Statistics Reports and tables provided by the Centers for Disease Control and Prevention.
- National Center for Health Statistics, CDC WONDER Online Database: Natality, accessed May 30, 2022, http://wonder.cdc.gov/natality-current.html; U.S. Census Bureau, Annual Estimates of the Resident Population by Sex, Race, and Hispanic Origin: April 1, 2010 to July 1, 2019, accessed July 20, 2022, https://www.census.gov/data/tables/time-series/demo/popest/2010s-state-detail.html.
- E.A. Parrado, “How High Is Hispanic/Mexican Fertility in the United States? Immigration and Tempo Considerations,” Demography 48, no. 3 (2011): 1059-80, http://www.jstor.org/stable/41237824.
- G. Livingston, “Hispanic Women No Longer Account for the Majority of Immigrant Births in the U.S.” (the Pew Research Center, 2019), https://www.pewresearch.org/fact-tank/2019/08/08/hispanic-women-no-longer-account-for-the-majority-of-immigrant-births-in-the-u-s/.
- State of Washington Office of Financial Management, “Forecast of the State Population” (2021), https://ofm.wa.gov/washington-data-research/population-demographics/population-forecasts-and-projections/state-population-forecast.
- National Center for Health Statistics, CDC WONDER Online Database: Natality - Mother’s Hispanic Origin, 2007-2020, accessed June 27, 2022, https://wonder.cdc.gov/natality-current.html, https://wonder.cdc.gov/controller/saved/D66/D295F356.
- S. Pringle, “Arizona Continues Trend of Fewer Babies, in Part Because of Bad Economy,” Cronkite News, Oct. 11, 2012, https://cronkitenewsonline.com/2012/10/arizona-continues-trend-of-fewer-babies-in-part-because-of-bad-economy/index.html.
- B.E. Hamilton, J.A. Martin, and M.J.K. Osterman, “Births: Provisional Data for 2021” (National Center for Health Statistics, 2022), https://www.cdc.gov/nchs/data/vsrr/vsrr020.pdf; National Center for Health Statistics, CDC WONDER Online Database: Natality.
- G. Livingston and D. Thomas, “Why Is the Teen Birth Rate Falling?” (the Pew Research Center, 2019), https://www.pewresearch.org/fact-tank/2019/08/02/why-is-the-teen-birth-rate-falling/.
- Colorado Department of Public Health and Environment, “Taking the Unintended out of Pregnancy: Colorado’s Success With Long-Acting Reversible Contraception” (2017), https://cdphe.colorado.gov/fpp/about-us/colorados-success-long-acting-reversible-contraception-larc#:~:text=Births%20to%20women%20without%20a,1.2%20years%20among%20all%20women.
- C. DeGroen, “Colorado Fertility: Recent Trends and Expectations of Change” (Colorado State Demography Office, 2017), https://drive.google.com/file/d/1LNYxEeHfjbPMMYBLik7-gHx_IgS-ybnu/view.
- M.S. Kearney, P.B. Levine, and L. Pardue, “The Puzzle of Falling U.S. Birth Rates since the Great Recession,” Journal of Economic Perspectives 36, no. 1 (2022): 151-76, https://www.aeaweb.org/articles?id=10.1257/jep.36.1.151.
- Osterman et al., “Births: Final Data for 2020”; U.S. Census Bureau, “Median Age at First Marriage: 1890 to Present” (2021), https://www.census.gov/content/dam/Census/library/visualizations/time-series/demo/families-and-households/ms-2.pdf.
- Morse, “Stable Fertility Rates 1990-2019”; Osterman et al., “Births: Final Data for 2020.”
- M.S. Kearney and P. Levine, “Will Births in the U.S. Rebound? Probably Not.,” Brookings Institution, May 24, 2021, https://www.brookings.edu/blog/up-front/2021/05/24/will-births-in-the-us-rebound-probably-not/.
- A. Brown, “Growing Share of Childless Adults in U.S. Don’t Expect to Ever Have Children” (the Pew Research Center, 2021), https://www.pewresearch.org/fact-tank/2021/11/19/growing-share-of-childless-adults-in-u-s-dont-expect-to-ever-have-children/.
- National Center for Health Statistics, CDC WONDER Online Database: Natality.
- A.L. Owen, “The Fracking Boom, Labor Structure, and Adolescent Fertility,” Population Research and Policy Review (2022), https://doi.org/10.1007/s11113-022-09722-6; P. Springer, “N.D. Baby Boom: State Records 10,000 Birth for First Time in Almost 25 Years,” INFORUM, Jan. 11, 2014, https://www.inforum.com/newsmd/nd-baby-boom-state-records-10-000-birth-for-first-time-in-almost-25-years.
- Hamilton, Martin, and Osterman, “Births: Provisional Data for 2021.”
- Ibid.; J.A. Martin et al., “Births: Final Data for 2015” (National Center for Health Statistics, 2017), https://www.cdc.gov/nchs/data/nvsr/nvsr66/nvsr66_01.pdf; Osterman et al., “Births: Final Data for 2020”; U.S. Census Bureau, “Live Births, Birth Rates, and Fertility Rates, by Race: United States, 1909-2003” (https://www.cdc.gov/nchs/data/statab/natfinal2003.annvol1_01.pdf.
- M. Stobbe, “U.S. Births Rose Last Year but Still Less Than Before Pandemic,” Associated Press, May 24, 2022, https://apnews.com/article/covid-science-health-pandemics-a19eb76d3c0b6077a7c2d1ae92a4a67f.
- D. Brighton, S. Trenholm, and B. Kleppner, “Final Report of the Vermont Tax Structure Commission” (2021), https://ljfo.vermont.gov/assets/Subjects/Final-Report/10306868b9/TSC-Final-Report-2-8-2021.pdf; R. Eischens, “State Education Spending Projections Down $326 Million in New Budget Forecast,” Minnesota Reformer, Dec. 7, 2021, https://minnesotareformer.com/2021/12/07/state-education-spending-projections-down-326-million-in-new-budget-forecast/.
- Fitch Ratings, “Fitch Downgrades State of Connecticut Rating to ‘A+’; Outlook Stable,” accessed June 21, 2022, https://www.fitchratings.com/research/us-public-finance/fitch-downgrades-state-of-connecticut-rating-to-a-outlook-stable-12-05-2017.
- State of California, Governor’s Budget Summary, (2022), https://www.ebudget.ca.gov/2022-23/pdf/BudgetSummary/FullBudgetSummary.pdf.
- D. Boyd, “Demographics, Aging, and State Taxes” (State and Local Government Finance Project, Rockefeller College, SUNY Albany, 2019), https://www.pewtrusts.org/-/media/assets/2020/01/demographics_aging_and_state_taxes.pdf.
- J. Poulette and A. Hecht, “Montana’s Changing Demographics” (Montana Legislative Fiscal Division, 2019), https://leg.mt.gov/content/Publications/fiscal/2021-Interim/Jan-2020/Demographic-Report-FINAL.pdf.
- F. Yang, “Policy Changes Could Boost Women’s Participation in U.S. Workforce,” Federal Reserve Bank of Dallas, accessed July 25, 2022, https://www.dallasfed.org/research/swe/2020/swe2001/swe2001d.aspx.
- Colorado Governor’s Office of State Planning and Budgeting, Colorado Economic and Fiscal Outlook - March 2022, (2022), https://drive.google.com/file/d/1oHD5MwhImciWoCUV6cX5o5v5huy7G9YN/view.
- A. Felix and K. Watkins, “The Impact of an Aging U.S. Population on State Tax Revenues,” Economic Review, Federal Reserve Bank of Kansas City (2013): 95-127, https://ideas.repec.org/a/fip/fedker/00002.html.
- The Pew Charitable Trusts, “How States Raise Their Tax Dollars: FY 2020,” accessed June 21, 2022, https://www.pewtrusts.org/en/research-and-analysis/data-visualizations/2021/how-states-raise-their-tax-dollars-fy2020.
- Ibid.
- Boyd, “Demographics, Aging, and State Taxes.”
- For more examples of federal programs, see: Federal Funds Information for States, “2010 Census: Impact on Federal Grant Allocations” (2010), https://ffis.org/PUBS/special-analysis/10/1.
- Brighton, Trenholm, and Kleppner, “Final Report of the Vermont Tax Structure Commission.”
- Act 138, H.510, Vermont General Assembly (2022), https://legislature.vermont.gov/bill/status/2022/H.510; L. Duffort, “Vermont House Gives Tentative Green Light to $1,200 Child Tax Credit,” VTDigger, Feb. 8, 2022, https://vtdigger.org/2022/02/08/vermont-house-gives-tentative-green-light-to-1200-child-tax-credit/.
- A. Fischer, C. Duncombe, and E. Syverson, “50-State Comparison: K-12 and Special Education Funding,” Education Commission of the States, accessed June 22, 2022, https://www.ecs.org/50-state-comparison-k-12-and-special-education-funding/.
- Pew calculations comparing end-of-session projections and February 2022 estimates. Minnesota Management and Budget, Budget & Economic Forecast: November 2021, (2021), https://mn.gov/mmb-stat/000/az/forecast/2021/budget-and-economic-forecast/november-2021-forecast.pdf; Minnesota Management and Budget, Budget & Economic Forecast: February 2022, (2022), https://mn.gov/mmb-stat/000/az/forecast/2022/budget-and-economic-forecast/february-2022-forecast.pdf.
- Minnesota Management and Budget, Budget & Economic Forecast: February 2022; National Center for Education Statistics, “Enrollment in Public Elementary and Secondary Schools”; Western Interstate Commission for Higher Education, “High School Graduate Trends: A Glimpse of the Future Before COVID-19 Intervened,” accessed July 19, 2022, https://knocking.wiche.edu/report/.
- National Center for Education Statistics, “Enrollment in Public Elementary and Secondary Schools.”
- D. Walters, “Opinion: Enrollment Declines Squeeze Local School Finances in California,” Times of San Diego, Dec. 18, 2021, https://timesofsandiego.com/opinion/2021/12/18/opinion-enrollment-declines-squeeze-local-school-finances-in-california/.
- J. Marcus, “Declining Birthrate Means Hard Times Ahead for Colleges,” The Washington Post, May 22, 2021, https://www.washingtonpost.com/local/education/college-enrollment-birthrate-decline/2021/05/21/52d7e5a6-ba47-11eb-a5fe-bb49dc89a248_story.html.
- Breckinridge Capital Advisors, “College Towns Provide Economic Resilience,” accessed Sept. 21, 2022, https://www.breckinridge.com/insights/details/college-towns-provide-economic-resilience/; National Association of State Budget Officers, “State Expenditure Report” (2021), https://higherlogicdownload.s3.amazonaws.com/NASBO/9d2d2db1-c943-4f1b-b750-0fca152d64c2/UploadedImages/SER%20Archive/2021_State_Expenditure_Report_S.pdf.
- National Association of State Budget Officers, “State Expenditure Report.”
- S.D. Hoffman, “By the Numbers: The Public Costs of Teen Childbearing” (National Campaign to Prevent Teen Pregnancy, 2006).
- National Center for Health Statistics, CDC WONDER Online Database: Natality.
- Hoffman, “Public Costs of Teen Childbearing”; A.S. Ng and K. Kaye, “Teen Childbearing and Child Welfare” (The National Campaign to Prevent Teen and Unplanned Pregnancy, 2013), https://www.courts.ca.gov/documents/BTB24-2J-11.pdf.
- Hoffman, “Public Costs of Teen Childbearing.”
- C. Kallen, “State Tax and Expenditure Limitations and Supermajority Requirements: New and Updated Data” (working paper, American Enterprise Institute, Washington, DC, 2017), https://www.aei.org/research-products/working-paper/state-tax-and-expenditure-limitations-and-supermajority-requirements-new-and-updated-data/.
- G. Sobetski, The Tabor Revenue Limit, (2018), https://leg.colorado.gov/sites/default/files/the_tabor_revenue_limit.pdf.
- Colorado Governor’s Office of State Planning and Budgeting, Colorado Outlook.
- J. Biernacka-Lievestro and A. Fall, “A Third of States Lost Population in 2021,” The Pew Charitable Trusts, April 25, 2022, https://www.pewtrusts.org/en/research-and-analysis/articles/2022/04/25/a-third-of-states-lost-population-in-2021.
- U.S. Census Bureau, Annual and Cumulative Estimates of the Components of Resident Population Change for the United States, Regions, States, District of Columbia, and Puerto Rico: April 1, 2020 to July 1, 2021, accessed June 16, 2022, https://www2.census.gov/programs-surveys/popest/tables/2020-2021/state/totals/NST-EST2021-COMP.xlsx.
- Boyd, “Demographics, Aging, and State Taxes.”
- Oregon Office of Economic Analysis, Oregon Economic and Revenue Forecast: June 2022, https://www.oregon.gov/das/OEA/Documents/forecast0622.pdf.
- J. Theal and J. Fleming, “Budget Surpluses Push States’ Financial Reserves to All-Time Highs,” The Pew Charitable Trusts, May 10, 2022, https://www.pewtrusts.org/en/research-and-analysis/articles/2022/05/10/budget-surpluses-push-states-financial-reserves-to-all-time-highs.


ADDITIONAL RESOURCES


