Netting Billions: A Global Valuation of Tuna
 The Pew Charitable Trusts
Editor's note: This document was updated in Sept. 2016 to fix a typographical error in Figure 7 and correct the total weight of tuna landed in the Southern Ocean in 2014.
Overview
Taken together, the seven most commercially important tuna species are among the most economically valuable fishes on the planet. Collectively, skipjack, albacore, bigeye, yellowfin, Atlantic bluefin, Pacific bluefin, and southern bluefin tuna1 inhabit all of the tropical and temperate waters of the Earth’s oceans—and support artisanal and industrial fishing wherever they exist. Canned and other shelf-stable tuna products provide plentiful and inexpensive protein to markets around the world, while smaller amounts of high-quality tuna steaks and sashimi make their way to affluent markets in Asia, Europe, and North America.
Ecologically, tuna are a vital part of marine systems. Their importance in food webs as predators and prey is difficult to monetize; however, these iconic species are known to play a fundamental role in open ocean ecosystems.2 That makes maintaining their health critically important to human communities that rely on them for food and economic well-being, particularly at a time of global ocean change.
This report, in which The Pew Charitable Trusts presents the first effort to estimate the full global value of the primary commercial fisheries targeting these seven tuna species and the value of the resulting products, summarizes and discusses the findings of a much more detailed analysis that Pew commissioned from Poseidon Aquatic Resource Management Ltd., an independent fisheries and aquaculture consultancy based in the United Kingdom.3 Estimating the economic contribution of these fisheries informs and highlights the urgency of ensuring that the systems that govern the global ocean are robust and effective. Action is needed to guarantee a healthy and stable future for these species, as well as for the communities and businesses that depend on them.
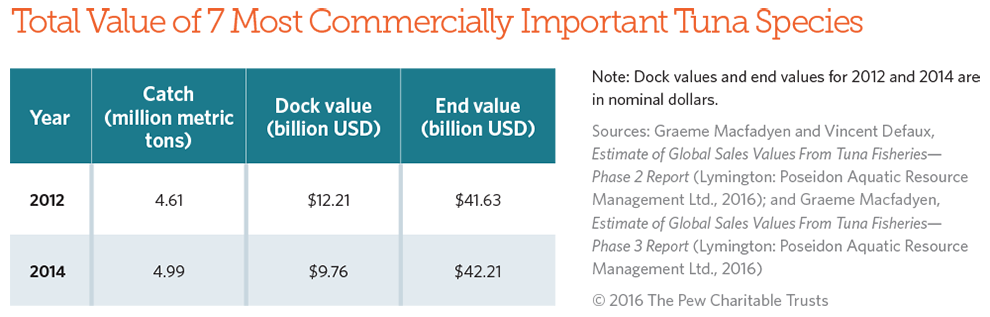
The findings are based on information gathered on tuna fisheries and markets for 2012 and 2014.4 Based on the analysis of available data, commercial fishing vessels in 2012 landed about 4.6 million metric tons of tuna worldwide. The estimated dock value, or amount paid to fishermen, was US$12.2 billion.* The estimated end value of this tuna—the total amount paid by the final consumer—was at least $33.3 billion. The estimate rose significantly when the entire price of a can of tuna, beyond the value of the fish alone, was used. In that case, the end value in 2012 was estimated to be $41.6 billion.5
In 2014, the volume of landed tuna rose to 4.99 million metric tons with an estimated dock value of $9.8 billion. The estimated end value remained similar to that in 2012 due to falling fish prices, and was $32.9 billion, or $42.2 billion when including the full canned product price.
* Currency references in this report are in U.S. dollars.
While the overall numbers do not reflect the total worth of the seven species, they provide a useful estimate of the contribution made by commercial tuna fisheries to the global economy. A total value of tuna, incorporating sport fishing and in-the-water ecosystem benefits of living tunas, among other things, would be much higher. Therefore, these numbers should be considered conservative.
The methodology used to calculate these global estimates allows for values to be broken down by region, species, and fishing gear. For example, the Pacific Ocean is home to the world’s largest tuna fishing grounds, making this region the largest contributor to total global sales values. According to the analysis, the end value of Pacific tuna when including the full canned tuna product price surpassed $22.7 billion in 2014.
When looking at individual species, skipjack tuna—most often found in cans—generates the highest estimated amount of revenue because of the volume caught each year. When analyzing individual fish, the three bluefin species—Pacific, southern, and Atlantic—are by far the most highly prized; a single bluefin typically fetches more than a ton of skipjack. Several populations of the most commercially important tunas, particularly the bluefin species, have been fished to levels that scientists and managers consider too low.6 The values reported here help make a convincing economic case for improving the management of the world’s tuna fisheries.
Stocks of Pacific bluefin, southern bluefin, and Atlantic bluefin, Atlantic and Pacific bigeye, and Indian Ocean yellowfin are all currently overfished.7 That means they have been fished down to a population size that no longer supports the maximum level of sustainable fishing and threatens their role in marine ecosystems. As a result, these stocks deliver less overall value to global tuna fisheries than they could if they were managed differently. As with all fisheries, maximizing the value of a species requires management that recognizes the productivity of healthy populations and minimizes the risk that the fishery will end up in an overfished state. Given the increasing number of tuna fisheries classified as overfished, improved management of these populations would likely, in time, improve catch rates and financial returns.
The reality is that fisheries management decisions continue to be based predominantly on the short-term economic bottom line—the amount of value gained or lost by fishing on any given day. That must change.
Fishery managers should enact policies that at a minimum restore depleted stocks to healthy levels, which should include setting science-based catch limits and developing systems of pre-agreed management actions that would be triggered when stocks fall below certain levels.
With a conservative annual value over $40 billion, tuna fisheries represent a significant component of the global economy. Improved management of these fisheries and conservation of tuna stocks are critical to sustaining the health and well-being of marine ecosystems, as well as the industries and coastal peoples who rely on the life in these waters for income and food.
Tuna ecology and history
The tunas are some of the world’s fastest fishes, with sleek bodies designed to achieve maximum speeds. The species referred to in this report migrate thousands of miles over their lifetimes, among oceans, national waters, and fisheries management regimes.
Despite some similarities, such as the ability of most tunas to regulate their body temperatures (unlike most other fishes), there are significant biological differences among these species. Tuna can range in size from just a few kilograms up to 680 kg (nearly 1,500 pounds), or roughly the size of a full-grown polar bear. Some tuna species live only a few years, while others can survive for decades.
All tunas are open ocean predators that eat fish, squid, and crustaceans. While they occupy a top position in the food web, juvenile tunas are also important to larger predators such as sharks, whales, and even other tunas. Coastal communities around the world have relied on tuna for centuries, and the influence of these species can be found in music, art, and literature. Large tunas have been a visible part of the culture and economies of Mediterranean and Japanese societies for much of recorded history. Fishermen have been catching tuna for thousands of years, originally for food and more recently for trade.
Tuna fishing nations
Based on data reported to the world’s regional fisheries management bodies, the top tuna-fishing nation is Indonesia, with total landings in 2014 of more than 620,000 metric tons. Indonesia’s vessels fish mainly in the eastern Indian and western Pacific oceans, in contrast to several other major fishing nations that support large global fleets.
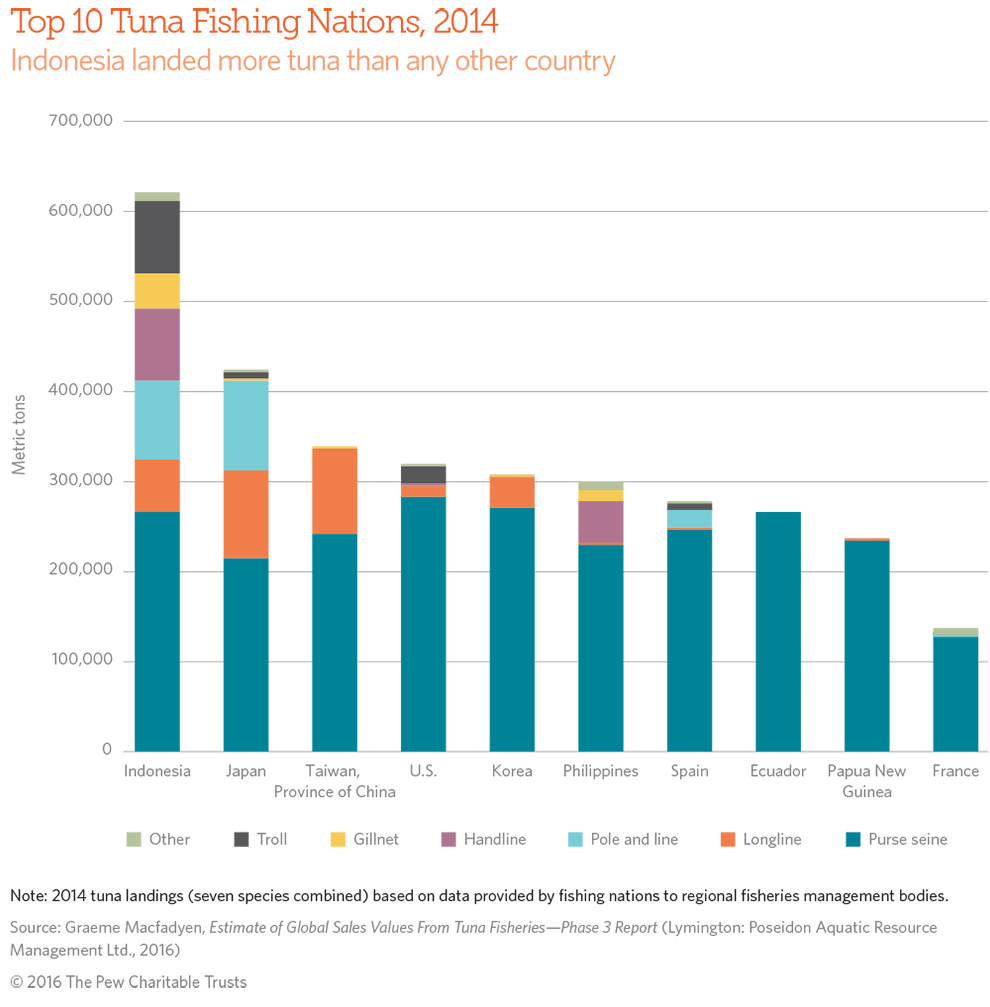
Most of these nations have diverse fleets, with boats that fish using all gear types and target all species. Six of the top 10—Japan; Taiwan, Province of China; the United States; Korea; Spain; and France—have large global fleets that can fish far from their home waters. The Asian and European fleets, in particular, fish all major ocean basins and land tuna at ports around the world.
The remaining top nations have very large local or regional fleets that fish in the highly productive eastern tropical Pacific (Ecuador) or western and central tropical Pacific (the Philippines and Papua New Guinea).
Methodology
To estimate the total global value of commercial tuna fisheries, information was collected on how much tuna is landed each year, what markets it enters, and what the ultimate consumer pays. These data distinguished between the total value of recently landed tuna to the fishermen who caught them and the total retail value after processing, shipping, and marketing. The steps taken to determine these figures are described below. A more detailed methodology is included in the technical documents produced for this analysis, available for download at pewtrusts.org/tunavalue.
Landings
To determine the volume of tuna landed in 2012 and 2014, data were collected from the five major tuna regional fisheries management organizations (RFMOs)8 to build a single landings database. These data were then sorted by country, species, gear type, and ocean of origin to allow for multiple analyses. To check for general robustness of the joint database, the totals were compared to the numbers reported by members of the U.N. Food and Agriculture Organization (FAO), a body that includes all marine fishing nations. The totals presented here are close to those reported to FAO.9
Market flow
Different tuna products command different prices, so the percentages of the landed volume destined for various final products had to be determined. This required in-depth analyses of individual fisheries for each ocean basin or for smaller regions within basins to consider where catch of different species made by different fishing gear is likely to end up being sold and in what product form. Expert interviews, published literature, personal interactions with managers at fish processing facilities, and personal experience informed market flow estimates for species and gears in each ocean region. Some paths to markets proved relatively easy to determine. For example, nearly all bigeye, yellowfin, and skipjack caught by purse seine vessels are destined for canneries, while bluefin caught by this gear are typically sent to ranches. Albacore caught with longlines generally head to canneries, while yellowfin and bigeye caught this way are often used for fresh or frozen sashimi. Other pathways were more difficult to determine—for example, how much skipjack caught by pole and line ends up in local markets as opposed to canneries and how much longline-caught bigeye is frozen for sashimi versus kept fresh. This report used the above sources to estimate the market flow for all tuna landed in 2012 and 2014, as well as to calculate the dock and end values.10
Dock and end value
Converting the volumes and market flows into final prices (either at the dock or at the point of final sale) required an estimated wholesale price paid to fishermen and retail price paid by the consumer. To estimate the average price paid to fishermen, several government agencies and trade organizations that operate in the primary tuna ports were surveyed.11 Given the global nature of tuna fisheries and the technological capabilities of tuna vessels, such as refrigeration, prices paid to fishermen are fairly consistent across ports for products of equal quality.12 Data sources included Japanese customs; Thai customs; the Maldives government; the Indonesian Ministry of Fisheries; and the National Oceanic and Atmospheric Administration’s Fisheries Service, the agency responsible for stewardship of U.S. marine resources.
A similar effort helped to estimate the average price paid by the ultimate consumer. Canned tuna prices proved relatively easy to obtain, because they are readily available in supermarkets around the world. Market surveys in the U.S. and in member states of the European Union provided an average canned price for the primary tunas in this market stream. Canned tuna is a global commodity. Therefore, average prices (unless altered by supermarkets during promotions) are consistent from market to market for products of equal quality.13 The end value of canned tuna was calculated using two average prices for each species: first, a price obtained by reducing the average shelf price by 32 percent to account for only the drained tuna (the reduction is equivalent to the average weight of the other materials that make up a can of tuna, such as water or oil, tin, etc.); and, second, the full shelf price determined by averaging the prices collected during market surveys. The first method is more conservative, while the second may be more illustrative.
Fresh and frozen sashimi prices were determined via market surveys and using recorded price data at several wholesale and retail markets in Japan. Japan accounts for 75 to 80 percent of the global sashimi market,14 and there is some evidence that EU wholesale prices are approximately equal to wholesale prices in Japan, even for lower-grade tuna.15 EU prices are based on contracts set near the global average price; Japanese prices, on the other hand, are the result of auctions and fluctuate more widely around the average. For these reasons, this research considered the more complete data set obtained from Japanese fish auctions to be representative of the prices paid elsewhere and used those data for all sashimi-grade tuna. Limited data available for retail sashimi prices in Japanese supermarkets revealed that average prices were approximately 1.75 times higher than the wholesale fish prices. Therefore, the wholesale fish prices were used to calculate final retail prices (by application of a multiplication factor of 1.75) in cases where retail price data were not available. The final sashimi price estimate is almost certainly conservative, as businesses in the food service sector are likely to charge more than those in retail supermarkets.
Fish meal and pet food prices for byproducts of fish canning were obtained from feed mill associations, while prices for tuna caught and sold domestically were based on data for Indonesia, the Maldives, and Sri Lanka (the countries with the largest estimated domestic sales of tuna not destined for canning or sashimi markets).
Once wholesale prices paid to fishermen and retail prices paid by the consumer were estimated, dock values and end values were calculated by multiplying landings by market flow by price. These values were calculated for 2012 and 2014.
The value of tuna
Just as the biology of tuna varies by species, so does the value. Some tuna species command the same price for a single fish that other species command for a few tons. Even the fishing method can determine the price at market.
By species
Of the seven commercially important tuna species, at least four—skipjack, yellowfin, bigeye, and albacore—can be found in cans on supermarket shelves in virtually every region of the world.
Small-bodied but extremely abundant, the skipjack is by far the most commonly caught tuna in total numbers and by weight. In 2012 and 2014, skipjack accounted for more than half of the total volume of tuna landed globally. Along with these huge volumes, however, comes a relatively low price per metric ton, compared with the larger tuna species. As a result, skipjack’s share of the total dock value is smaller than its share of the total catch; the reverse is true for the other species.
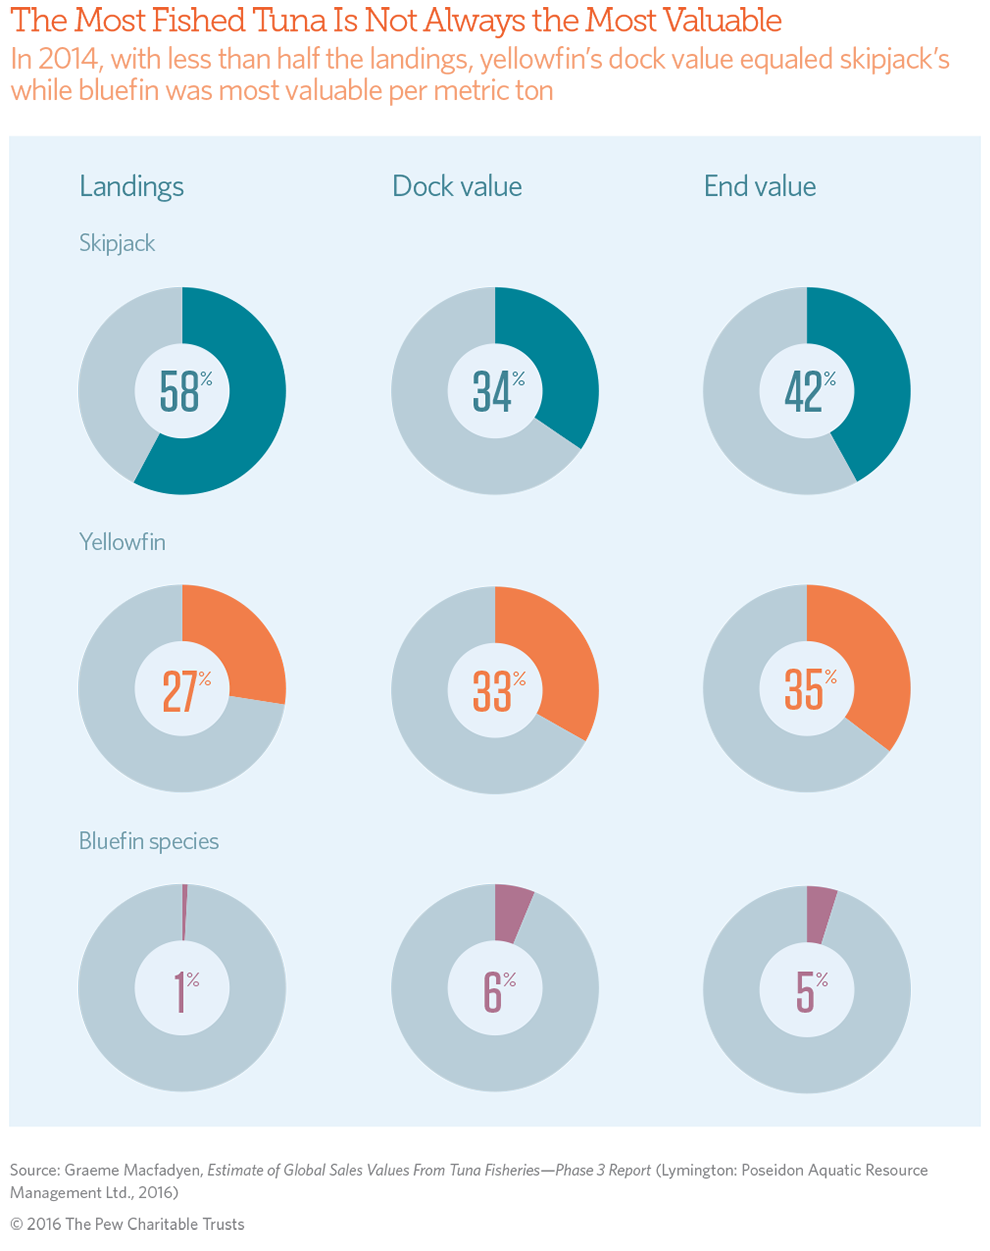
Yellowfin are sold for canning and as high-value sashimi or tuna steaks. Bigeye and all three of the bluefin species command higher prices per metric ton in whole or semiprocessed form than yellowfin. However, the sheer volume of yellowfin—and its popularity in high-priced cans—made the combined value of yellowfin fisheries higher than fisheries targeting all other tunas in 2012 and a close second to skipjack in 2014. Albacore tuna, labeled as white tuna when canned in North America, is used almost exclusively as a slightly higher-priced alternative to canned skipjack, but prices do not approach those for canned yellowfin.
Worldwide, tuna canneries processed 3.5 million metric tons of tuna in 2012. That translates into about 1.4 million metric tons of canned and other shelf-stable product. This tuna was worth nearly $18 billion at the point of final sale. The total value, including the cost of the cans and their contents, was almost $26 billion.16 That catch produced another 1.4 million metric tons of byproduct used primarily in fish meal and pet food and estimated to be worth another $260 million.
In 2014, the total value of this processed tuna approached $30 billion. With canned tuna, volume is key. The price per metric ton may be modest, but the total tonnage is enormous. In 2012, more than 75 percent of all landed tuna went to canneries for processing. Two years later, 79 percent of landed tuna was destined for canneries. Canned tuna continues to be a staple protein around the world.
The bluefin species are caught in smaller numbers and are often sold as individual fish. While the three bluefin species represent a very small portion of the total catch, they are by far the most valuable per metric ton. In 2012, the end value of both Atlantic and Pacific bluefin approached $1 billion for each species on catches of only about 12,000 and 15,000 metric tons, respectively.
With about 40,000 metric tons of all bluefin species caught per year—less than 1 percent of total tuna landings by weight—these fish generate an estimated $610 million to $660 million for fishermen and $2 billion to $2.5 billion in the global marketplace.
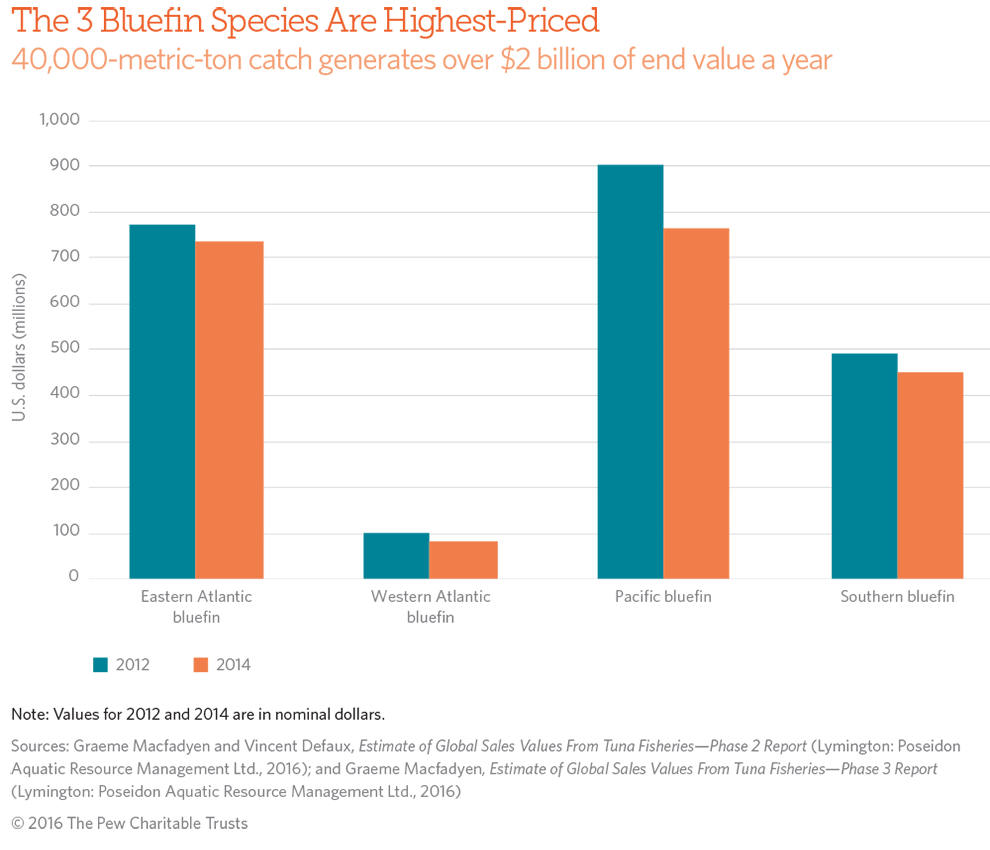
Media reports of million-dollar bluefin tuna sales17 reflect prices paid in traditional auctions in countries such as Japan more than true market value, but the price of bluefin sashimi is still extraordinarily high. A metric ton of bluefin tuna costs $50,000 to $70,000, on average. The Atlantic bluefin is the highest-priced of all tuna species, with the cost per metric ton reaching $69,000 in 2012. Pacific bluefin is the next highest, at $63,000 per metric ton, followed by southern bluefin at $48,000.18
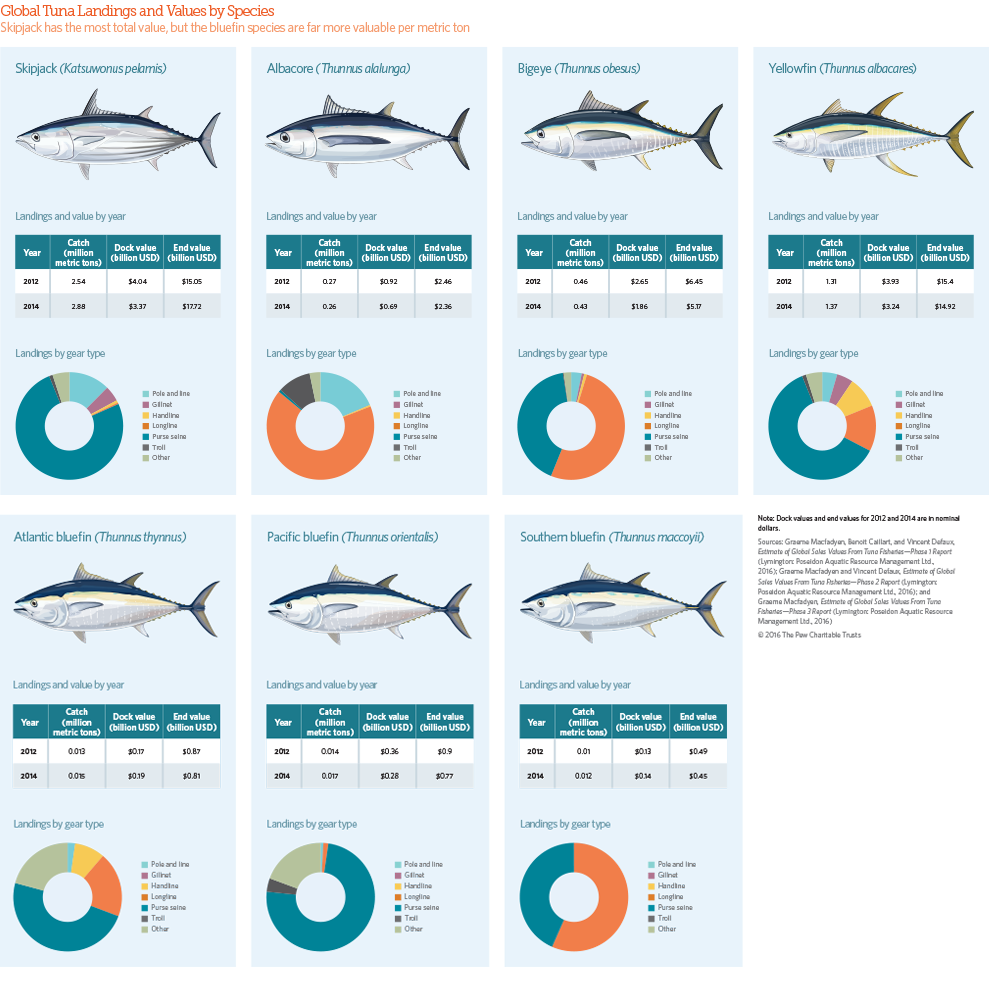
Global Tuna Landings and Values by Species
Skipjack has the most total value, but the bluefin species are far more valuable per metric ton.
Click the illustration to expand.
Demand for bluefin sashimi continues to grow. Markets around the world have developed an increasing appetite for this cuisine or have seen increases in the disposable income required to purchase it in recent decades. All three bluefin species are overfished, the Pacific19 and southern20 species significantly so. Increasing demand, when coupled with a lack of political will to take strong management actions, continues to push stock sizes down.
If managers continue to promote short-term economic gains in bluefin fisheries instead of long-term economic security, stocks could be depleted to levels incapable of supporting future commercial fisheries. However, with proper management, fisheries for these three species could potentially grow.
Some stocks of yellowfin and bigeye are now also overfished, likely reflecting a lack of political recognition that they should be managed in ways that take into account their relatively high value.
By fishing gear
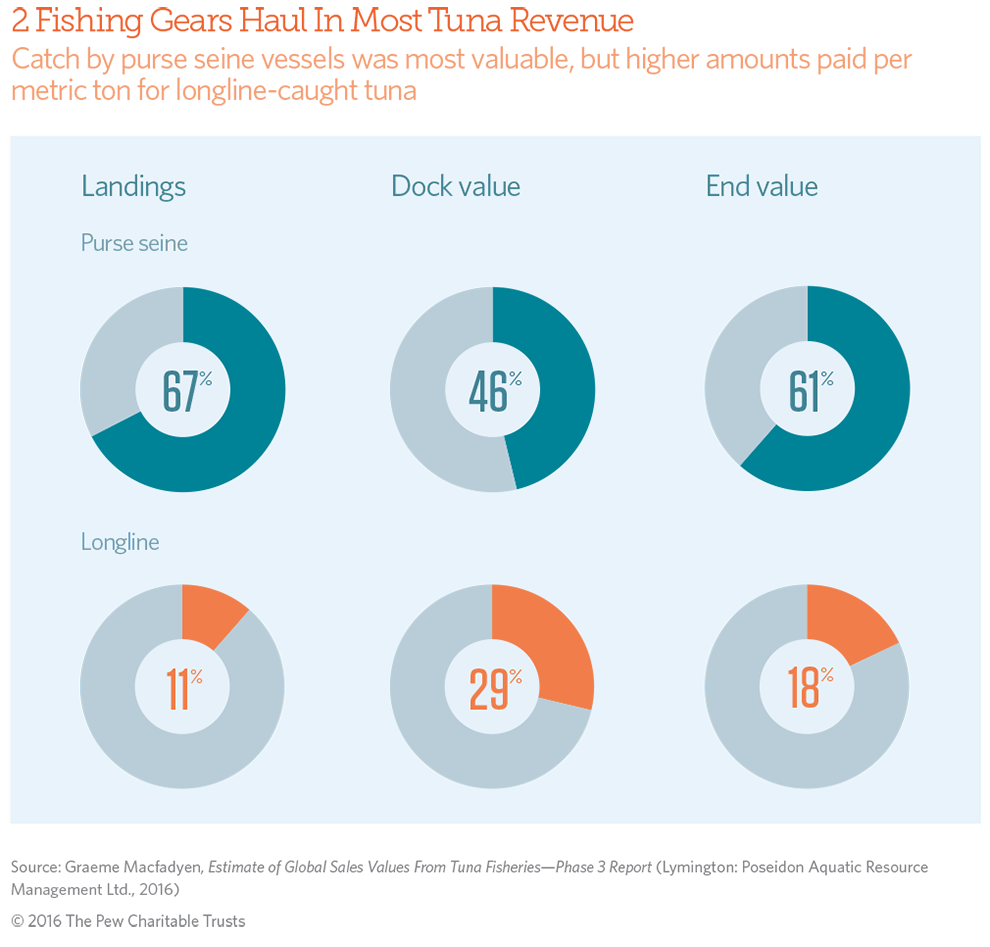
The large majority of tuna landed worldwide is taken by purse seine fishing vessels, which use very large nets to encircle entire schools of fish. Purse seiners target primarily skipjack and yellowfin, and most tuna caught this way is destined for canneries. Because of the large volumes of these two species captured by purse seine, this gear type accounts for more revenue than any other.
Additionally, low volumes of extremely valuable bluefin are caught by purse seine vessels and used in “ranching.” In that process, tuna, mostly juveniles, are transferred alive to cages in the ocean and left to grow for up to two years, increasing their size and value.
In 2012 and 2014, a relatively small number of large purse seine vessels caught approximately two-thirds of all landed tuna. That accounted for about half of the dock value and end value of all tuna fisheries.
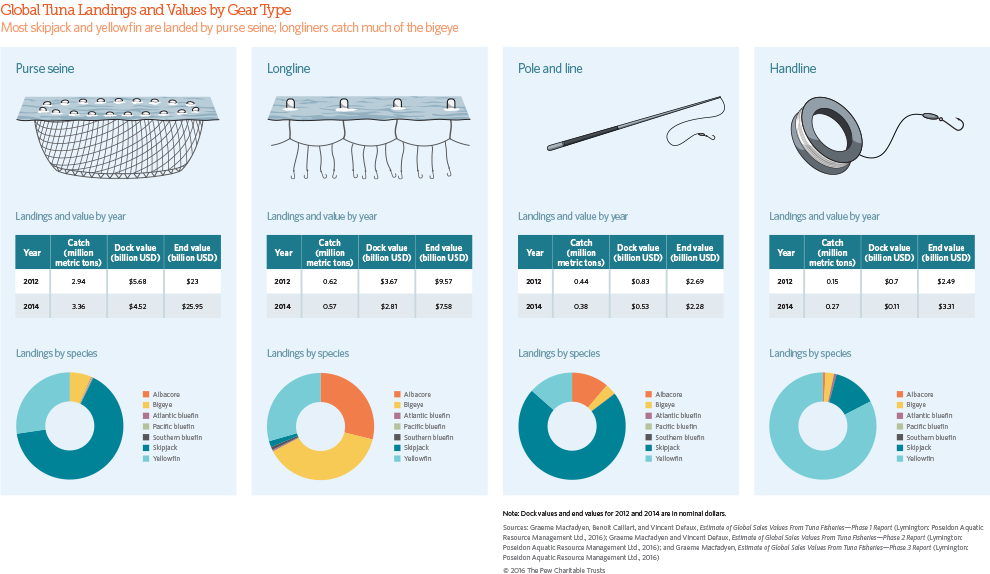
Global Tuna Landings and Values by Gear Type
Most skipjack and yellowfin are landed by purse seine; longliners catch much of the bigeye.
Click the illustration to expand.
Yellowfin, bigeye, and bluefin caught by longlines and handlines for the sashimi markets command higher prices than tuna for canning that is caught by purse seine vessels. Furthermore, longline-caught albacore, almost all of which is destined for cans and pouches, commands a slightly higher price than skipjack. As a result of these price differences, the approximately 10,00021 longline vessels, which accounted for just 13 percent of the catch, were responsible for 30 percent of the dock value and 27 percent of the end value of all tuna fisheries in 2012. The numbers were similar in 2014. The slightly smaller share of end value relative to dock value is likely the result of retail competition from handline-caught tuna of the same species.
Other fishing gears, including pole and line, gillnet, and troll, account for small percentages of landings and value of tuna fisheries.
By region
The Pacific Ocean supports the world’s largest tuna fisheries. Nearly three-quarters of tuna landings in 2012 and 2014 came from these waters, and sales of tuna from the Pacific made up two-thirds of the global dock value and end value in both years.
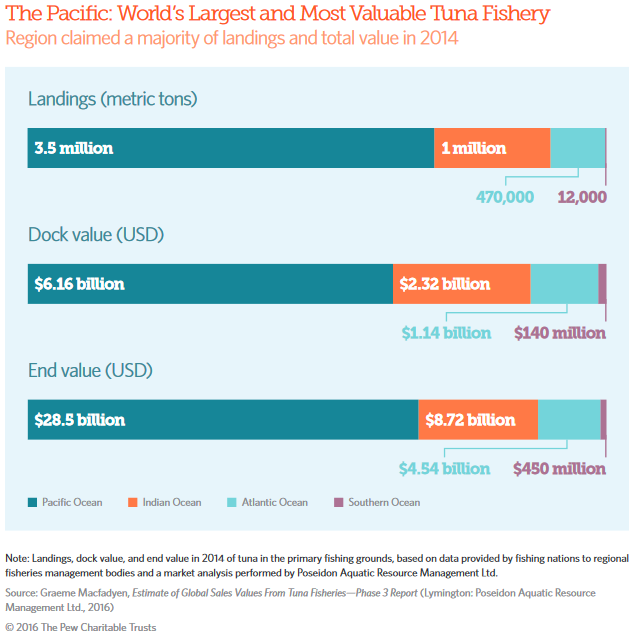
Commercially landed Pacific tuna generated dock values of more than $6.5 billion in 2012 and $5 billion in 2014. The end value of Pacific tuna surpassed $17 billion in both years. When accounting for the full price of canned tuna, these values were more than $22 billion (in nominal dollars) in both years.
Indian Ocean tuna fisheries run a distant second, followed by the Atlantic and Southern oceans. The Southern Ocean’s small piece of the global pie is a result of fisheries targeting only southern bluefin. Still, the end value of Southern Ocean tuna is significant (about $500 million).
How markets affect value
There are a few notable differences between the landings and revenue of tuna fisheries in 2012 and 2014. Worldwide landings were 8 percent higher in 2014, but the end value was about the same. More significantly, after adjusting for inflation, dock value dropped by more than 21 percent (in 2012 dollars).22 There are a few reasons these numbers did not change together.
Increased landings can be attributed primarily to higher purse seine landings of skipjack, but the resulting increase in the end value of canned tuna was offset by a decline in end value of other tuna species. Specifically, the fresh and frozen sashimi markets declined in value during the two years studied. However, this drop seems to be a result largely of a change in the exchange rate between the Japanese yen and the U.S. dollar. Japan remains the top importer of fresh and frozen tuna for the sashimi market, so that business is typically conducted in yen. An analysis of sashimi prices from top Japanese markets (in yen rather than dollars) demonstrates consistency in retail prices from 2012 to 2014,23 but conversion to dollars for purposes of this analysis depressed the value. More interestingly, dock value (in 2012 dollars) fell $2.7 billion between 2012 and 2014, despite an increase of nearly 400,000 metric tons of tuna landings. Fishermen caught more tuna but were paid almost 22 percent less for it. Any losses that resulted from unfavorable currency exchange, changes in consumer preferences, or other market shifts were passed along to fishermen. The total market did not shrink; the end value varied only slightly, but the dock value decreased significantly.
Discussion and implications
This first global estimate of the value of tuna fisheries confirms that they are extremely valuable. They support enormous industries in many nations and generate more than $40 billion a year for the global economy. From the extremely high volume, commoditized canned tuna to the low volume, highly desired, top-shelf bluefin sashimi, commercially targeted tunas produce significant revenue for fishermen and coastal communities. These tunas contribute to the global seafood economy all the way to the supermarket or restaurant where they are ultimately sold. Tuna fisheries are a source of low-cost protein for much of the world and provide employment in areas where fishing and processing are concentrated. However, it appears that long-term sustainability is all too often traded for short-term political or economic gains. In an industry worth $40 billion a year, long-term viability should not be risked for relatively small, short-term gains.
RFMOs, the multinational governing bodies charged with overseeing tuna fisheries, have been slow to adopt critical management tools such as catch limits and recovery plans. Lack of political will to sustainably manage tuna fisheries and recover depleted tuna stocks puts the benefits of robust tuna fisheries at risk. For example, the tuna RFMO in the Atlantic Ocean only recently took steps to reverse population declines in Atlantic bluefin tuna populations. That action came only after the species’ population declined significantly and an international trade ban was threatened.24
Many managers do not appear to have learned from this experience, and RFMOs in the Pacific have refused to take adequate steps on at least two stocks—Pacific bluefin and Pacific bigeye—despite ample evidence that both are significantly depleted and continue to experience overfishing. Given that the Pacific is the source of more than half of the landings and revenue of global tuna fisheries, precautionary management must be a top priority for this region.
The use of harvest strategies, or pre-agreed frameworks for making fisheries management decisions (including setting quotas), would help move beyond the political gridlock and protect the value of the fishery. These strategies may be tailored to individual settings or needs, but all such efforts include the same elements: a monitoring program, a stock assessment methodology, reference points (or other fishery indicators), and harvest control rules. Moving from traditional fisheries management, in which politics and the requirement for consensus-based decision-making often delay management action, to a system where the scientific advice more directly influences management decisions would be a good first step toward better fishery management. If harvest strategies are fully implemented, the aggregate value of tuna could grow, as depleted species return to population sizes capable of producing higher landings.
Finally, as mentioned, this report is intended to provide only a snapshot of the value of commercial tuna fisheries for the seven most economically important tuna species. The true worth of these species and of the entire tuna family are much higher. Value associated with sport fisheries, artisanal targeting of other tunas, and in-the-water benefits of living tunas (to ecosystem functioning and carbon cycling, for example) are difficult to measure but add significantly to the values presented here. International and domestic policies that promote overfishing and lead to depletion of tuna stocks not only risk the high values of the fisheries examined in this report but also the broader value of healthy, robust tuna stocks.
Conclusion
This report represents the first attempt to develop a rigorous estimate of the global value of tuna fisheries. Because this analysis is based solely on available commercial data, the value of the world’s tuna populations likely far exceeds the $42.2 billion estimated here. Despite being a conservative estimate, the report’s findings—that tuna fisheries contribute tens of billions of dollars to the global economy—indicate the critical importance of ensuring that all commercially fished tuna species are managed sustainably.
To conserve, and build on, the wealth that tuna fisheries generate, steps are needed to improve the precautionary management of tuna populations globally. Managers should:
- Restore depleted tuna stocks to healthy levels, at a minimum.
- Determine and set science-based catch limits that prevent stocks from dropping below healthy levels to ensure an adequate buffer to account for uncertainties.
- Develop and implement a system of pre-agreed management actions that would be triggered when stock sizes drop below predetermined healthy levels; these actions should be designed to reverse trends toward excessive stock depletion.
With these three actions, fisheries managers can work to remove the short-term politics from decision-making. Doing that would secure strong financial returns in tuna fisheries while ensuring the health of marine ecosystems.
ENDNOTES
- They are skipjack (Katsuwonus pelamis), albacore (Thunnus alalunga), bigeye (T. obesus), yellowfin (T. albacares), Atlantic bluefin (T. thynnus), Pacific bluefin (T. orientalis), and southern bluefin (T. maccoyii).
- Bruce B. Collette and Cornelia E. Nauen, Scombrids of the World: An Annotated and Illustrated Catalogue of Tunas, Mackerels, Bonitos, and Related Species Known to Date (1983), http://www.fao.org/3/a-ac478e.pdf.
- The full technical documents produced for this analysis, including a detailed methodology, can be found at pewtrusts.org/tunavalue.
- Because the underlying analysis set out to build a snapshot of the global tuna market, rather than compare changes across years, values presented are nominal unless otherwise noted—2012 dollars for 2012 amounts and 2014 dollars for 2014 amounts.
- See methodology, Page 5.
- U.N. Food and Agriculture Organization, The State of World Fisheries and Aquaculture: Opportunities and Challenges (2014), http://www.fao. org/3/a-i3720e.pdf.
- International Seafood Sustainability Foundation, ISSF Tuna Stock Status Update, 2016: Status of the World Fisheries for Tuna (2016), http:// iss-foundation.org/about-tuna/status-of-the-stocks.
- They are the International Commission for the Conservation of Atlantic Tunas, Indian Ocean Tuna Commission, Western and Central Pacific Fisheries Commission, Inter-American Tropical Tuna Commission, and Commission for the Conservation of Southern Bluefin Tuna.
- Graeme Macfadyen, Benoit Caillart, and Vincent Defaux, Estimate of Global Sales Values From Tuna Fisheries—Phase 1 Report (Lymington: Poseidon Aquatic Resource Management Ltd., 2016): 5.
- Ibid., Table 15.
- Ibid., Table 16.
- Ramón Jiménez Toribio, Patrice Guillotreau, and Rémi Mongruel, “Global Integration of European Tuna Markets,” Progress in Oceanography 86, no. 1–2 (2010): 166–175, http://www.documentation.ird.fr/hor/fdi:010049666.
- Ibid.
- Amanda Hamilton et al., Market and Industry Dynamics in the Global Tuna Supply Chain, Pacific Islands Forum Fisheries Agency (2011), https://www.ffa.int/node/567.
- See, for example, Makoto P. Miyake et al., Recent Developments in the Tuna Industry: Stocks, Fisheries, Management, Processing, Trade, and Markets, U.N. Food and Agriculture Organization (2010), http://www.fao.org/docrep/013/i1705e/i1705e.pdf.
- See methodology on Page 5.
- Anna Mukai and Yuki Yamaguchi, “Japan Sushi Chain Pays Record $1.76 Million for Tuna at Auction,” Bloomberg, Jan. 6, 2013, http://www. bloomberg.com/news/articles/2013-01-06/japan-sushi-chain-pays-record-1-76-million-for-tuna-at-auction.
- 2014 values were lower for all three species, but this may be a result of global monetary policy as opposed to changing markets. See “How markets affect value,” Page 18.
- International Scientific Committee for Tuna and Tuna-like Species in the North Pacific Ocean, Pacific Bluefin Tuna Working Group, Stock Assessment of Pacific Bluefin Tuna (2014), http://isc.fra.go.jp/pdf/Stock_assessment/PBF_2014_Exec_Summary_4-28-2014_gtd.pdf.
- Commission for the Conservation of Southern Bluefin Tuna, Report of the Twentieth Meeting of the Scientific Committee (2015), https:// ccsbt.org/sites/ccsbt.org/files/userfiles/file/docs_english/meetings/meeting_reports/ccsbt_22/report_of_SC20.pdf.
- This approximate value is based on a review of the certified vessel lists of the major tuna RFMOs.
- Real prices were calculated using the Bureau of Labor Statistics’ Consumer Price Index, accessed March 3, 2016, http://www.bls.gov/cpi.
- Graeme Macfadyen, Estimate of Global Sales Values From Tuna Fisheries—Phase 3 Report (Lymington: Poseidon Aquatic Resource Management Ltd., 2016).
- Jean-Marc Fromentin et al., “The Spectre of Uncertainty in Management of Exploited Fish Stocks: The Illustrative Case of Atlantic Bluefin Tuna,” Marine Policy 47 (2014): 8–14, http://dx.doi.org/10.1016/j.marpol.2014.01.018.

ADDITIONAL RESOURCES

Article

Article


