Federal and State Funding of Higher Education
A changing landscape
These data have been updated. The latest research is available here.
Overview
States and the federal government have long provided substantial funding for higher education, but changes in recent years have resulted in their contributions being more equal than at any time in at least the previous two decades. Historically, states have provided a far greater amount of assistance to postsecondary institutions and students; 65 percent more than the federal government on average from 1987 to 2012. But this difference narrowed dramatically in recent years, particularly since the Great Recession, as state spending declined and federal investments grew sharply, largely driven by increases in the Pell Grant program, a need-based financial aid program that is the biggest component of federal higher education spending.
Although their funding streams for higher education are now comparable in size and have some overlapping policy goals, such as increasing access for students and supporting research, federal and state governments channel resources into the system in different ways. The federal government mainly provides financial assistance to individual students and specific research projects, while state funds primarily pay for the general operations of public institutions.
Policymakers across the nation face difficult decisions about higher education funding. Federal leaders, for example, are debating the future of the Pell Grant program. The Obama administration has proposed increasing the maximum Pell Grant award to keep pace with inflation in the coming years, while members of Congress have recommended freezing it at its current level. State policymakers, meanwhile, are deciding whether to restore funding after years of recession-driven cuts. Their actions on these and other critical issues will help determine whether the shift in spending that resulted in parity is temporary or a lasting reconfiguration.
In a constrained fiscal environment, policymakers also will need to consider whether there are better means of achieving shared goals, including student access and support for research. Such approaches could entail more coordination, other funding mechanisms, or policy reforms. In addition, it will be necessary to think about the implications of parity and whether funding strategies will require changes in order to reach desired outcomes. This chartbook is intended to provide a starting point for answering such questions by illustrating the existing federal- state relationship in higher education funding, the way that relationship has evolved, and how it differs across states.
Figure 1
Click on the graphic to expand.
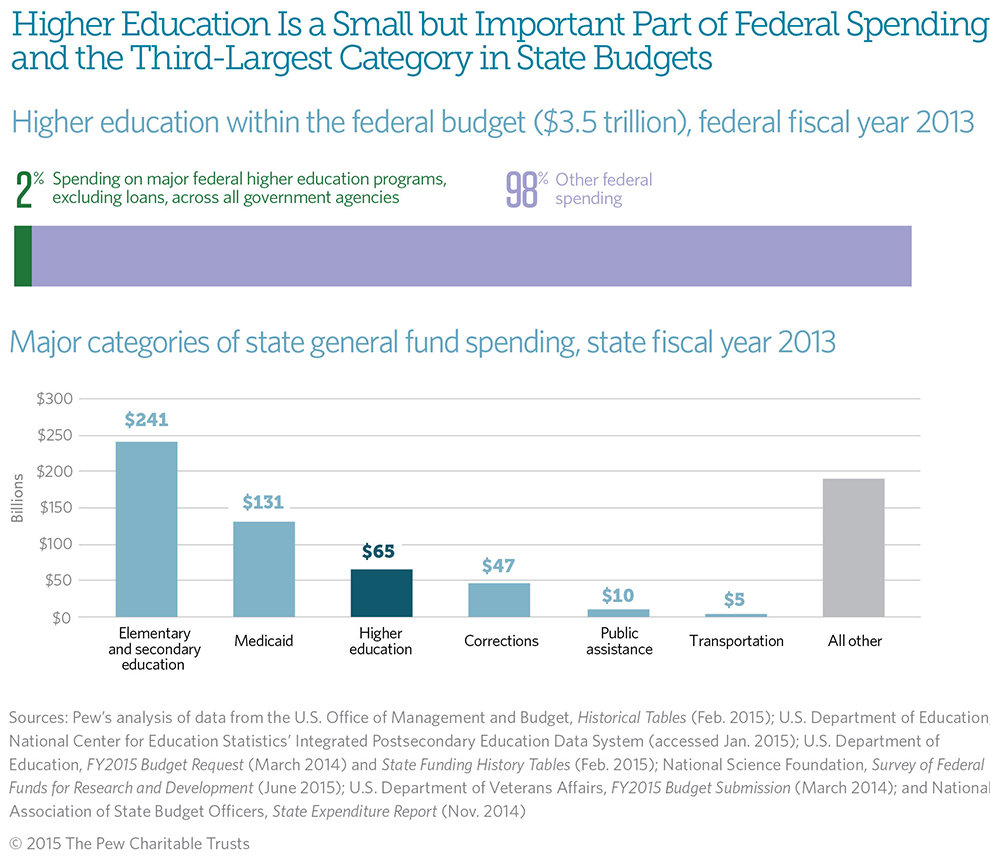
Though only about 2 percent of the total federal budget, higher education programs make up a large share of federal education investments. For example, about half of the U.S. Department of Education’s budget is devoted to higher education (excluding loan programs). Higher education funding also comes from other federal agencies such as the U.S.Departments of Veterans Affairs and Health and Human Services, and the National Science Foundation.
Higher education was the third-largest area of state general fund spending in 2013 behind K-12 education and Medicaid.
Figure 2
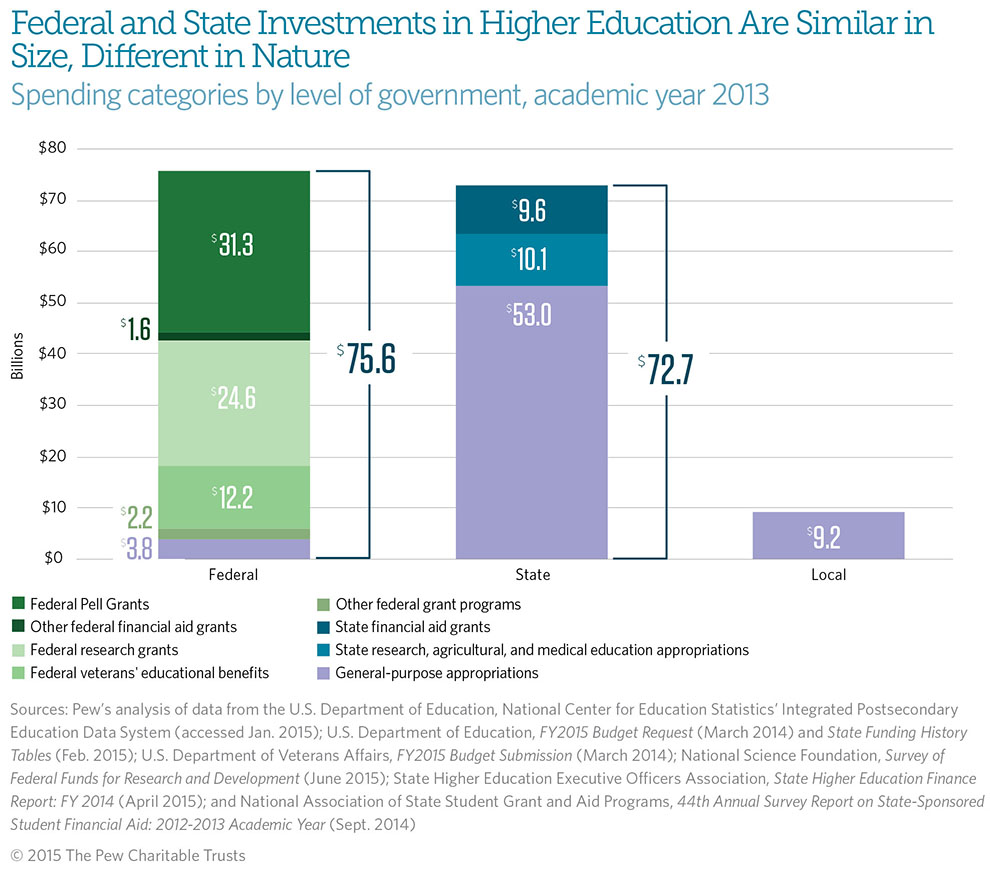
In 2013, federal spending on major higher education programs totaled $75.6 billion, state spending amounted to $72.7 billion, and local spending was considerably lower at $9.2 billion. These figures exclude student loans and higher education-related tax expenditures.
Although the federal and state funding streams are comparable in size and have overlapping policy goals, such as increasing access for students and fostering research, they support the higher education system in different ways: The federal government mostly provides financial assistance to individual students and funds specific research projects, while states typically fund the general operations of public institutions, with smaller amounts appropriated for research and financial aid. Local funding of $9.2 billion largely supports the general operating expenses of community colleges. For more information, see Appendix A.
Figure 3
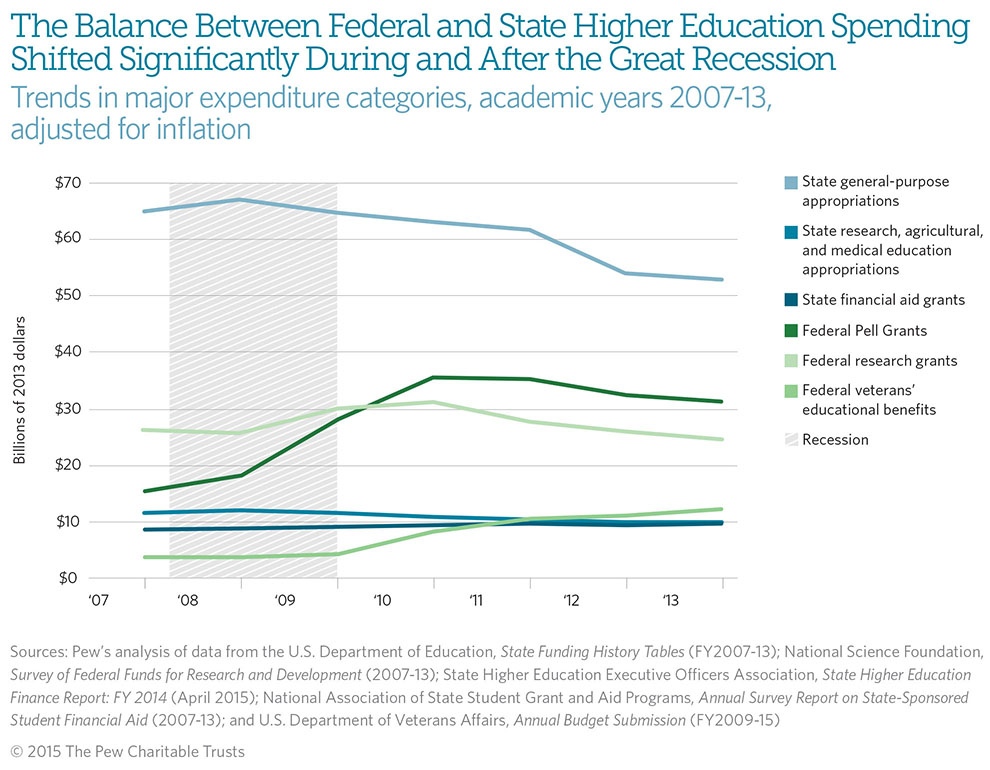
Funding for major federal higher education programs grew significantly from the onset of the recession, even as state support fell. The federal spending areas that experienced the most significant growth were the Pell Grant program and veterans’ educational benefits, which surged by $13.2 billion (72 percent) and $8.4 billion (225 percent), respectively, in real terms from 2008 to 2013. The biggest decline at the state level was in general-purpose appropriations for institutions, which fell by $14.1 billion (21 percent) over the same period. During those years, the number of full-time equivalent (FTE) students grew by 1.2 million (8 percent). For more information, see Appendix A.
Figure 4
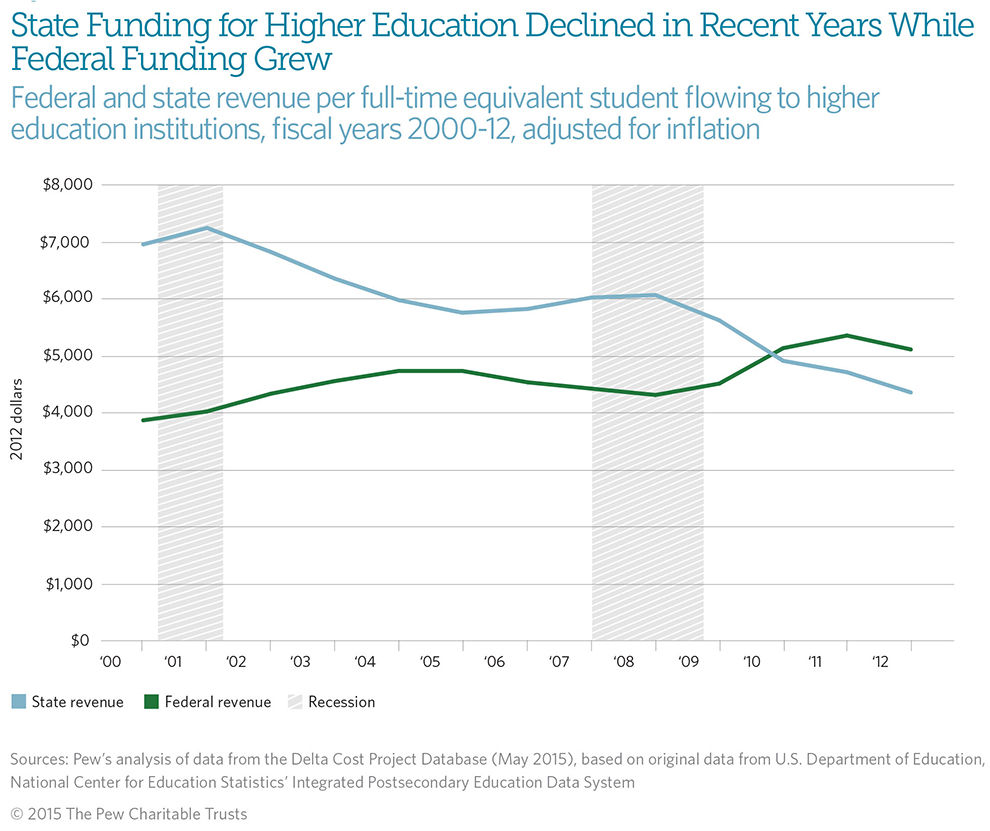
A major shift has occurred in the relative levels of funding provided by states and the federal government in recent years. By 2010, federal revenue per full-time equivalent (FTE) student surpassed that of states for the first time in at least two decades, after adjusting for enrollment and inflation. From 2000 to 2012, revenue per FTE student from federal sources going to public, nonprofit, and for-profit institutions grew by 32 percent in real terms, while state revenue fell by 37 percent. The number of FTE students at the nation’s colleges and universities grew by 45 percent during the same period. Without adjusting for enrollment growth, total federal revenue grew by 92 percent from $43.3 billion to $83.2 billion in real terms, while state revenue fell by 9 percent from $77.8 billion to $70.8 billion after adjusting for inflation.
Figure 5
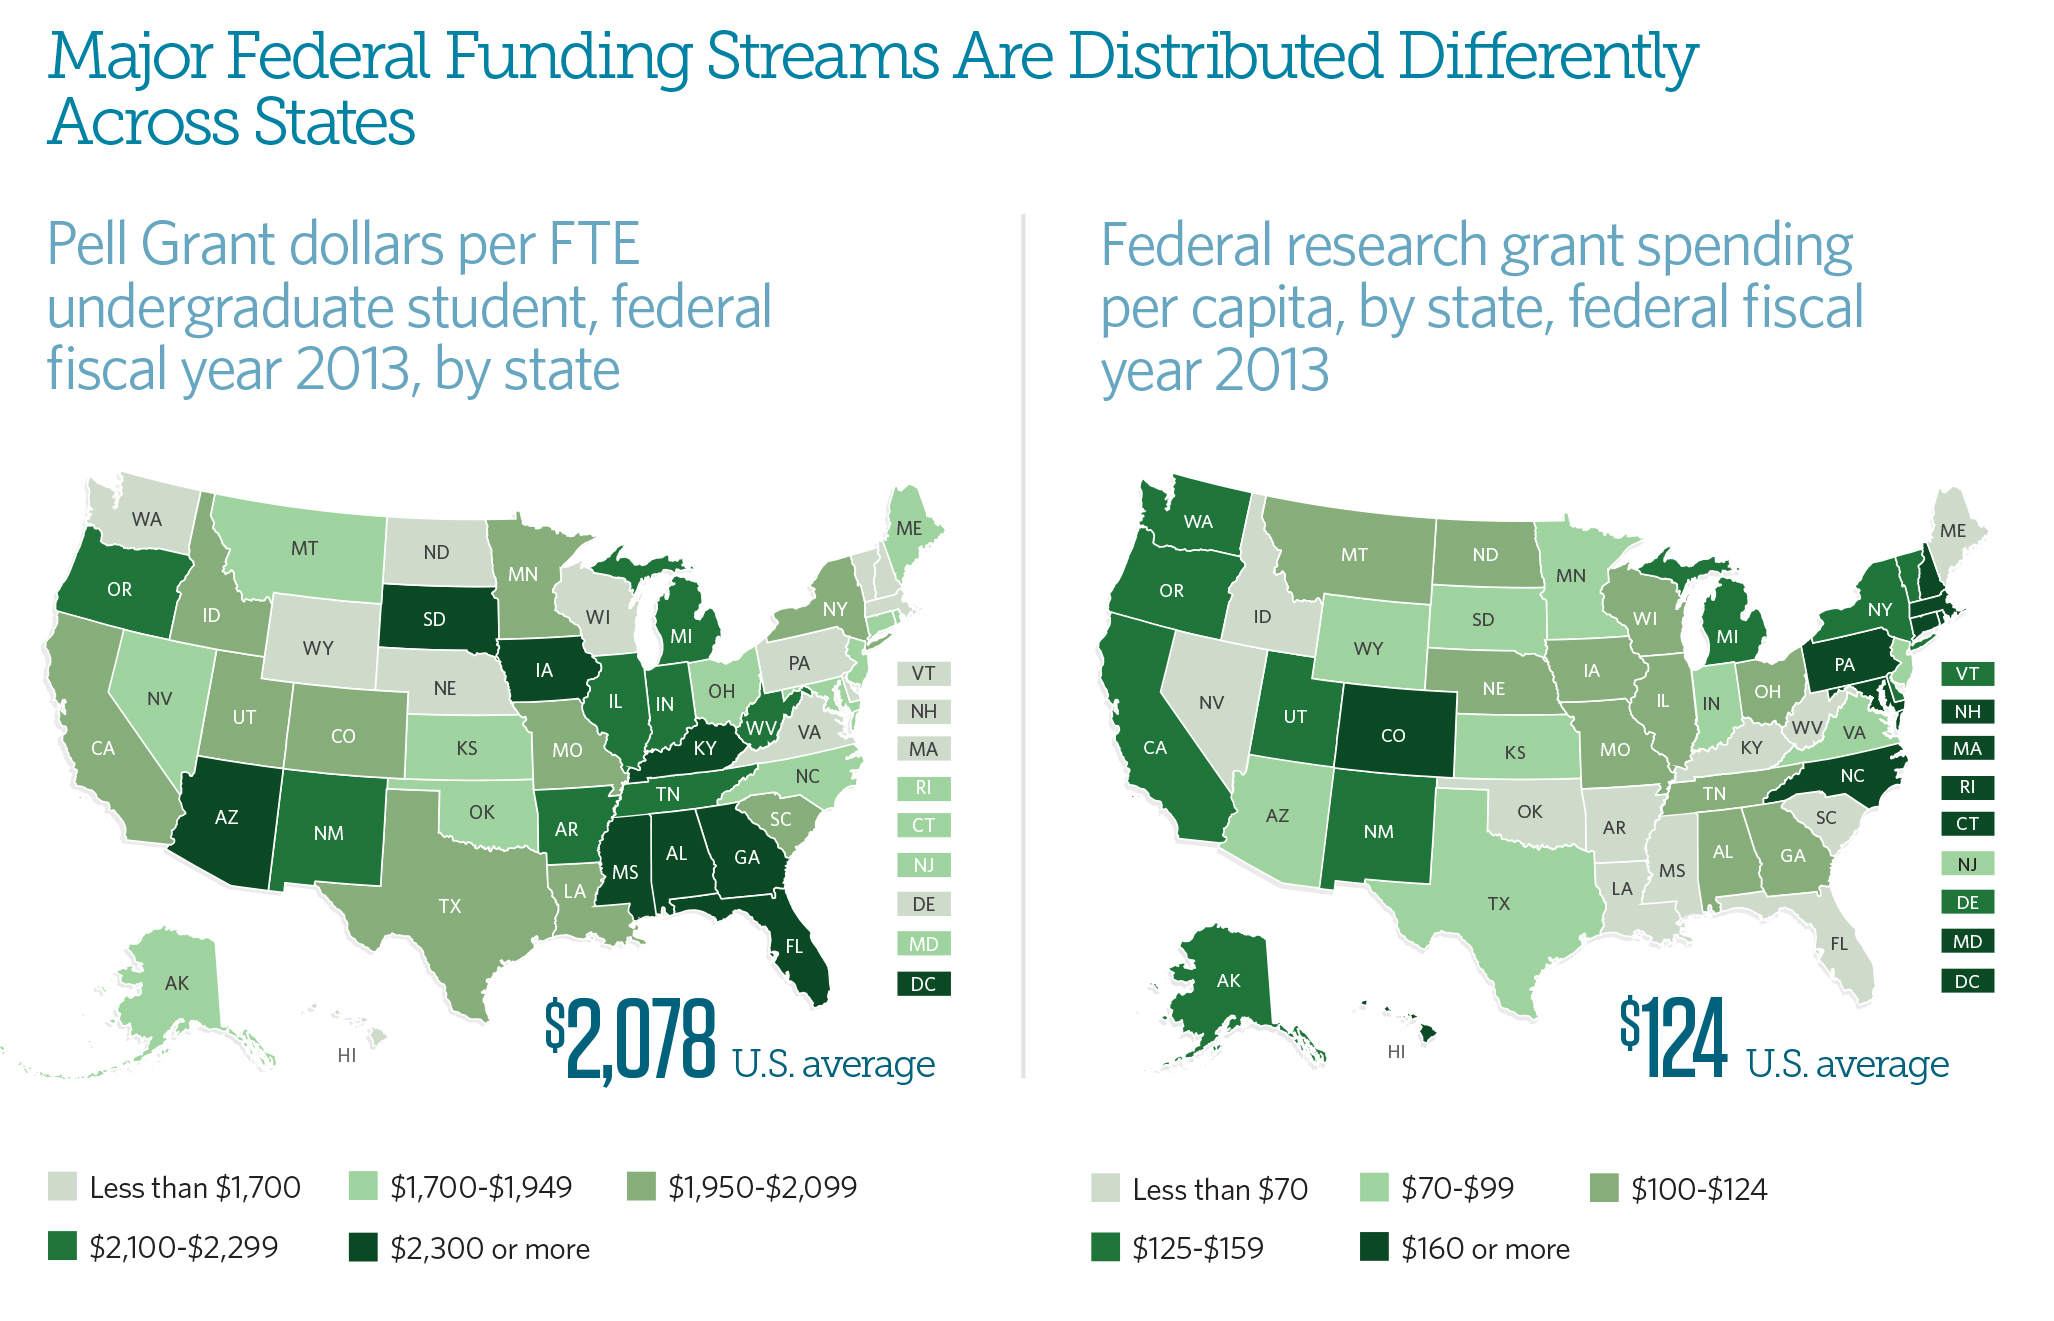
Total federal higher education funding varies widely across states, and the major types of funding have very different geographic distributions. For example, Pell Grant funding, which is distributed based on a calculation of students’ financial need, ranged from $1,177 in North Dakota per FTE undergraduate to $3,401 in Arizona, compared with a national average of $2,078. High Pell Grant states are concentrated in the Southeast.
Similarly, per-capita federal research funding ranged from $37 in Maine to $476 in the District of Columbia, compared with a national average of $124. States with high levels of research support are concentrated in the Northeast. See Appendix A, Figure 2 for more information about federal funding categories.
Figure 6
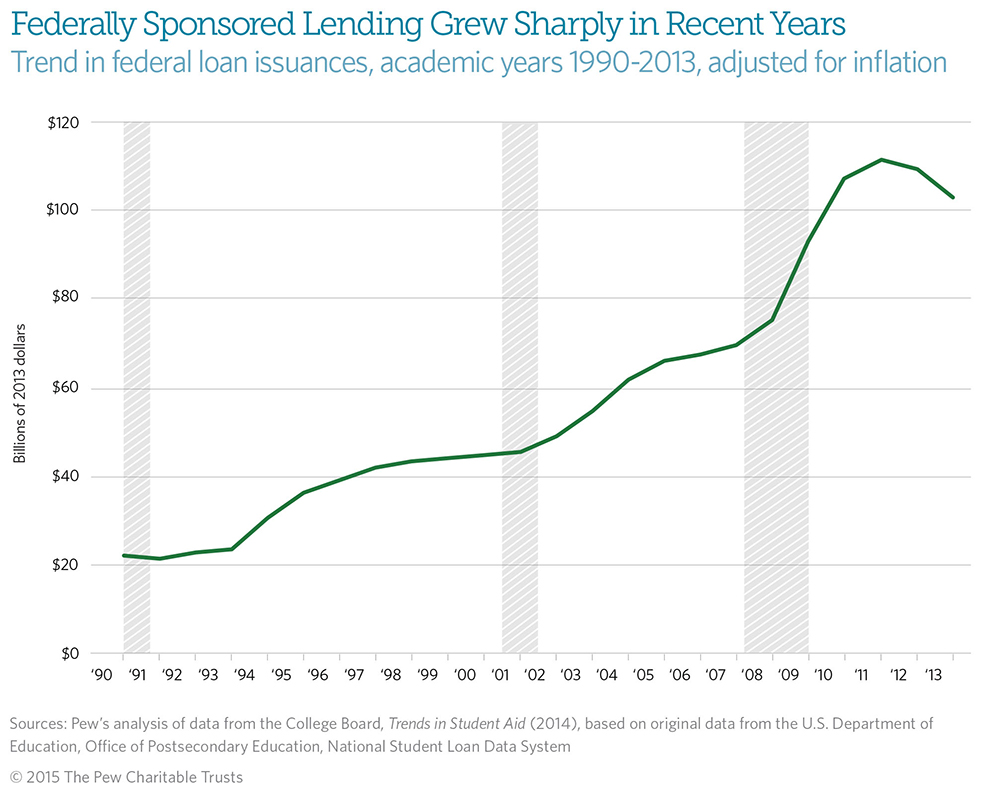
The federal government is the nation’s largest student lender; it issued $103 billion in loans in 2013. States, by contrast, provided only $840 million in loans that year, less than 1 percent of the federal amount.
Although they must be paid back with interest, federal loans allow students to borrow at lower rates than are available in the private market. Federal loans grew 376 percent between 1990 and 2013 in real terms, compared with enrollment growth of 60 percent. These figures represent the volume, rather than the cost, of those loans.
Figure 7
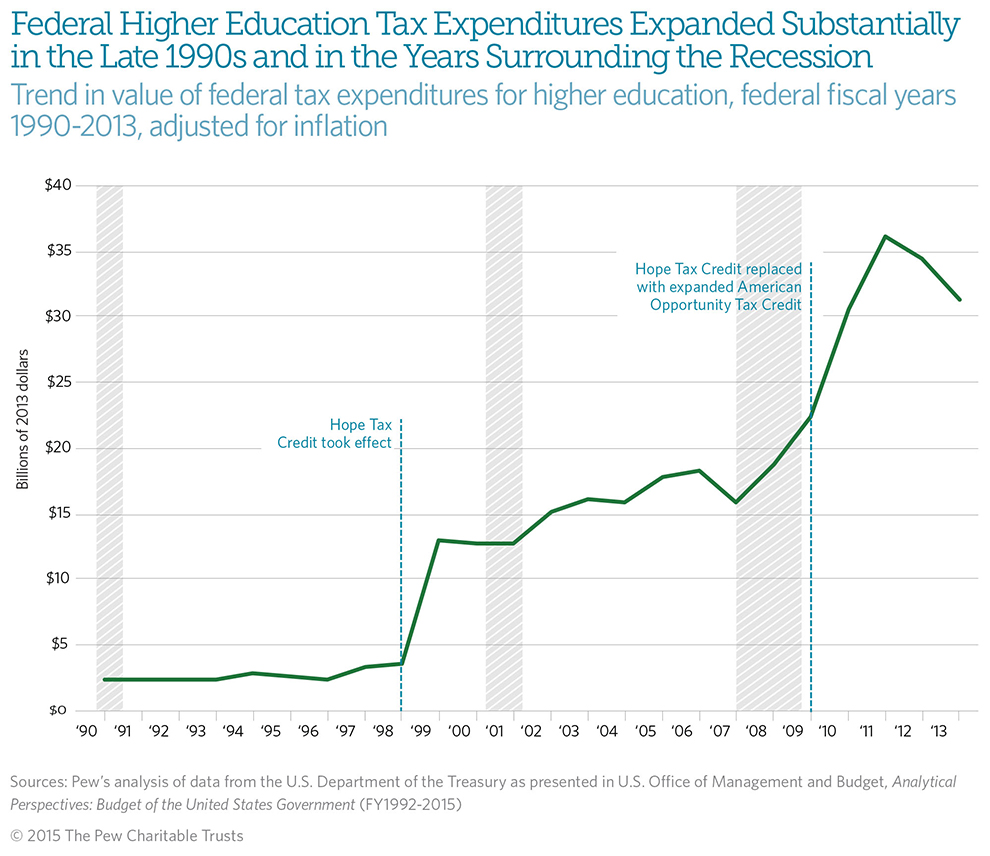
The federal government also supports higher education through the tax code. In 2013, it provided $31 billion in tax credits, deductions, exemptions, and exclusions to offset costs, essentially equal to the $31 billion it spent for Pell Grants. Because these expenditures allow taxpayers to reduce their income taxes, they reduce federal revenue and are similar to direct government spending.
The value of federal tax expenditures for higher education is $29 billion larger than it was in 1990 in real terms. Much of the growth coincided with the creation of the American Opportunity Tax Credit (formerly Hope Tax Credit) in 1997 (effective 1998) and its expansion and renaming in 2009. Between 1990 and 2013, the number of FTE students grew by 60 percent.
Figure 8
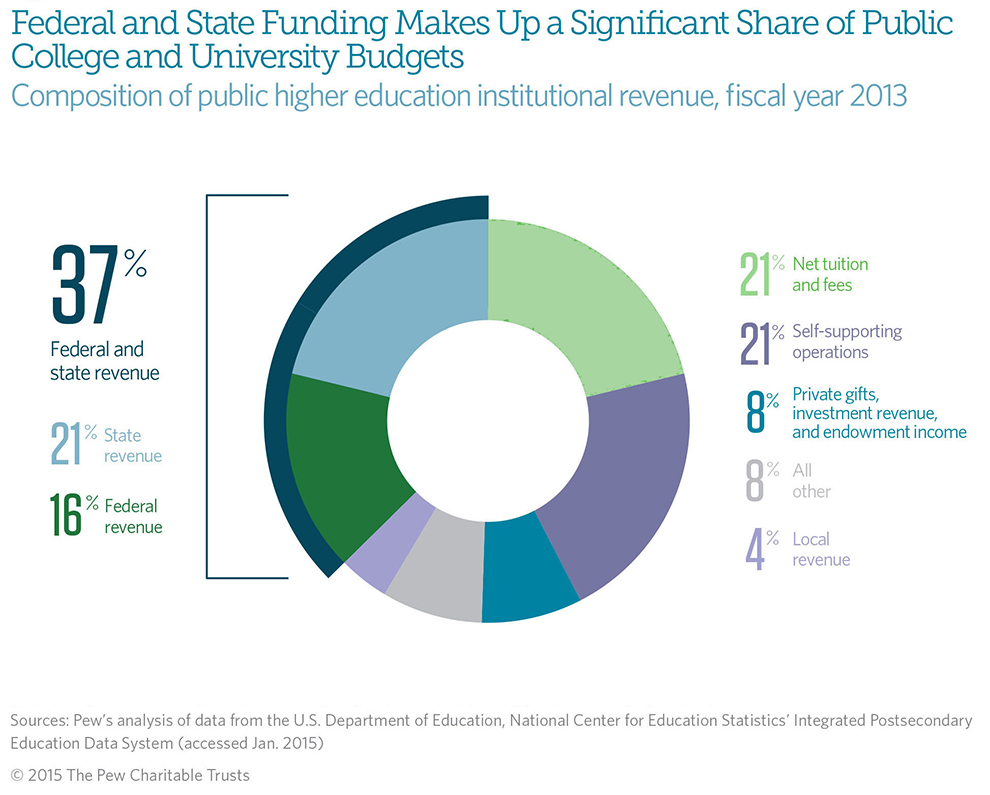
Public colleges and universities educate 68 percent of the nation’s postsecondary students. Ninety-eight percent of state and 73 percent of federal higher education funding flows to these institutions. Revenue from federal and state sources made up 37 percent of total revenue at public colleges and universities in 2013.
Figure 9
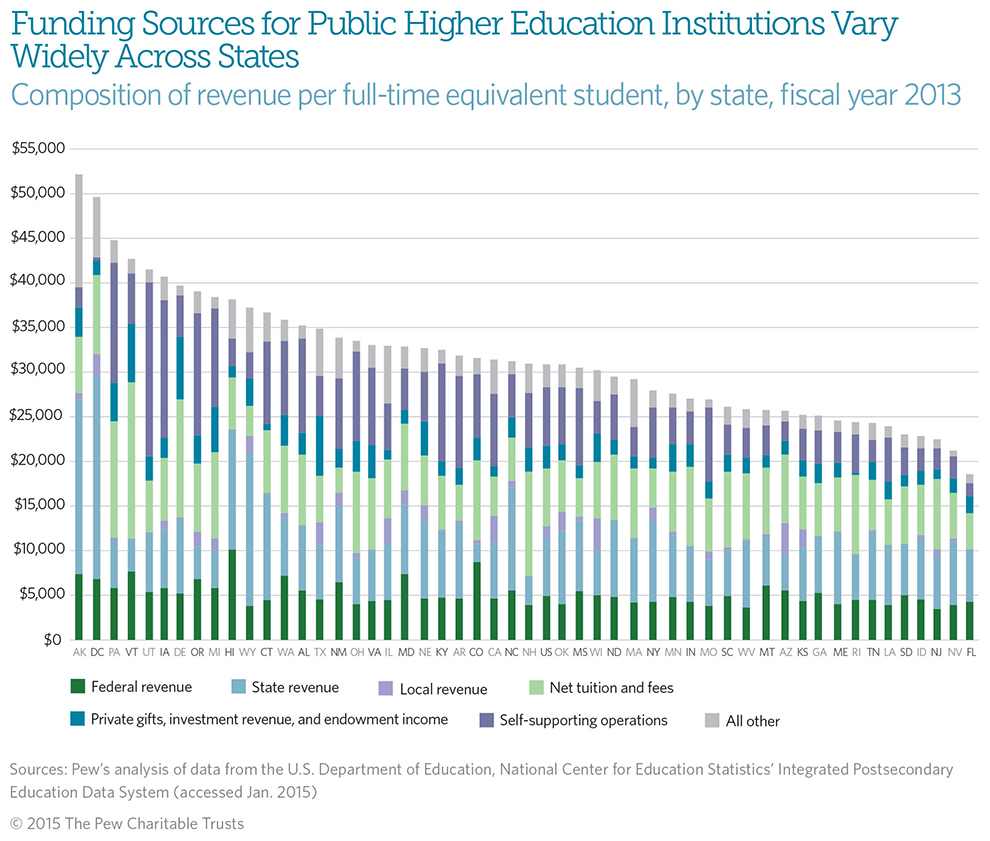
Click on the graphic to expand.
The total amount and mix of revenue used for higher education vary across states. Per-FTE-student revenue flowing to public institutions from federal sources ranges from $3,465 in New Jersey to $10,084 in Hawaii, and from state sources spans between $3,160 in New Hampshire and $19,575 in Alaska. Other elements, such as the amount of revenue from tuition, also differ.
Federal funding variation stems from differences in students’ financial needs and in the types of research conducted in each state, among other factors.
The range in state funding is due, in part, to policy choices regarding higher education. For example, North Carolina’s and Wyoming’s constitutions stipulate that public institutions should be as close to free as possible, and schools in both states receive above-average state revenue and below-average net tuition revenue.


ADDITIONAL RESOURCES

Video


