Changing Patterns in U.S. Immigration and Population
Immigrants slow population decline in many counties
Note: This issue brief was updated on December 19, 2014 to correct a reference that Mecklenburg County, NC, is home to Charlotte.
Overview
The U.S. Census Bureau projects that net international migration to the United States will become the primary driver of the nation’s population growth between 2027 and 2038.1 This brief examines current population trends among the foreign- and native-born at the county level, and highlights the role that immigrants play in contributing to population growth and slowing population loss. This analysis does not examine the merits of population change, but instead focuses on where it is occurring geographically. The Pew Charitable Trusts takes no position on federal, state, local laws or policies related to immigration.
Over the past 25 years, the total immigrant population has increased and spread across the country. In 1990, the foreign-born population was 19.7 million or 7.9 percent of the U.S. total, with nearly 3 out of 4 immigrants (73 percent) living in either California, Florida, Illinois, New Jersey, New York, or Texas.2 By 2010, approximately 40 million immigrants made up 13 percent of the overall population, and the proportion of immigrants residing in the six leading states dropped to 65 percent.3 Over that same time, other states including Nevada, North Carolina, and Washington experienced large growth in their foreign-born populations.4
An examination of county-level demographic data reveals how immigrants affected population change in specific regions of the country between 1990 and 2012. While the native- and foreign-born populations both grew across most of the United States during that period, there are some areas where the native-born population decreased. This brief illustrates how, in some places, an influx of foreign-born individuals slowed overall population loss and even reversed it. This is consistent with past research that has found that immigration continues to shape the country’s demography, particularly in newer immigrant destinations. The Chicago Council on Global Affairs has shown that immigration has mitigated population loss in the Midwest at the state level5 and in metropolitan areas.6 Researchers reported in the journal Rural Sociology that immigrants reduced population loss in nonmetropolitan counties during the 1990s.7 This brief updates and expands on previous research by providing a county-level analysis of the entire nation over two decades and presenting the demographic context for future research on the impact of immigration on state and local economies and budgets.
We find four key trends.
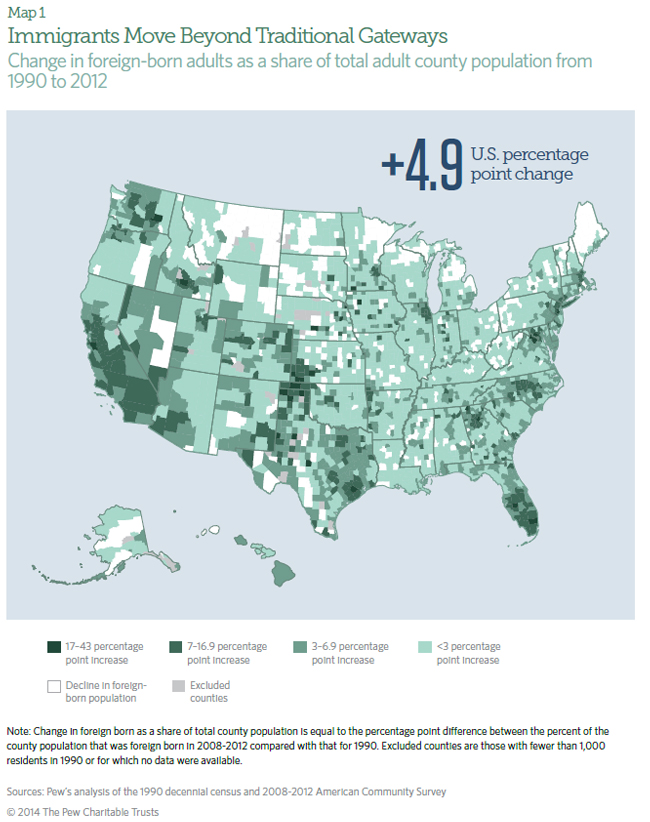
- Immigrants have moved beyond traditional gateways. Map 1 illustrates how growth in the foreign-born population has extended beyond traditional gateways—such as California, Florida, Illinois, New Jersey, New York, and Texas—into other areas of the United States, especially the Southeast and the Pacific Northwest.
- Native-born population has declined in Middle America. Map 2 shows that while the foreign-born population was increasing and dispersing, the native-born population was declining in certain areas of the country. This trend is most strongly observed in the middle of the United States.
- Immigration has driven population growth in the Sun Belt, Pacific Northwest, and Mountain States. Map 3 shows areas where the overall population has increased and how the foreign-born population has contributed to that growth. Increases in the number of immigrants have driven overall growth in many counties, particularly in the South and West.
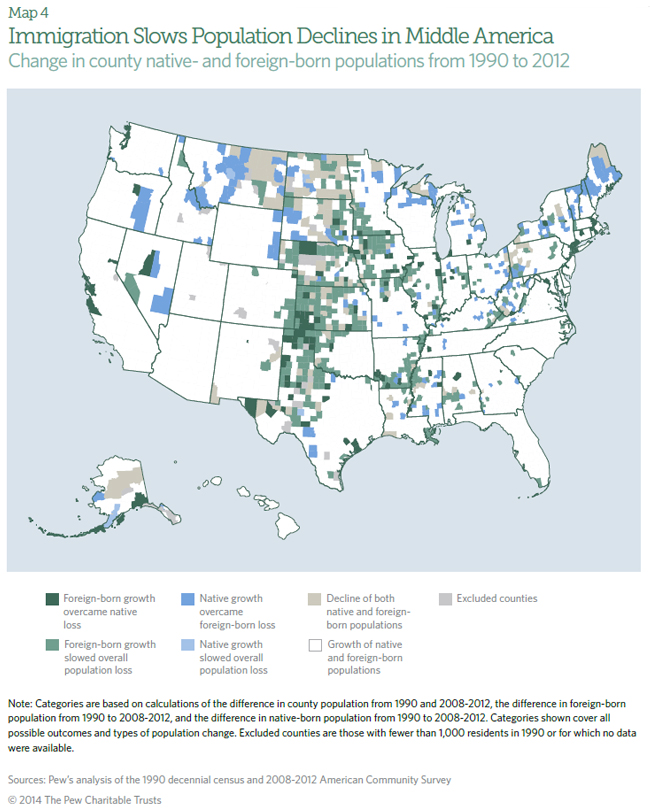
- Immigration has slowed population declines in Middle America. Map 4 illustrates the changes in foreign- and native-born populations and highlights areas where the growth of the foreign-born population has slowed overall decline and sometimes has overcome native-born losses for a net population gain.
This information is relevant for a number of reasons. In addition to having the potential to offset population decline in some areas of the country, immigrants can also compensate for the aging of the native-born population. The median age of the total U.S. population is rising,8 and the ratio of seniors (ages 65+) to working age people (ages 25-64) is increasing.9 Immigration mitigates these trends by adding working age adults to the U.S. population. Nearly half of immigrants admitted between 2003 and 2012 were between the ages of 20 and 40, while only 5 percent were ages 65 or older.10
The size and makeup of the U.S. population has important implications for economic productivity, taxation, and spending. Immigrants are already disproportionately represented in the labor force with a share of about 16 percent,11 while they make up about 13 percent of the overall population.12 The Pew Research Center has determined that if current immigration trends and birth rates continue, by 2050 virtually all (93 percent) of the nation’s working age population growth will come from immigrants and their U.S.-born children.13
Key Terms Used in This Brief
Foreign born: An individual who was not a U.S. citizen at birth or who was born outside the United States, Puerto Rico, or other U.S. territories and whose parents are not U.S. citizens. The terms “foreign born” and “immigrant” are used interchangeably throughout this brief.
Native born: Those who are U.S. citizens at birth, namely people born in the United States, Puerto Rico, or other U.S. territories and those born abroad to at least one parent who is a U.S. citizen.
Total population: Throughout this brief, “total” or “overall” population refers to the adult population 18 years and older.
From 1990 to 2012, the U.S. foreign-born population ages 18 or older increased by 19.3 million or 109 percent— from 17.7 million in 1990 to 37 million in 2012.14
Map 1 looks at counties and highlights those that have experienced an increase in the proportion of immigrants between 1990 and 2012. The darker the green, the larger the increase in the foreign-born proportion of the county’s population. The white areas are counties where the foreign-born population decreased between 1990 and 2012. It should be noted that the immigrant population both grew and spread out across the country faster in the 1990s than in the 2000s.15 This trend over time can be seen in Pew’s “U.S. Immigration: National and State Trends and Actions Overview,” released in September 2013, which shows state and national change in the foreign-born population from 1980 to 2010.16 Gray counties were excluded from the analysis because of small sample sizes.
As might be expected, states traditionally receiving immigrants such as California, Florida, New Jersey, and Texas have a large number of counties that experienced a sizeable increase in the foreign-born population as a percentage of total population (indicated by areas of dark green). For example, in Florida, the immigrant population grew from 1.5 million in 1990 to 3.4 million in 2012. Miami-Dade County experienced the state’s largest absolute growth in immigrants; more than 428,000, from 54 percent of the population in 1990 to 62 percent in 2012.
From 1990 to 2012, the U.S. foreign-born population ages 18 or older increased by 19.3 million or 109 percent.
But many states that have not traditionally been associated with immigration also experienced significant growth of their foreign-born populations. For example, the number in North Carolina grew from about 105,000 in 1990 to 651,000 in 2012. Mecklenburg County, which includes Charlotte, experienced the largest absolute increase in immigrants (102,000) of any county in the state. In 1990, the foreign-born population in Mecklenburg County was 16,000, representing 4 percent of the county’s total; by 2012, that figure was 17 percent (118,000).
In Washington, another new immigrant destination, the foreign-born population grew from just under 290,000 to 803,000 over the same period. King County, which includes Seattle, experienced the state’s largest absolute growth, from 127,000 to almost 364,000— from 11 percent of the county’s population to 24 percent. Adams County in central Washington experienced the highest percentage increase in the immigrant share of population in Washington, from 16 percent to 34 percent.
In Colorado, another new immigrant destination, the foreign-born population grew from 129,000 to 441,000. The northwestern counties of Lake and Garfield experienced the largest increases; Lake County’s foreign-born share of the population grew from 2 percent to 19 percent, and neighboring Garfield County’s grew from 3 percent in 1990 to 19 percent in 2012. Arapahoe County, just east of Denver, experienced the largest absolute growth in the foreign-born population in the state, adding 61,000—which represents a 12 percentage point increase in the share of the population.
In contrast, from 1990 to 2012, immigrants as a share of total county population shrank in the areas that appear white on Map 1. Notable declines occurred in parts of Maine, western Pennsylvania, West Virginia, eastern Ohio, and several states along the U.S.-Canada border.
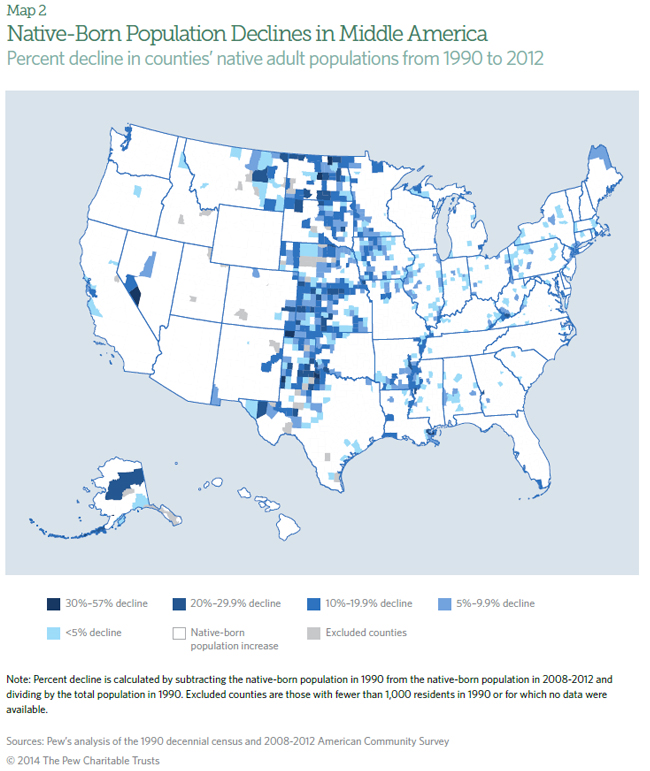
Between 1990 and 2012, the native-born population in the United States grew from 167 million to 198 million, or approximately 18 percent. But the view at the county level was more varied. While the native-born population increased across most counties (indicated by white) the native population declined in others because of outmigration and a higher death rate than birth rate. Map 2 highlights counties where the native-born population decreased between 1990 and 2012. The darker the blue, the greater the decline in the native-born population. Gray counties were excluded because of small sample sizes.
As Map 2 shows, the native-born population decreased in the counties running down the nation’s midsection, and along the Mississippi River in southern Arkansas and western Mississippi, as well as in some other isolated areas. Counties in the Great Plains that had relatively small populations to begin with lost a substantial portion of their native-born residents. Approximately two-thirds of counties in North Dakota, Kansas, and Nebraska experienced some decline in their native population; those counties had an average decline of 12 percent. The native populations of Motley, Cottle, Hall, and Foard counties in the Texas Panhandle also experienced a sharp percentage decline: Between 1990 and 2012, the number of native-born residents in the four counties shrank by 27 percent. In 1990 the combined population of these counties was just over 7,000, but by 2012 had dropped to less than 6,000.
The nativeborn population decreased in the counties running down the nation’s midsection, and along the Mississippi River in southern Arkansas and western Mississippi.
In Map 3, all counties in green experienced growth in both foreign- and native-born populations between 1990 and 2012. Gray counties have been excluded because of small sample sizes, and counties in white experienced a decline in the number of either foreign- or native-born residents, or both. The darker the green, the more the overall population gain was due to immigration.
Increases in this population played a large role in population growth in many traditional immigrant-receiving states such as California and New Jersey, and also helped drive growth in new immigrant destinations in the Southeast and Mountain States. In California counties where both populations grew, the foreign-born population accounted for an average of 43 percent of that increase. Fifty-two of the state’s 58 counties experienced growth in their foreign- and native-born populations. Los Angeles County had a net gain of 815,000 immigrants compared with only 83,000 additional natives. That means the foreign-born population accounted for 91 percent of the county’s growth from 1990 to 2012.
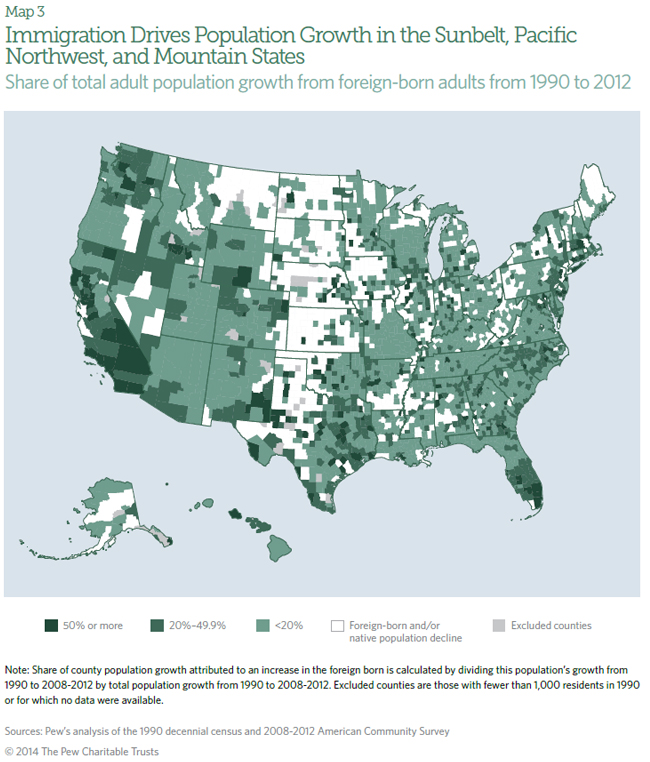
Several states not traditionally regarded as destinations for immigrants also saw substantial growth because of immigration, including Washington, North Carolina, Maryland, and New Mexico. In Maryland, 22 of 24 counties experienced growth in foreign- and native-born populations, with the former accounting for an average of 24 percent of growth. Immigration was especially pronounced in Prince George’s County in the suburbs of Washington, D.C., where the foreign-born population grew by about 100,000 and the number of native-born residents grew by less than 9,000. Immigrants accounted for 92 percent of the county’s growth from 1990 to 2012.
Map 4 highlights the counties where the foreign- and native-born populations changed either in similar or opposite directions. The green areas indicate counties where the immigrant population grew and the native population declined between 1990 and 2012. The blue areas indicate counties where the number of natives increased and the foreignborn population declined during this same period. The white areas indicate counties in which both the native- and foreign-born populations increased (see Map 3 for more detail), while the tan areas indicate the counties where the native- and foreign-born both decreased.
In a swath of counties running down the middle of the country, the native population declined while the foreign-born increased.
Growth of both groups between 1990 and 2012 was most common in counties in the Southeast and the Southwest, while decline in both populations was most common in counties in the Upper Midwest. Map 4 highlights one trend in particular: In a swath of counties running from the Dakotas to the Texas Panhandle, and in the southeastern corner of Arkansas, the native population declined while the foreign-born increased. In the counties indicated by light green, the growth of the foreign-born did not fully replace native-born loss, but the population would have declined even more if not for the growth of the immigrant population. In the dark green counties, the overall population increased because the growth of immigrants more than made up for native-born loss, a trend that is seen in the middle of the country and other parts of the Midwest.
Conclusion
Understanding the impact of immigration on demographic change is vital to analyzing the economic and fiscal effect immigrants have on states and localities. This brief provides an overview of how changes in the native- and foreign-born populations have interacted to create distinct patterns in many areas of the country.
In most counties across the nation the native- and foreign-born populations increased between 1990 and 2012, resulting in overall growth. In a very small number of counties, both groups declined. Most notably, in a large area of the center of the United States, many counties experienced native-born population loss and foreign-born gain. Many of these counties still experienced an overall loss of people, but the population would have declined even more if not for an influx of immigrants. This analysis provides necessary context for further research into the economic and fiscal effects of these demographic changes.
Methodology
Data Sources. For data on the foreign- and native-born populations in 1990 we used the decennial census.17 For data on these populations in 2012, we used estimates from the 2008-2012 American Community Survey, which is the most recent data available at the time the analysis was conducted.18
Focus on adult population. In order to focus on the impact of immigration on population change, the under-18 population is excluded from the populations of both time periods. Children of immigrants in this country are born as U.S. citizens and counted in the native-born category, thus contributing to native-born population change. Excluding those under 18 years old made it possible to avoid overestimating the effect on native population growth from the native-born children of immigrants. All children born to immigrants after 1990 who had reached age 18 by 2012 are included in the estimated adult native-born population in the 2008-2012 data. For this reason, the adult native population in 2008-2012 may be slightly higher because it likely includes these children of immigrants. Eliminating the under-18 population from the data at both ends of the timeframe greatly reduced this overestimation.
As a result, the maps largely reflect net change of the foreign-born population due to international migration, movement from county to county within the United States, or mortality. Similarly, the change in the native-born population is primarily due to internal movement, a limited degree of international movement (when natives return from abroad), and deaths. Limiting the data to the population ages 18 and older greatly minimizes the degree to which births contribute to population change and emphasizes the effect on population from movement and deaths.
Margin of error. County populations vary widely from millions to only a few hundred, and estimates are potentially unreliable whenever sample sizes are small. This can affect calculations of foreign- and native-born populations and any estimated changes over time. Focusing only on the adult population reduces the sample size even more. To address these concerns and improve the reliability of our analysis, counties with fewer than 1,000 residents over 18 years of age in 1990 were excluded. These counties accounted for less than 1.5 percent of the dataset.19
Drawing conclusions about any specific county from these data is discouraged. Evaluated nationally, however, the county data demonstrate regional trends, and the clustering of multiple counties with similar outcomes strongly suggests underlying patterns.
Acknowledgments
The immigration and the states project team would like to thank Audrey Singer, a senior fellow at the Brookings Metropolitan Policy Program, and Rob Paral, principal of Rob Paral and Associates, for their assistance with this brief. Although they have reviewed it, neither they nor their organizations necessarily endorse its findings or conclusions.
Endnotes
- U.S. Census Bureau, “International Migration is Projected to Become Primary Driver of U.S. Population Growth for First Time in Nearly Two Centuries,” press release (2013), accessed July 30, 2014, http://www.census.gov/newsroom/press-releases/2013/cb13-89.html.
- The Pew Charitable Trusts, “U.S. Immigration: National and State Trends and Actions” (November 2013), http://www.pewtrusts.org/en/multimedia/data-visualizations/2013/national-and-state-trends-and-actions-overview.
- Ibid.
- Ibid.
- Rob Paral and Associates, Native and Immigrant Population Change 2000-2008, “US Economic Competitiveness at Risk: A Midwest Call to Action on Immigration Reform,” report of an Independent Task Force, The Chicago Council on Global Affairs (2013), 26, http://www.thechicagocouncil.org/sites/default/files/2013_ImmigrationTaskForce_Final.pdf.
- Rob Paral, “Growing the Heartland: How Immigrants Offset Population Decline and an Aging Workforce in Midwest Metropolitan Areas,” The Chicago Council on Global Affairs, June 2014, http://www.thechicagocouncil.org/sites/default/files/GrowingHeartland_June2014.pdf.
- Katharine M. Donato et al., “Recent Immigrant Settlement in the Nonmetropolitan United States: Evidence From Internal Census Data,” Rural Sociology 72, no. 4 (2007), 538, http://www.actionresearch.illinois.edu/courses/FAA391_Spring12/Donato_2007.pdf.
- Dowell Myers, “The Contribution of Immigration to Reducing Aging in America: Application of the Senior Ratio to Census Projections,” Public Policy & Aging Report 22, no. 2 (Spring 2012), 3, http://ppar.oxfordjournals.org/content/22/2/1.2.full.pdf+html.
- Ibid., 5.
- Bipartisan Policy Center, “Immigration: America’s Demographic Edge,” Immigration Task Force, Staff Paper, (Jan. 2014), 7-8, http://bipartisanpolicy.org/sites/default/files/ImmigrationDemographic.pdf.
- Bureau of Labor Statistics, U.S. Department of Labor, News Release: “Foreign-Born Workers: Labor Force Characteristics, 2013” (May 22, 2012), 2, http://www.bls.gov/news.release/archives/forbrn_05222013.pdf.
- U.S. Census Bureau, American Community Survey. Selected Social Characteristics in the United States, 2012 1-Year Estimates (DP02), http://factfinder2.census.gov/faces/tableservices/jsf/pages/productview.xhtml?src=bkmk.
- Pew Research Center, “Second-Generation Americans: A Portrait of the Adult Children of Immigrants.” Social & Demographic Trends (Feb. 7, 2013), 2, http://www.pewsocialtrends.org/files/2013/02/FINAL_immigrant_generations_report_2-7-13.pdf.
- American Community Survey 2008-2012: 5-Year Estimates, “Sex by Age by Nativity and Citizenship Status” (B05003), http://factfinder2.census.gov/faces/tableservices/jsf/pages/productview.xhtml?src=bkmk; U.S. Census Bureau, Population Division, Ethnic and Hispanic Branch, “1990 Age, Nativity, and Citizenship for the United States, States and Counties CPH-L-114,” 1990 Special Tabulations, accessed Feb. 24, 2014, http://www2.census.gov/prod2/decennial/documents/1990/CPH-L-114.pdf.
- The Pew Charitable Trusts, “U.S. Immigration.”
- Ibid.
- U.S. Census Bureau, Population Division, Ethnic and Hispanic Branch, “1990 Age, Nativity, and Citizenship.”
- American Community Survey 2008-2012: 5-Year Estimates, “Sex by Age by Nativity and Citizenship Status.”
- In 1990, there were 3,142 counties and county equivalents. By 2012, the borders changed in the following four counties such that calculations of population change across time were not possible: Prince of Wales-Outer Ketchikan, Skagway-Yakutat-Angoon, and Wrangell-Petersburg in Alaska and Yellowstone National Park, Montana. Virginia is home to independent cities that function as counties, and they are identified as counties in this report. However, the two independent cities of South Boston and Clifton Forge were subsumed into neighboring counties in 1995 and 2001, respectively. To make 1990 and 2008-2012 data comparable, 1990 residents of South Boston were added to Halifax County and those of Clifton Forge to Alleghany County. Lastly, some territory from the Colorado counties of Adam, Boulder, Jefferson, and Weld were reapportioned in 2001 to create Broomfield County. However, even with this change, these four counties’ foreign- and native-born populations grew from 1990 to 2008-2012. Broomfield County was not included in our analysis because it did not exist in 1990. Similarly, Denali Borough, Alaska, was not included as it was incorporated in 1990 and not accounted for in the 1990 decennial census.

ADDITIONAL RESOURCES

Video


