Federal Grants as Share of States' Budgets Decline After Historic High

Federal Grants as Share of States Budgets Decline After Historic High

Note: An updated version of this analysis featuring fiscal year 2014 data is available here.

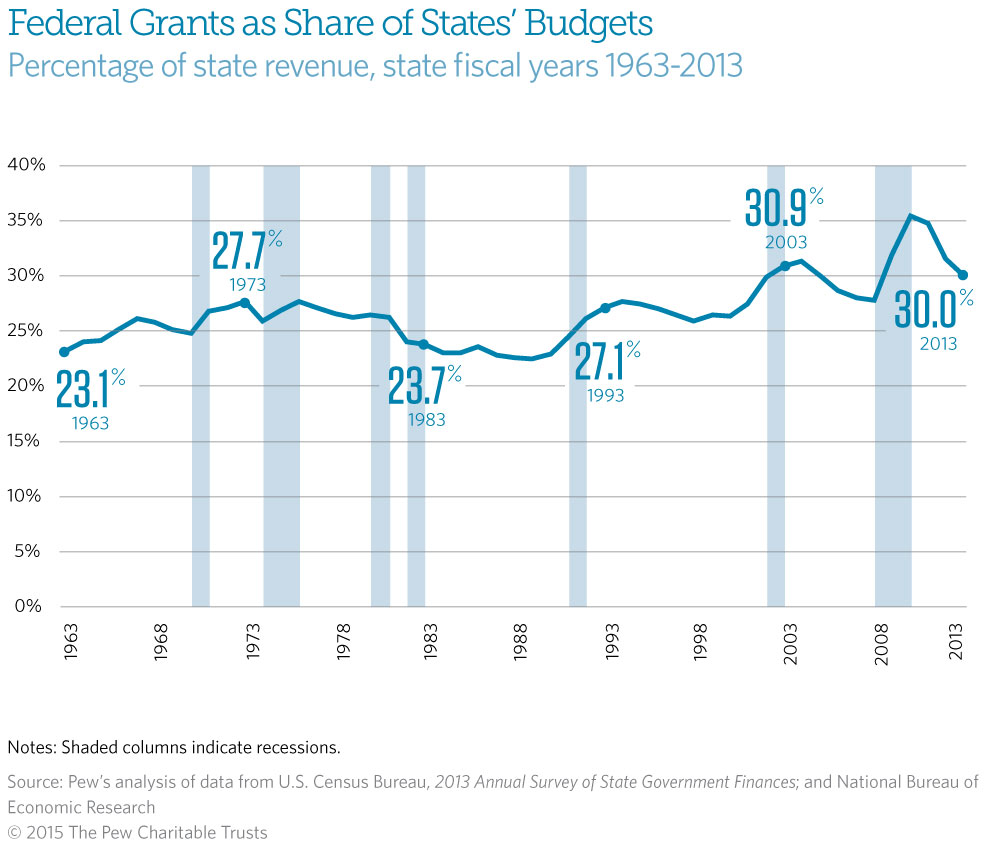
After the Great Recession, the share of states’ revenue coming from federal grants hit a historic high of 35.5 percent in 2010. Increased federal dollars from economic stimulus funds and reduced state tax collections meant that federal dollars made up a bigger proportion of states’ revenue than at any time in at least 50 years. After tapering off slightly in 2011, the percentage of states’ revenue coming from the federal government fell steeply starting in 2012, dropping to 30 percent by 2013—the result of both the continued recovery of other state revenue sources and the expiration of most stimulus funding.

Despite the recent drop, federal grants as a percentage of state revenue remain high by historical standards, providing nearly $1 out of every $3 in state revenue in 2013.

Spotlight on Mental Health

Composite image of modern city network communication concept

Learn the Basics of Broadband from Our Limited Series

Sign up for our four-week email course on Broadband Basics

Quick View

How does broadband internet reach our homes, phones, and tablets? What kind of infrastructure connects us all together? What are the major barriers to broadband access for American communities?

What Is Antibiotic Resistance—and How Can We Fight It?

Sign up for our four-week email series The Race Against Resistance.

Quick View

Antibiotic-resistant bacteria, also known as “superbugs,” are a major threat to modern medicine. But how does resistance work, and what can we do to slow the spread? Read personal stories, expert accounts, and more for the answers to those questions in our four-week email series: Slowing Superbugs.

Explore Pew’s new and improved
Fiscal 50 interactive

Your state's stats are more accessible than ever with our new and improved Fiscal 50 interactive:

  • Maps, trends, and customizable charts
  • 50-state rankings
  • Analysis of what it all means
  • Shareable graphics and downloadable data
  • Proven fiscal policy strategies

Explore

Welcome to the new Fiscal 50

Key changes include:

  • State pages that help you keep track of trends in your home state and provide national and regional context.
  • Interactive indicator pages with highly customizable and shareable data visualizations.
  • A Budget Threads feature that offers Pew’s read on the latest state fiscal news.

Learn more about the new and improved Fiscal 50.