The Geographic Distribution of the Mortgage Interest Deduction
Overview
Policymakers continue to debate how to reduce the federal budget deficit and how to simplify the federal tax code. One point on which there seems to be emerging agreement is that reducing or eliminating tax expenditures could contribute to one or both efforts.
The mortgage interest deduction allows tax filers who own a home and itemize their deductions to subtract interest paid on mortgage debt from their gross income. In tax year 2011, filers deducted about $360 billion in mortgage interest, resulting in roughly $72 billion in forgone federal income tax revenue. Only two federal tax expenditures were larger that year. In years past this deduction has often ranked second behind the exclusion for employer-provided health insurance.
Wide variation across and within states
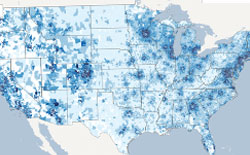
Using detailed ZIP code-level data for the first time — along with state-level data — this report shows that mortgage interest deduction claims vary widely not just across states but across areas within the same state:
-
The percentage of tax filers deducting mortgage interest ranged from nearly 35 percent in Maryland to 14 percent in South Dakota.*
-
The average mortgage interest deduction for all tax filers (not just those taking the deduction) varied from a high of $4,193 per tax filer in Maryland to a low of $1,118 per filer in North Dakota.
-
The variation across metropolitan areas within states is even greater. In Texas, for example, the state's highest claim rate — in the Austin area — was 4 times larger than the lowest rate, in the Odessa area. The Austin area's average deduction per filer was over 6 times the average in the Odessa area.
Changes to current policy would affect states
If the deduction were modified or eliminated, the geographic distribution of the benefits would likely change — meaning tax filers in certain states, or areas within a state, would pay higher, or lower, federal income taxes than under current policy. This could affect economic activity both across and within states, and indirectly affect state and local revenues. The actual impact on any given area would depend on how any changes were structured.
Policy makers should be aware of the geographic implications of changes in federal tax policy as debates over federal deficit reduction and tax reform move forward.
*State figures have been updated with 2011 data and differ slightly from the 2010 data presented in the published overview and report.
Claim Rates Across States
2011

2010

Average Deduction Amounts Across States
2011

2010

Claim Rates Across ZIP Codes

Average Deduction Amounts Across ZIP Codes

Distribution Across North Carolina

Distribution Across Pennsylvania

Distribution Across Texas

ADDITIONAL RESOURCES


