Out of Balance: A Look at Snack Foods in Secondary Schools across the States
How healthy are the snack foods sold in secondary schools via vending machines, school stores and snack bars? A recent report on snack foods published by the Kids' Safe and Healthful Foods Project—a collaboration between The Pew Charitable Trusts and the Robert Wood Johnson Foundation—suggests the issue could be more than bite-sized.
Introduction
Since 1980, rates of childhood overweight and obesity have tripled. While several factors have contributed to this, the bottom line is that many children are eating more calories than they burn, with a significant quantity of these calories consumed during the school day.1 Overweight children and adolescents are at an increased risk of health problems, including cardiovascular disease, depression, high blood pressure, type 2 diabetes, breathing problems, sleep disorders, and high cholesterol.2-7
Many schoolchildren consume up to half of their calories at schools, and school foods and beverages can have a significant impact on children's diets and weight. In addition, the availability of snack foods progressively increases by school level.8 Half of secondary school students consume at least one snack foodi a day9 at school, an average of 273 to 336 calories per day. This amount is significant considering that an excess of 110 to 165 calories per day may be responsible for rising rates of childhood obesity.10
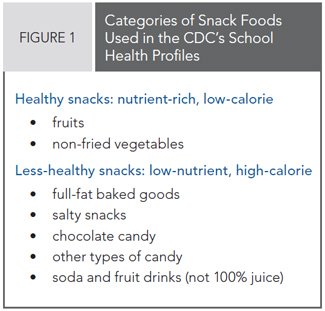
The Kids' Safe and Healthful Foods Project—a collaboration between The Pew Charitable Trusts and the Robert Wood Johnson Foundation—recently analyzed data on the types of snack foods and beverages sold in secondary schoolsii via vending machines, school stores, and snack bars (see Figure 1). The data set was extracted from the Centers for Disease Control and Prevention's (CDC) School Health Profiles 2010: Characteristics of Health Programs Among Secondary Schools in Selected U.S. Sites—a biennial assessment that uses surveys of principals and lead health education teachers to measure health policies and practices in secondary schools on a state-by-state basis across the nation.iii (See Appendix 1 for more information on the methodology of this report.)
Ensuring that schools sell nutritious foods is critical to improving children's diets. Evidence shows that strong nutrition standards for snack foods sold in schools reduce students' weight gain.11 Furthermore, the availability of low-nutrient, high-calorie snack foods during the school day is associated with increased intake of calories,12, 13 and decreased intake of fruits and vegetables among students.14, 15 Even small changes to students' school-based diets—like replacing a candy bar with an apple—may reduce their risk of tooth decay, obesity, and chronic illness through decreased calorie, fat, and sugar intake.
KEY FINDINGS
Key Findings
1. Nationally, the availability of snack foods in secondary schools varies tremendously from state to state. For example, only 4 percent of the schools in Connecticut sell non-chocolate candy, while 66 percent of the schools in Louisiana do so. In Idaho, 46 percent of secondary schools sell chocolate candy, but only 2 percent of schools in West Virginia do so. Variation also exists regarding the availability of fruits and vegetables(see Appendices 2 and 3). And, while less-healthy beverages such as soda and fruit drinks are available in fewer than half of schools in most states, the variation among states is still quite large—only 3 percent of the schools in West Virginia sell them, while more than half do so in Utah. This variation is likely the result of a disparate patchwork of policies at the state and local levels. While the majority of states have a policy in place that addresses snack foods in schools, the quality of these policies varies. Additionally, fewer than 5 percent of school districts have food and beverage policies that meet or exceed the 2010 Dietary Guidelines for Americans (DGA).
 2. Under this patchwork of policies, the majority of our nation's children live in states where less healthy
snack food choices are readily available. In nearly three-quarters of the states, a substantial percentage of schoolsv sell low-nutrient, high-calorie snacks such as chocolate, other candy, or full-fat salty chips. Indeed, only two states (West Virginia and Rhode Island) have limited availability of chocolate candy, other candy, full-fat salty snacks, and baked goods in snack food venues; fewer than 10 percent of their schools sell these items.
 3. Overall, the availability of healthy snacks such as fruits and vegetables is limited (see Figures 2 and 3). The vast majority of secondary schools in 49 states do not sell fruits and vegetables in snack food venues. Among states and the District of Columbia, the median percentage of schools that sell fruit in school stores, snack bars, or vending machines is 28 percent. In 34 states and the District of Columbia, fewer than one-third of secondary schools sell fruits as an option in school stores, snack bars, or vending machines. In addition, the median percentage of schools selling vegetables in snack food venues is 19 percent. In 46 states and the District of Columbia, fewer than one-third of secondary schools sell vegetables in snack venues.
4. When states don't differentiate between more- and less-healthy snacks, the overall snack food environment suffers. When schools group all snack foods together without distinguishing between healthy and less-healthy items, efforts to make nutritional modifications can have contradictory results. In other words, reducing all snack foods limits the availability of both healthy (fruits and vegetables) and less-healthy (candy and soda) snacks. Indeed, nine states, including the District of Columbia, rank in the bottom half of those selling both healthy and less-healthy snack foods. Conversely, 11 states have a high availability of both types of snacks.
5. While many secondary schools reduced the availability of less-healthy snack foods between 2002 and 2008,17 progress has since stalled. For example, from 2002 to 2008, Oklahoma made significant progress in reducing the number of schools selling chocolate candy—down from 81 percent to 46 percent. However, there was only a two percentage point reduction from 2008 to 2010. Furthermore, between 2008 and 2010, four states (Hawaii, Kentucky, Nevada, and Pennsylvania) showed a more than five percentage point increase in the number of schools selling chocolate candy, other candy, or salty snacks (see Appendices 4, 5, and 6). Only five states expanded the availability of fruits by at least five percentage points (Idaho, Minnesota, Mississippi, Montana, and Washington) and just three did so for vegetables (Nevada, North Dakota, and Washington) (see Appendices 7 and 8).
RECOMMENDATIONS
Recommendations
Based on a comprehensive analysis of the data included in this report, findings from our earlier HIA, and related research, the Kids' Safe and Healthful Foods Project urges USDA to issue science-based nutrition standards for all foods and beverages served and sold in schools. The project makes the following recommendations.
Recommendations 1:
USDA should establish nutrition standards for all snack foods sold regularly on school grounds outside of the school meal programs. For secondary schools, these standards should include:
- a requirement that schools sell healthier items from the Dietary Guidelines for Americans list of foods to encourage;
- age-appropriate calorie limits for items sold individually;
- a maximum total calorie limit on sugar and fats;
- incremental reductions in sodium over 10 years to achieve full alignment with the Dietary Guidelines • for Americans; and
- restrictions on calories and serving size for all beverages.
Recommendations 2:
USDA should adopt policies and practices that ensure effective implementation of the standards. At a minimum, USDA should:
- ensure that nutrition standards are kept up to date with future iterations of the Dietary Guidelines for Americans; and
- collaborate with states and nongovernmental organizations to monitor the implementation of the standards and share the results publicly.


