The State Pension Funding Gap: 2014
New accounting rules help provide a clearer picture
 © Getty Images
This brief focuses on the most recent comprehensive data from all 50 states and does not reflect the impact of weaker investment performance in fiscal 2015.
Overview
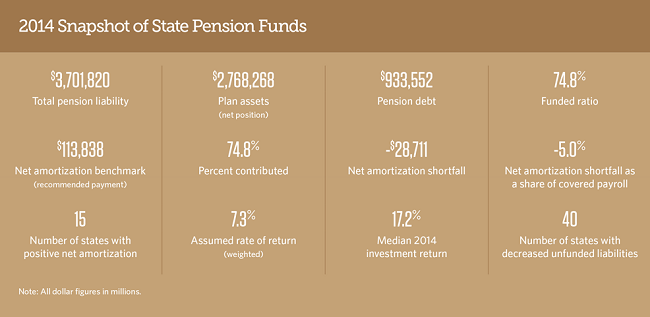
The nation’s state-run retirement systems had a $934 billion gap in fiscal year 2014 between the pension benefits that governments have promised their workers and the funding available to meet those obligations. That represents a $35 billion decrease from the shortfall reported for fiscal 2013. The reduction in pension debt was driven primarily by strong investment results, with public plans in fiscal 2014 averaging a 17 percent rateof return.1
This brief focuses on the most recent comprehensive data from all 50 states and does not reflect the impact of weaker investment performance in fiscal 2015, which averaged 3 percent. Performance has been even weaker in the first three quarters of fiscal 2016. Preliminary data from fiscal 2015 point to increases in unfunded liabilities for the majority of states. Total pension debt is expected to be over $1 trillion for state plans, an increase of more than 10 percent from fiscal 2014.
When combined with the shortfalls in local pension systems, this estimate reaches more than $1.5 trillion for fiscal 2015 and will likely remain close to historically high levels as a percentage of U.S. gross domestic product (GDP). The lesson here is that state and local policymakers cannot count solely on investment returns to close the pension funding gap over the long term; they also need to follow funding policies that put them on track to pay down pension debt.
These data follow new standards from the Governmental Accounting Standards Board (GASB), the independent organization recognized by governments, the accounting industry, and capital markets as the official source of generally accepted accounting principles for state and local governments. As of June 15, 2014, GASB required governments to report pension debt as a net pension liability (NPL) on their annual balance sheets and to disclose more details on the cost of new pension benefits earned by current workers. In addition, some poorly funded plans must now use more conservative assumptions when calculating pension liabilities for reporting purposes.3
Under the new rules, reporting on pensions is more closely tied to general accounting standards, rather than to plans’ individual funding policies. In particular, plans are no longer required to report the actuarial required contribution, known as the ARC, which had been the most common metric for assessing contribution adequacy.4 Although most plans have continued to include the ARC as a supplemental disclosure—or produced a similar metric known under the new GASB standards as the actuarially determined contribution (ADC)—these measures are based on each plan’s own assumptions and do not always signal true fiscal health. The Pew Charitable Trusts did not include those calculations in this brief because the ARC is not consistently available and the ADC does not have to meet minimum standards. Neither metric on its own provides sufficient information to evaluate the policies that states are following to fund their pension promises.
The analysis also looks at net amortization, a new 50-state metric that can help state and local governments understand whether their funding policies are adequate to reduce pension debt. Net amortization serves as a benchmark to assess contribution policies and helps gauge whether payments to a pension plan are sufficient, both to pay for the cost of new benefits and to make progress on shrinking unfunded liabilities. The calculation is based on the assumptions that plans use to determine liability and estimate long-term investment returns; it also accounts for employee contributions, given that workers in most states contribute to pensions.
What Is Net Amortization?
Net amortization measures whether total contributions to a public retirement system would have been sufficient to reduce unfunded liabilities if all expectations had been met for that year. The calculation uses the plan’s own reported numbers as well as assumptions about investment returns. Plans that consistently fall short of this benchmark can expect to see the gap between the liability for promised benefits and available funds grow over time.
Under this new metric, states that follow contribution policies that are sufficient to pay down pension debt if plan assumptions are met are achieving positive amortization. States where contributions allow the funding gap to continue to grow are facing negative amortization. The analysis in this brief shows that 15 states currently follow policies that meet the positive amortization benchmark—exceeding 100 percent of needed funding—and can be expected to reduce pension debt in the near term. The remaining 35 states fell short; those performing the worst on this measure typically had the largest unfunded pension liabilities.
While 40 states reported decreased unfunded liabilities in 2014, only a small number met the positive amortization benchmark because the calculation is based on the long-term assumptions that plans use to set funding policy, including expectations for the rate of return on investments. In the short term, states experienced stronger-than-expected investment returns, which helped reduce reported pension debt. However, investment returns vary widely over time, and most governments that sponsor pension plans made contributions that were not large enough to reduce debt based on expected long-term rates of return.
New accounting standards spotlight poorly funded plans
The new disclosure rules require that state balance sheets now include the net pension liability, which is the difference between pension plan assets, reported as plan net position, and total pension liability. Net pension liability is essentially the pension debt, or unfunded liability, for that plan. All plans now calculate assets based on the market value of investments on the reporting date, rather than smoothing investment gains and losses over time, which had previously been allowed. This means that the 2014 results fully reflect the impact of strong market gains. Going forward, reported asset values will be more volatile from year to year. For example, funded levels are projected to decline for fiscal 2015 because the average returns of 3 percent were well below plans’ long-term return targets.
In addition, the new standards now require certain plans with low funded ratios to report pension liabilities using more conservative investment return assumptions. (See Appendix B for a more detailed explanation.) So far, this new requirement has had an impact on only eight of the 100 largest state-sponsored pension plans. Looking at restated 2013 results, this accounts for about $72 billion in increased reported pension liabilities and pension debt in total. Plans in Illinois and New Jersey, along with the Kentucky Teachers’ Retirement System and the Texas Employees Retirement System, account for over 90 percent of this amount.5
The new rules also require that all public pension plans use the same methodology to calculate liabilities. Previously, state pension plans could choose from multiple approaches, though most had been using the approach that is now required.6
Primarily because of market gains, the state pension funding gap dropped in 2014, the first decline in reported pension debt since 2000. Lower investment returns in 2015, however, indicate that pension debt will increase when valuations for that year are complete.
The volatility in investment returns between 2014 and 2015 demonstrates that states cannot rely on higher-than-expected returns to eliminate unfunded liabilities. Pew’s net amortization analysis provides a benchmark for measuring the sufficiency of contributions based on long-term investment return assumptions. This analysis shows that states in aggregate fell short of the net amortization benchmark by $29 billion in 2014.
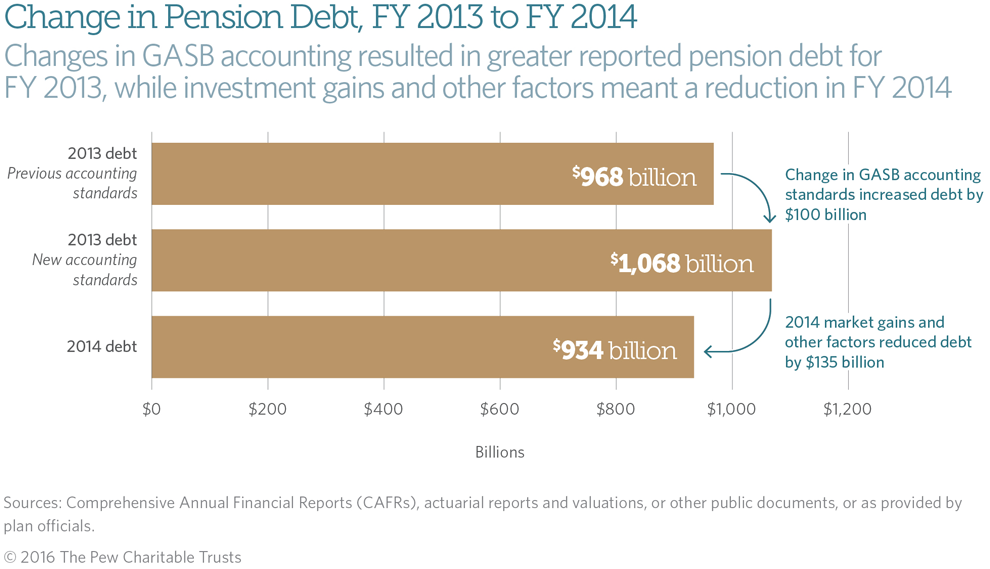
Figure 2 shows the impact that changes in accounting standards had on total reported pension debt in 2013 as well as the effects of investment gains and other factors in 2014.
Figure 2
While these new standards are required for all plans, most continue to report information using the previous standards as well. The prior rules allowed plans to report assets smoothed over multiple years and did not require the use of more conservative assumptions to report liabilities, as described above. In this analysis and going forward, Pew will use data reported under the most recent set of GASB standards because they provide a standardized point of comparison across plans and reflect the most up-to-date industry standards, consistent with our past work and the most recent government accounting guidelines.
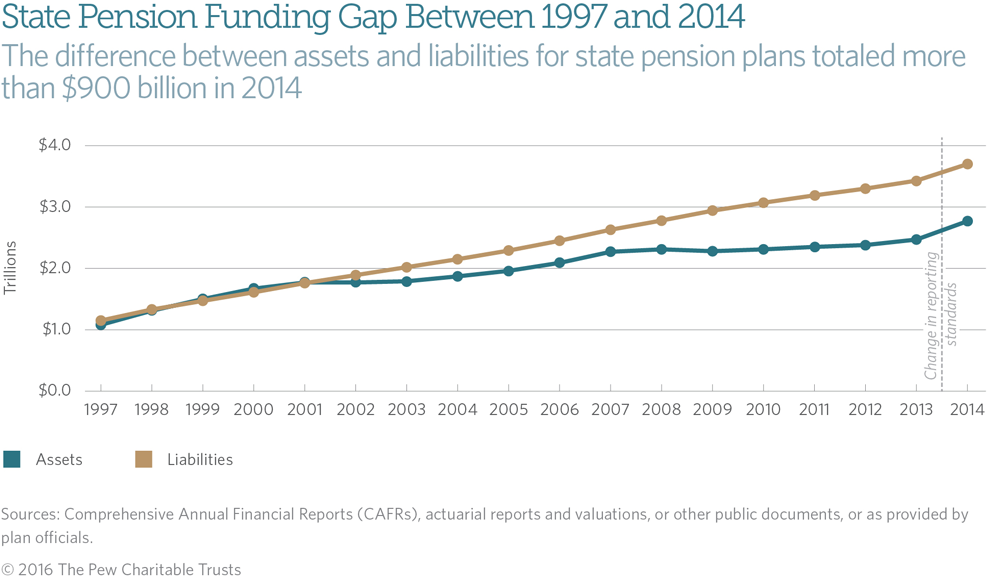
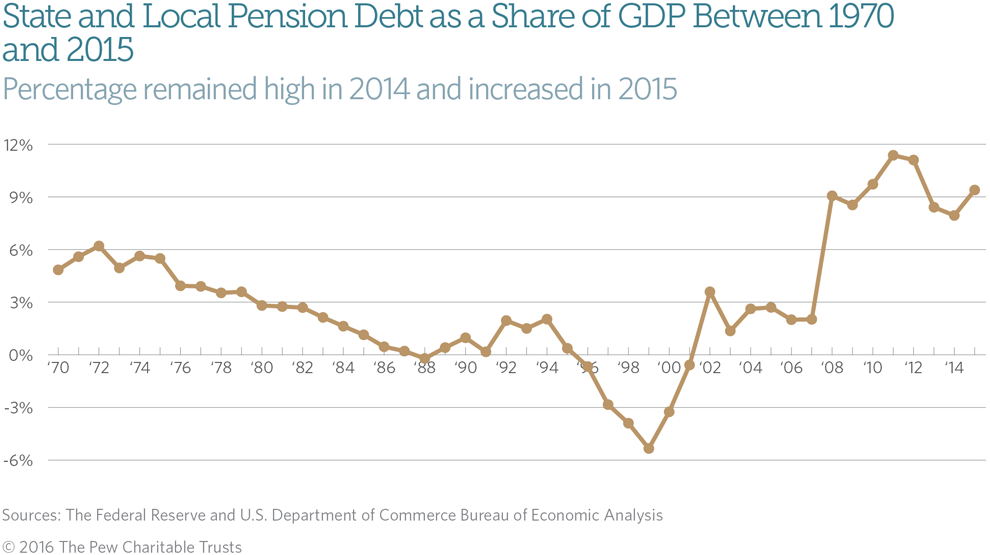
Figure 3 shows trends in aggregate assets and liabilities since 1997. Fiscal 2014 data reflect the new reporting standards, which use the market value of assets and a different method for calculating liabilities. Figure 4 shows total state and local pension debt as a share of GDP.
Figures 3 and 4
New data provide for better measures of plan health
The new disclosure requirements under GASB allow for improved analysis of plan contribution policies compared with previously available data. Before the change, most researchers, including Pew, had to rely on the ARC asa means of comparison. But meeting contribution targets based on this reporting standard never ensured that states and cities were actually paying down their pension debts.
The new data included in public pension financial statements allow for measurement of whether an employer’s contribution policy achieves net amortization. That is the level at which employers’ annual contributions to a plan are sufficient to pay for the cost of new benefits in that year as well as offset any projected growth in pension debt after netting out employee contributions.7
The National Association of State Retirement Administrators (NASRA) accurately notes that using net amortization may not always recognize funding policies that are sustainable and that could reduce pension debt over the long term.8 However, for states following policies expected to address unfunded liabilities, thenet amortization benchmark can help pension plan sponsors measure progress. In addition, Moody’s Investors Service’s latest analysis of contribution policies follows a very similar approach in terms of measuring whether states reduced unfunded pension liabilities in the current budget year. The Society of Actuaries Blue Ribbon Panel also noted the importance of contribution polices that pay down pension debt over a fixed time period.9
Plan administrators also point out that the numbers disclosed under GASB rules will often differ from those that drive contribution policies. Most notably, GASB requires plans to report assets on a market basis, but plans’ funding policies typically calculate contributions using asset smoothing to recognize gains and losses over time. Other differences can affect liabilities, but these are expected to be limited. For instance, the discount rate requirements under the new GASB rules affect only a select number of troubled plans. Additionally, most plans were already calculating their liabilities using an entry age actuarial method—which takes into account workers’ likely pay increases in calculating pension costs—as required for new GASB disclosures.
Any credible approach to achieving full funding of pension promises needs to pay down pension debt over a reasonable time frame. Prior to this year, GASB standards provided state pension plans with significant leeway in calculating the ARC, which allowed for contribution policies that fell short of this goal. For example, these standards allowed states to reset the maximum 30-year payoff schedule annually. This approach may provide near-term budget relief, but it allows pension debt to grow and costs more in the long run. Because of its limitations, the ARC proved to be a minimum reporting standard rather than a model approach for pension funding.
The net amortization measure assesses the results of contribution policies without taking into account unexpected gains and losses. If plan assumptions are correct, plans receiving contributions meeting the net amortization benchmark will have their unfunded liabilities shrink. Pew’s analysis shows that most state pension plans didn’t receive sufficient contributions to meet this benchmark in 2014.
It is important to note that the net amortization calculation does not use the same discount rate for all plans—it relies on plans’ own individually chosen assumptions. Plans with higher assumed rates of return will have lower estimated costs of benefits, and that will lower the benchmark for positive amortization.
There is still no single measure of plan fiscal health, but effective contribution policies eventually achieve positive amortization. Along with funded ratios and supplemental disclosures on funding policy—including ARC calculations—net amortization provides an important benchmark for states and cities to consider.
Figure 5 shows each state’s net amortization as a share of covered payroll, the total salaries paid to current employees.
Figure 5
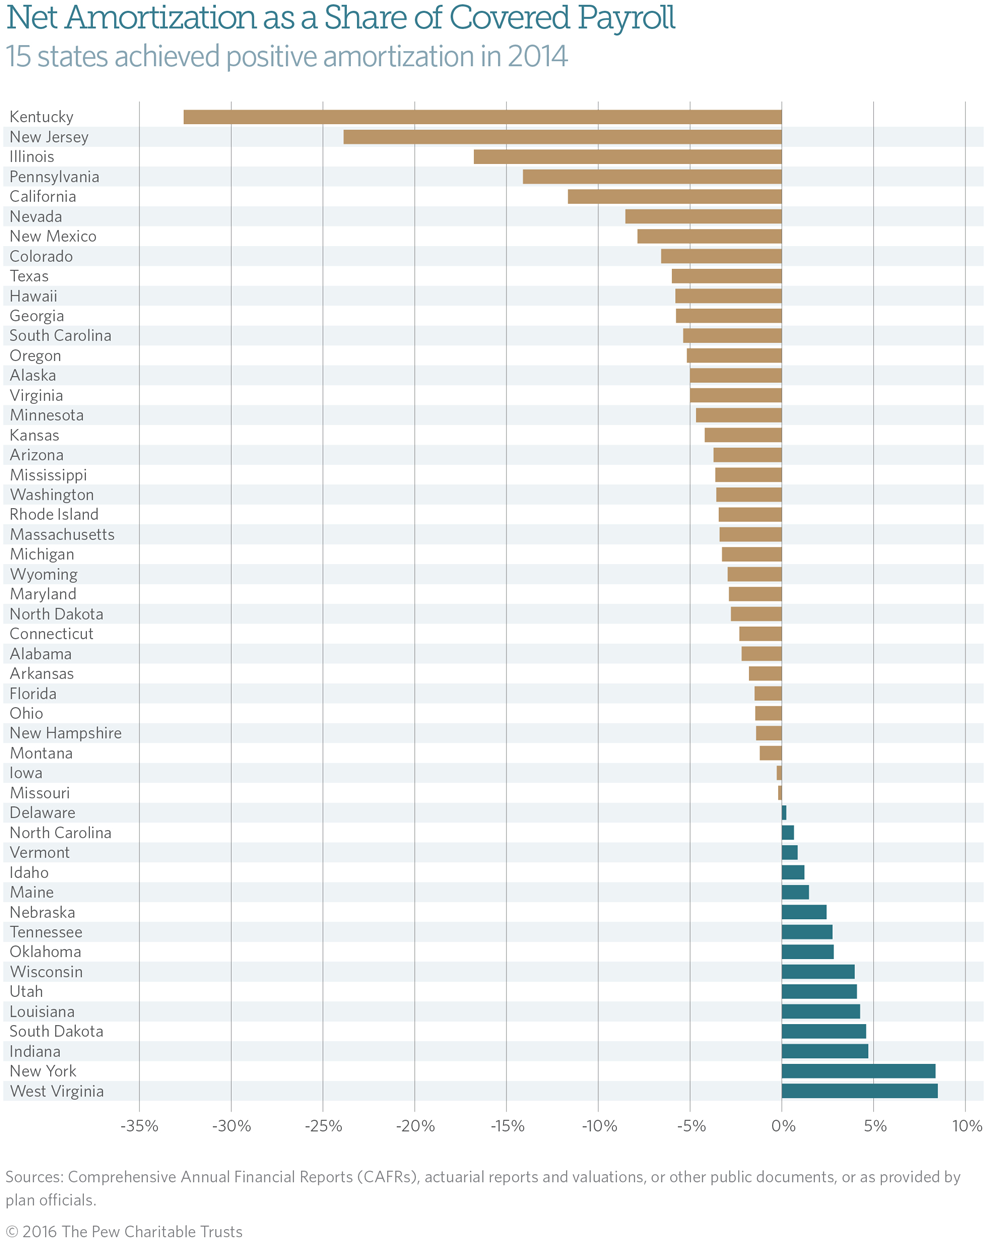
Net amortization provides fuller picture of contribution policy
Net amortization provides policymakers a clear picture of the effectiveness of a state’s contribution policy in terms of paying down pension debt in the near term. The data show that many states are not contributing enough to their pension funds to reduce unfunded liabilities—including some states that have paid the full ARC. The new net amortization benchmark provides a better assessment of contribution policies than prior measures did.
Under the new metric, Kentucky, New Jersey, Illinois, and Pennsylvania experienced the largest negative amortization, when adjusted by covered payroll. Plans in these states face significant challenges and have low funded ratios. And without the strong overall investment returns in 2014, net amortization shows that these states would have lost further ground. All four also fell short of paying what would have been the full ARC in 2014. Pennsylvania, however, has committed to large and steady increases in contributions, and is projected to reach positive amortization by 2018.
Of the 10 states with the strongest results on positive amortization, seven have historically paid about 95 percent of ARC. But this group includes three states—Nebraska, Oklahoma and Louisiana—that reported paying less than full ARC payments in recent years. Still, the three continued making progress in reducing pension debt.
Oklahoma’s performance reflects a 2011 change to cost of living adjustments (COLAs). After that policy change, the state’s current contribution policy was adequate to pay down the remaining pension debt. Louisiana sets higher standards than typical state pension plans in calculating its actuarial contribution. As a result, even though the state fell short of full ARC funding in 2012 and 2013, its contributions were enough to make progress on paying for pension debt in 2014. Nebraska’s numbers were driven by contribution timing as well as changes to the state’s contribution policy in 2013. Pew’s research indicates that most states with contribution policies sufficient to pay down pension debt used more conservative approaches targeted at reducing unfunded liabilities compared with states that failed to meet net amortization.
In other cases, states and participating local governments made full ARC payments but still fell short of reducing their pension debt because they followed 30-year payment plans that were refinanced annually. Alabama and Arizona, for example, have historically set actuarial contribution rates based on approaches that would not make progress on paying down pension debt. As a result, while both states paid every dollar that plan actuaries asked for, their unfunded liabilities increased and their funding rank relative to other states declined. Both states’ pension plans have recently changed contribution policies, with a goal of hitting positive amortization over time.
Low funding levels make it harder for states to make progress. Those with larger unfunded pension liabilities require substantially higher contributions to pay down debt because they generate less in the way of investment earnings. Connecticut is only 50 percent funded, but the state’s current contribution policies, which include a fixed amortization period to pay off the unfunded liability, are anticipated to start reducing debt in fiscal 2017. The state has made progress by increasing payments every year; in 2014, it made the highest contributions relative to payroll of all but three states.
Connecticut’s pension funds assume relatively high 8 percent returns, which means that the current policy is sustainable only under risky assumptions. This example shows the difficulties that face a fiscally challenged state trying to pay down pension debt, as well as how a state can improve funding policies over time.
Elsewhere, Virginia shows how states that recently adopted more responsible funding policies might not pay down pension debt immediately, though they will close their funding gaps over time. In 2013, the Virginia Retirement System (VRS) board adopted a stronger funding policy to pay off the unfunded liabilities over a fixed time period, a method known as a closed amortization schedule.10 State policymakers also enacted legislation to make full actuarial contributions by 2018.
West Virginia stands apart as having made the most progress on pension funding, increasing its funded ratio from 40 percent to 78 percent from 2003 to 2014. West Virginia has averaged payments equal to 95 percent of the ARC or higher for a decade, as have 21 other states, but it has followed a more aggressive funding policy than many of its peers. Tracking net amortization highlights the importance of analyzing how actuarial contributions are set.
Looking at net amortization allows policymakers to better compare contribution policies by measuring outcomes rather than inputs, using a consistent formula for liabilities and using the market value of assets. However, plans still use a range of investment return assumptions under which higher assumed rates of return lead to the reporting of lower liabilities and costs.
Looking forward: Measuring and managing cost uncertainty
Net amortization assesses what happens under current policy if everything goes as expected. However,in providing a fixed benefit, public employers take on a variety of risks—in particular, investment risk. In calculating the fiscal sustainability of a pension plan, looking at different scenarios in what is called sensitivity analysis or stress testing gives a more complete picture of future pension costs and projected pension debt.
The new GASB rules include some sensitivity analysis: Plans are required to estimate liabilities based on projected returns 1 percentage point above or below their assumed rate of return.11 The Society of Actuaries commissioned a Blue Ribbon Panel to issue recommendations on pension funding and governance, which included a more detailed stress testing approach.12 Finally, states such as California and Washington have taken the lead by publishing sensitivity analyses on their public pension plans to assess their fiscal sustainability under multiple investment scenarios. Given the importance of risk in understanding pension plans’ fiscal condition, Pew will be working to incorporate stress testing and sensitivity analysis into future reports on state pension funding levels.
Conclusion
The gap between the pension benefits that state governments have promised workers and the funding to pay for them remains significant. Many states have enacted reforms in recent years to help shrink that divide, but they also have benefited from strong investment returns.
Over the long term, however, these returns are uncertain. In addition, many states have not made contributions that would reduce plan debt under expected returns. New tools, such as net amortization, stress testing, and sensitivity analysis, provide policymakers with additional information to better evaluate the effectiveness of their policies and ensure that plans can achieve full funding over time—and that pension promises can be kept.
Appendix A: Methodology
All figures presented are as reported in public documents or as provided by plan officials. The main data sources used were the Comprehensive Annual Financial Reports (CAFRs) produced by each state and pension plan, actuarial reports and valuations, and other state documents that disclose financial details about public employment retirement systems. In total, Pew collected data for over 230 pension plans. Because of lags in financial reporting, fiscal 2014 is the most recent year for which comprehensive data are available for all 50 states.
Pew assigns funding data to a year based on the valuation period, rather than when the data are reported. Because of the lags in valuation in many state pension plans, only partial 2015 data are available.
Each state retirement system uses different key assumptions and methods in presenting its financial information. Pew makes no adjustments or changes to the presentation of aggregate state asset or liability data. Assumptions underlying each state’s funding data include the expected rate of return on investments and estimates of employees’ life spans, retirement ages, salary growth, marriage rates, retention rates, and other demographic characteristics.
While the accounting rules dictate how pension data must be estimated for reporting purposes, state pension plans may use different actuarial assumptions or methods for the purpose of calculating contributions. The new GASB rules have increased the number of state plans that produce two sets of estimates, though a number of plans did so prior to the rule changes as well. Pew has consistently used reported data based on public accounting standards in order to have comparable information on plan funding. A few plans did not report data under the new GASB standards and were excluded—in total, these plans are expected to represent 0.02 percent of the liabilities of all plans.
Determination of retirement systems for inclusion in data collection
The pension systems included are those listed in the state CAFR in which the state is a sponsor, administrator, employer, or funder. Local pension systems with no direct state involvement are not included.
Net amortization
Calculation of a plan’s net amortization starts with the employer contribution benchmark:
Employer contribution benchmark = service cost plus interest on the prior year’s debt minus employee contributions (with interest).
Net amortization = employer and other contributions (with interest) minus the employer benchmark.
This metric is a point of reference for employer contributions, so employee contributions are netted out from total contributions and the growth in pension debt. Measuring net amortization by comparing total contributions against total growth in pension debt without contributions would be mathematically identical.
Pew added a half-year’s interest (details on the rate used are below) in calculating contributions. While plans differ in the timing of contributions, Pew assumed that contributions were made midyear to have a consistent adjustment across plans. One-time contributions in 2014 also may be included.
To get normal cost, Pew took the “service cost” data from the Schedule of Changes in Net Pension Liability.
To calculate the interest accrued on the prior year’s net pension liability, Pew used the beginning of period liabilities and assets in the Schedule of Changes in Net Pension Liability to determine the unfunded liability at the end of 2013. Pew multiplied this result by the interest rate (details on the rate used are below) to get the interest on the prior year’s debt.
Interest rate methodology
For most plans, Pew used the 2014 blended rate calculated under new GASB rules. If the plan changed the assumed rate of return from 2013 to 2014, Pew looked at plan documents to see if the plan disclosed the discount rate used to calculate 2013 liabilities, and used that rate, if available.
The assumed rate of return reflects plans’ anticipated earnings on investments. While a plan’s actual return on assets will differ from the assumptions, Pew uses the assumed rate of return because market returns are volatile from year to year, and because the assumed rate of return reflects the plan’s assumptions in setting funding policy. Additionally, Pew calculates the interest on the unfunded liabilities to reflect the cost over time of carrying the debt; the assumed rate of return is what plans used to discount liabilities over time.
Example of net amortization calculation
North Carolina and South Carolina both made the full ARC contribution toward their pension funds in 2013. Their 2014 data show how the actual impact on plan funding can vary based on the underlying contribution policy. This also allows a walk-through of how Pew calculates this metric.
North Carolina’s seven pension plans had a combined $7.47 billion in pension debt at the beginning of 2014. Weighting the seven plans’ return assumptions by liability results in an effective interest rate for that pension debt of 7.3 percent. That means the effective interest on the debt, or the expected growth in debt before contribution policies, is $540 million for 2014. In addition, the service cost—the cost of new benefits earned in 2014—for North Carolina’s pension plans was $2.23 billion. That means that North Carolina’s pension plans needed $2.78 billion in total from employers and employees to keep pension debt from growing.
Employee contributions plus interest in 2014 equaled $1.22 billion, so the employer benchmark was $1.55 billion. The state and participating local governments’ contributions plus interest were $1.69 billion, meaning that North Carolina’s contribution policies were expected to reduce pension debt by about $140 million. Because the state’s pensions are relatively well-funded, most of the contributions go toward paying for new benefits, rather than paying for past pension promises.
South Carolina also makes the full actuarial contribution for its five pension plans. The state’s pension debt was $20.22 billion as of the beginning of 2014, and the effective interest rate was 7.5 percent. Based on that, the funding gap was projected to grow by $1.52 billion in 2014. The service cost was reported as $900 million, so without factoring in contributions, the state’s funding gap would grow by $2.41 billion because of the cost of new benefits and the increase in existing pension debt.
South Carolina also makes the full actuarial contribution for its five pension plans. The state’s pension debt was $20.22 billion as of the beginning of 2014, and the effective interest rate was 7.5 percent. Based on that, the funding gap was projected to grow by $1.52 billion in 2014. The service cost was reported as $900 million, so without factoring in contributions, the state’s funding gap would grow by $2.41 billion because of the cost of new benefits and the increase in existing pension debt.
In 2014, South Carolina public employees paid $780 million—including interest—to these five pension plans, leaving the employer benchmark at $1.63 billion. Employer payments plus interest totaled $1.18 billion, leaving about a $450 million shortfall between what went into South Carolina’s pension plans and what was needed to keep the funding gap from growing.
Appendix B: New GASB Requirements
Until now, most analyses gauging public pension funding policies relied heavily on how well states made their actuarial required contribution (ARC). Starting with the reporting of 2014 data, new GASB standards will require additional data that policymakers can use to supplement the ARC and to evaluate the fiscal health of plans, as well as whether their policies are sufficient to reduce pension debt.
Public pension plans now must report liabilities using a standardized actuarial cost method, to clearly state the cost of new benefits earned that year by employees, and to disclose investment returns in a consistent fashion that allows them to be compared with other plans. In addition, for the first time, unfunded pension liabilities must be included in state and local government balance sheets and presented as net pension liabilities. Reportingof these net liabilities is based on the market valuation of assets rather than smoothing investment gains and losses over time. These changes create greater uniformity and make direct comparisons between plans easier. Standardized reporting based on market values also means that reported figures will be more volatile and that the next market downturn will cause an immediate drop in pension funding levels.
The standards also require plans to calculate the discount rate—the rate used to convert future benefit payments into current dollars—using a blended rate. Prior to the new rules, plans used the assumed rate of return on their investments as their discount rate. Under the new GASB rules, if plans are projected to run out of assets, they must use a blended rate, which uses the assumed rate of return, for years when the plan is expected to have funding set aside, and a lower, pay-as-you-go rate for years when the plan is projected to have run out of assets and presumably would fund benefits out of the general budget. This change affects very few plans, since most are not projecting to run out of assets; however, for the plans it does affect, the change can be significant.
Appendix C: Glossary
Actuarially determined contribution (ADC). A contribution requirement for plan sponsors set by each plan based on actuarial methods and practices. The ADC does not have to comply with the minimum standards used in calculating the actuarial required contribution as defined by GASB.
Actuarial required contribution (ARC). Using plans’ own economic and demographic assumptions, the ARC calculation includes the expected cost of benefits earned for the current year and an amount to reduce some of the unfunded liability. Under prior rules, the ARC calculation included in governmental financial statements had to conform to GASB standards, but it is no longer a required disclosure.
Entry age normal. Entry age normal calculates pension liabilities after accounting for future salary increases. Projected unit credit, the second most common actuarial method used in the public sector, does not build future salary increases into the pension liability calculation and will generally result in a lower calculated liability compared with entry age normal.
Funded ratio. The level of assets in proportion to accrued pension liability.
Net amortization. A measure of whether funding policies in force in state and local governments are sufficient to reduce pension debt in the near term.
Normal cost. The cost of benefits earned by employees in any given year. Also called service cost.
Pension debt/unfunded liabilities. The difference between the total value of pension benefits owed to current and retired employees or dependents and the plan assets on hand. This is an unfunded obligation for past service. The data reflect the GASB standards in effect at the time. Before 2014, the data represent the unfunded actuarial accrued liability. In 2014 and after, this is the net pension liability. Pension plans with assets greater than accrued liabilities show a surplus.
Acknowledgment
This work is funded in part by The Pew Charitable Trusts with additional support from The Laura and John Arnold Foundation.
Endnotes
- Median data from Wilshire Trust Universe Comparison Service, June 30, 2014, compiled for The Pew Charitable Trusts.
- Median data from Wilshire Trust Universe Comparison Service, March 31, 2016, compiled for The Pew Charitable Trusts.
- Governmental Accounting Standards Board, “Statement No. 67 of the Governmental Accounting Standards Board: Financial Reporting for Pension Plans” (June 2012): v, 15–17, 19–20, http://www.gasb.org/jsp/GASB/Document_C/GASBDocumentPage?cid=1176160220594&acceptedDisclaimer=true.
- Ibid., 54.
- There were 26 plans affected by this rule in total. The eight most affected of the 100 largest state-sponsored plans are the Illinois State Employees’ Retirement System and State Universities Retirement System; the Kentucky Teachers’ Retirement System; the Minnesota State Employees Retirement Fund; the New Jersey Public Employees’ Retirement System, Teachers’ Pension and Annuity Fund, and Police and Firemen’s Retirement System; and the Texas Employees Retirement System.
- The required actuarial method is called entry age normal, which accounts for future salary increases when calculating pension liabilities. Projected unit credit, the second most common actuarial method used in the public sector, does not build future salary increases into the pension liability calculation and will generally result in a lower calculated liability compared with entry age normal.
- Pension liabilities will grow every year by the assumed rate of return. Pension plan assets are expected to grow at the same rate, so a fully funded plan is expected to stay that way if contributions are made and assumptions are met. For a plan with an unfunded liability, the funding gap is also expected to grow by the assumed rate of return. This can be thought of as the equivalent of “interest” on accumulated pension debts.
- National Association of State Retirement Administrators, letter to Moody’s Investors Service, Oct. 8, 2014, http://www.nasra.org/files/Letters/NASRAtoMoodys100814.pdf.
- Moody’s Investors Service, “New Pension Accounting Increases Clarity of Plan Funding Trajectories” (March 2015); and Moody’s Investors Service, “Robust 2014 Investment Returns Provide Pause in Growth of Adjusted Net Pension Liabilities” (Jan. 15, 2016). The Society of Actuaries report recommends amortization periods of 15 to 20 years for unfunded pension liabilities, which is generally consistent with achieving positive amortization. See Society of Actuaries, “Report of the Blue Ribbon Panel on Public Pension Plan Funding” (February 2014), https://www.soa.org/blueribbonpanel.
- Public pension plans have three basic ways of setting a payment schedule for their unfunded liabilities: closed amortization, open amortization, and layered amortization. A closed schedule is like a typical mortgage—over a fixed period of time; annual payments are set that will pay the debt by the end of the time frame. An open amortization schedule similarly calculates payments based on a set period but annually resets the payment schedule back to year one. An open amortization schedule can lead to a payment plan where the debt never actually gets paid off. Virginia Retirement System previously followed an open amortization method. A layered amortization schedule records gains and losses for each year and pays them off on a separate closed schedule.
- Governmental Accounting Standards Board, “Statement No. 67,” 15.
- Society of Actuaries, “Report of the Blue Ribbon Panel,” 24–25.


ADDITIONAL RESOURCES

Article


