Worker Benefits—and Their Costs—Vary Widely Across U.S. Industries
Many factors influence what is offered and what employers spend
 © The Pew Charitable Trusts
Overview
The financial well-being of American families is fundamentally driven by the labor market and the relationships workers have with their employers. In 2013, the most recent year for which data are available, 83 percent of tax filers reported income from an employer.1 However, the contribution employers make to household financial security goes beyond wages and salaries to include benefits, including paid leave, retirement plans, health insurance, and nonhealth insurance such as disability, that are designed to help workers manage and prepare for financial challenges.
Along with pay and working conditions, the availability of benefits contributes to the quality and desirability of jobs and for many years has been an important thread in the fabric of the employment relationship.2 Benefits, of course, come at a cost that is typically shared by workers and employers and although each addition or improvement to the package offered raises those costs, many employers choose to provide them in an effort to align with norms in their industry, be competitive in recruiting and retaining high-quality employees, and demonstrate their commitment to worker well-being.3
Employers remain central to the nation’s system of private and social insurance.4 Most people who have health insurance and retirement savings plans get them through their workplaces.5 Researchers have long tracked the evolution of the relationship between employer and employee,6 and recent analyses suggest that benefits are a key indicator for shifting workplace relations.7
But the data on the type of benefits provided today and the price businesses pay for them are not widely accessible. This brief fills that gap using the latest available data from the Bureau of Labor Statistics’ National Compensation Survey to examine which benefits different types of employers provide and which factors influence the costs. The analysis found, broadly, that two employers offering the same benefit might pay different amounts, and two workers earning the same wage could, owing to benefits, have radically different levels of total compensation. The key findings include:
- Employers provide workers with a wide array of benefits beyond pay. Workers’ access varies by the type of benefit, but the median job has benefits that cost the employer 38 cents for each dollar spent on wages.
- Employers spend the most on wages, nonhealth forms of insurance, and legally required benefits. The typical employer spends far more on wages than on benefits. At the median, employers spend the most on short- and long-term disability and life insurance and on state- and federally mandated benefits, such as Social Security.
- Employer spending varies dramatically within categories. Benefit costs are influenced by many factors, including the quality of the benefit provided, the size and type of employer, and the type of job each worker holds.
- Benefit offerings and spending vary substantially by industry. Employers in mining and extraction and those in utilities spend significantly more on benefits than those in other sectors. In contrast, employers in low-paying sectors such as retail provide few benefits and spend relatively little on them.
- Establishment size and spending on benefits do not consistently correlate.
- Jobs with higher pay also tend to have more expensive benefits. Each additional dollar of average hourly pay is associated with another 67 cents per hour in employer spending on benefits.
- Benefits spending creates substantial variation in total compensation among workers earning the same pay. A quarter of those making about $15 per hour receive less than $4.02 in benefits, but another quarter get more than twice that amount.
This brief examines these findings in depth, focusing on overarching patterns of benefit provision because of the importance of benefits to workers and the enormous variation in offerings and costs across employers. Differences also emerge when the data are viewed by industry, worker wage, and establishment size, but discussing every instance of variation is beyond the scope of this analysis. To supplement the findings, The Pew Charitable Trusts developed an interactive tool, available at http://www.pewtrusts.org/en/multimedia/data-visualizations/2016/how-do-us-workplace-benefits-differ, that allows users to explore how industry, establishment size, and level of pay affect the benefits available to workers in different jobs, how much their employers pay to give them those benefits, and the variation in benefit provision and employer cost for industries and establishments of interest.
Background
Employers in the United States incur costs to provide their employees with benefits. At a minimum, employers pay for a set of legally required benefits, including Social Security, Medicare, state and federal unemployment insurance, and workers’ compensation. Many employers also choose to offer their workers an array of additional benefits. The data capture establishment spending on benefits but do not address how workers perceive benefits or the role of benefits in workers’ financial lives.
Most employees see employer-provided benefits as important for their financial well-being and prefer benefits to equivalent increases in pay. In the 2014 Survey of American Family Finances—a Pew-commissioned, nationally representative survey examining how diverse families were faring in today’s economy—98 percent of workers with employer-provided health insurance described it as important to their households’ financial security. Although the benefits are quite different, rates for retirement plans and paid leave were similar. Further, when a subset of respondents were offered a hypothetical choice between receiving health and retirement benefits or a pay increase equivalent to money their employers spent on those benefits, more than three-quarters said they preferred to receive the benefits.8
About the Data
Data in this brief come from the March 2014 National Compensation Survey’s (NCS’) Employer Costs for Employee Compensation under an agreement between Pew and the U.S. Bureau of Labor Statistics (BLS). The NCS is a panel survey of employers operating in the United States and covers all jobs in the American labor force excluding federal and agricultural workers. The primary sampling unit is an “establishment”—that is, a single location where business is conducted, such as a single grocery store rather than a firm, which would include the legal entity as a whole and all of the locations where it does business.
This analysis is restricted to private sector establishments, including those from for-profit and nonprofit employers and excluding state and local government jobs. Each sampled establishment reported to the BLS on a number of randomly selected jobs based on the number of workers it usually employs.* If two jobs at an establishment were at different levels and in different occupations, the reported benefits packages and their costs could vary substantially. The NCS’ approach to data collection yields a nationally representative set of jobs in the American economy for a specific economic quarter.
Notably, although small establishments, which are defined by the number of employees, are greater in number nationally, larger ones predominate in these data because most jobs in the economy are found at worksites with 50 or more employees. Nevertheless, because the data include almost 44,000 private sector jobs and capture the full diversity of benefits and pay that employers provide those workers, they support a robust examination of the benefits offered to specific subgroups of employees. This analysis uses industries as identified by the North American Industry Classification System.† The data cover 18 industries.
Throughout this paper, employer costs are expressed in dollars per hour an employee works, which facilitates the comparison of benefit and salary costs across diverse schedules and pay arrangements. In addition, benefits are grouped into six categories indicated by the data: paid leave, supplemental pay, health insurance, nonhealth insurance (such as life insurance and short- and long-term disability), retirement, and legally required benefits (such as Social Security and unemployment).
* If a worker is on vacation or otherwise temporarily away from work when the data are collected, that person’s job could still be selected for inclusion in the data.
† The NAICS groups industries and offers several levels of detail (https://www.census.gov/eos/www/naics). This analysis uses two-digit NAICS codes, describing broad industry sectors.
Though most demographic subgroups shared this preference for the benefit over the pay increase, it was notably stronger among those whose households already received the benefit, compared with those who lacked it. For example, with regard to health insurance, 87 percent of workers with coverage would opt for the benefit, compared with 60 percent of those not covered.
These findings show how highly workers value their benefits and confirm that most workers—particularly those accustomed to having them—view benefits as different from and contributing other value to household financial well-being than pay.
Employers provide workers with a wide array of benefits beyond pay
Identifying the full array of benefits that employers may offer their workers is a key first step in understanding how benefits might contribute to the financial well-being of workers. Figure 1 shows the percentage of U.S. jobs that offer each type of benefit. (See the supplemental tables, available at http://www.pewtrusts.org/sitecore/~/media/Assets/2016/07/US_worker_benefits_supptables.xlsx, for a full explanation of each benefit type.)
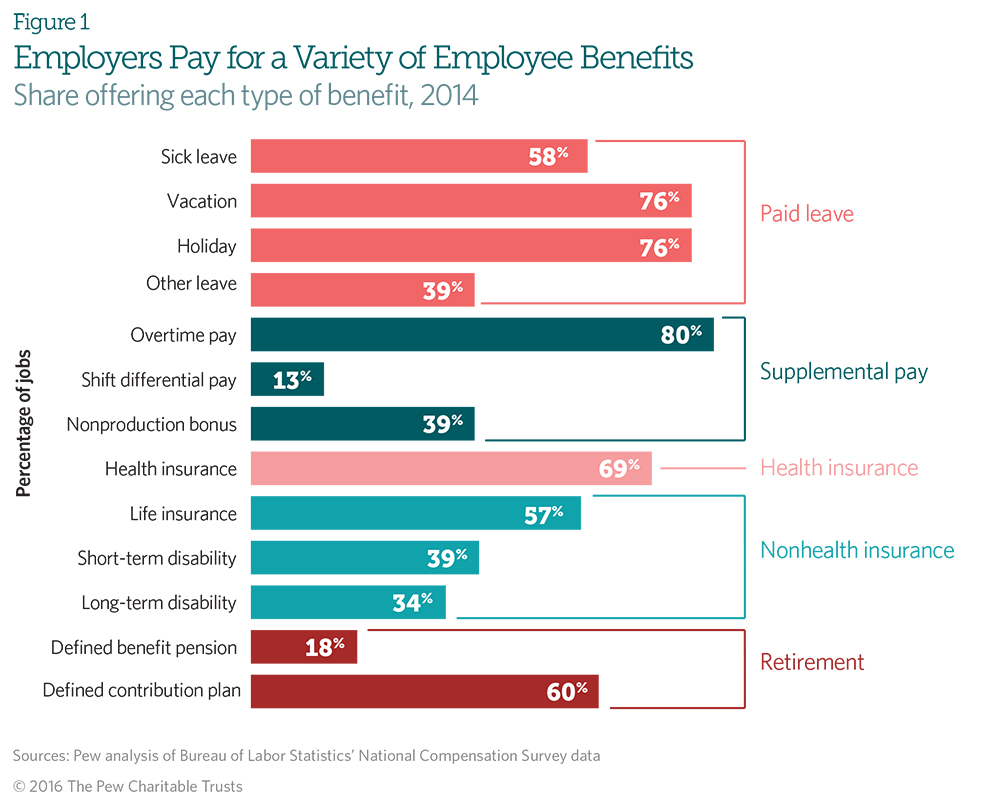
In today’s private sector labor force, almost all workers have access to at least some benefits, but the proportion of jobs that provide a given benefit vary widely. Although nearly 8 in 10 jobs offer supplemental pay for overtime work, which is mandatory for some classes of employees, only about 1 in 10 offers extra pay as a benefit for working specific shifts.
Substantial variation also is found within categories of benefits. For example, private sector jobs are much more likely to offer employees access to defined contribution retirement plans, including 401(k)s, than defined benefit plans, such as pensions.9 Similarly, large segments of the labor force have access to paid time off on holidays and for vacations, but paid sick leave is rarer.
Employers spend the most on wages, nonhealth insurance, legally required benefits
Employers typically spend substantially less on benefits than pay. Nationally, median hourly wages in 2014 were $15.61 and total benefit costs were about 40 percent of pay. Although retirement and health insurance occupy the lion’s share of attention when people think of benefits, employers at the median spend less on these categories than on other types of benefits. Rather, they spend the most on nonhealth insurance, such as short- and longterm disability, and on legally mandated benefits including Social Security, which provide employees with continuity of pay in the event of a financial shock. (See Figure 2.) For each hour the median employee works, the employer pays $1.88 for health insurance and $2.16 each for nonhealth insurance and legally mandated benefits that are tied to a worker’s pay level.
Median employer spending on health insurance and retirement savings programs reflects the large number of workers who do not get those benefits. By contrast, the highest-cost benefits are widely offered and expensive, in part because some are required by law.
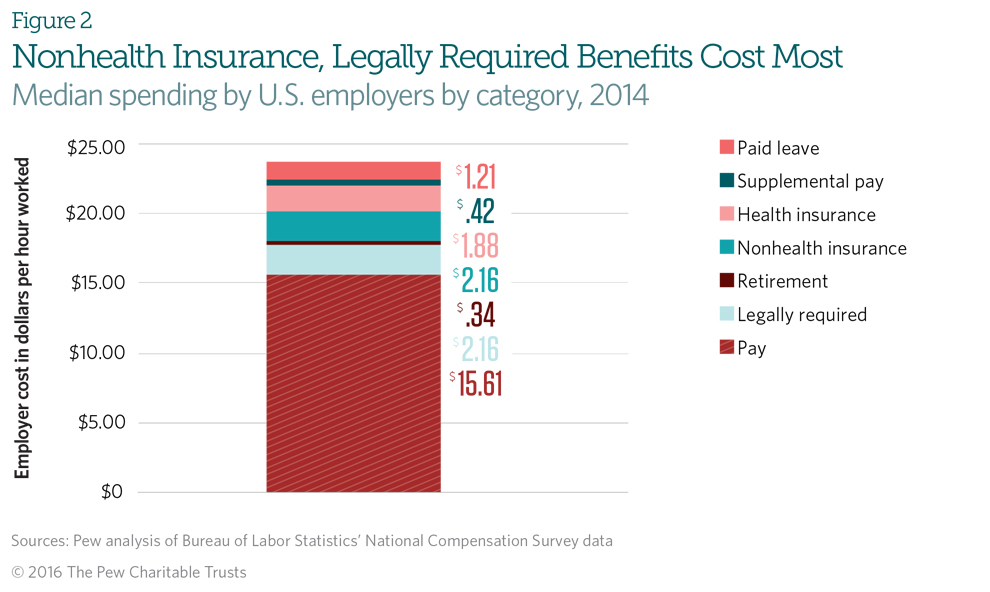
The data show that this pattern of employer spending persists even when considering only employees who receive each benefit. Employers pay a median of $3.12 per hour worked for nonhealth insurance benefits, compared with $3.06 for health insurance. Employers typically spend a dollar per hour worked on retirement plans.
Supplemental pay, such as overtime and bonuses, represents only a small additional cost for employers, suggesting that few employees with access to that benefit actually use much of it. This is probably in part because many employers control employee schedules and can minimize expenses in this category. In addition, although employers in the finance, insurance, and real estate industries sometimes pay substantial bonuses, such cases are relatively few and do not substantially affect estimates of median costs for employers.
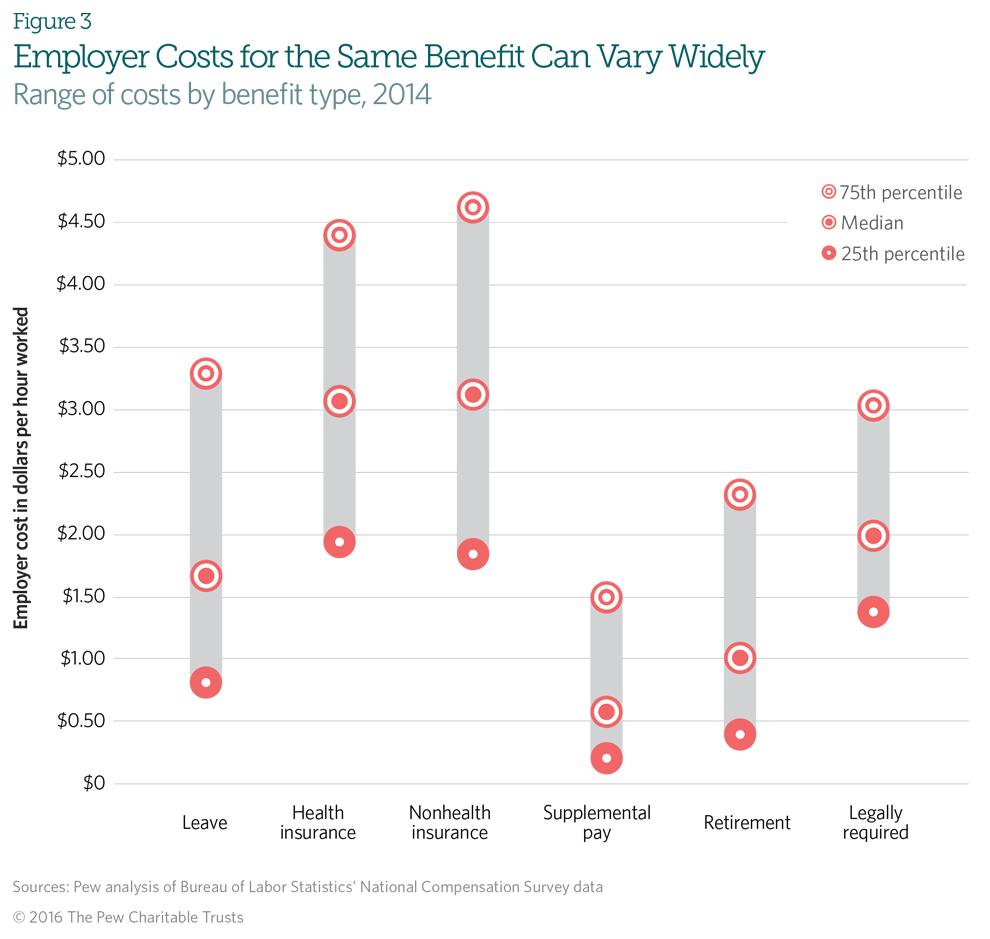
Employer spending on benefits varies dramatically within categories
Employers offering the same type of benefit may incur significantly disparate costs as a result of the diversity of plans within each category, differences in benefit markets, and other factors. For instance, two employers may provide their workers with health insurance, but the plans may be designed with different terms, costs, and risks. Characteristics of a job—including whether it is full or part time, whether it is covered by a union contract, and the wage it earns—also correlate to the cost of benefits.
Figure 3 shows the range of costs among those employers offering each type of benefit in 2014. For example, a quarter of employers spent less than 40 cents per hour of work on retirement plans, while another quarter spent more than five times that much.
When developing a compensation package, employers balance various and sometimes competing concerns, including cost, the need to recruit and retain talent, and the traditions and norms of their geographic region and industry. Once an employer decides to provide workers with a given benefit, many factors contribute to its cost. This study focuses on three: industry, establishment size, and worker wage level. Other variables—such as whether employees use all or part of their paid leave and the employer’s choice of benefit provider—are beyond the scope of this analysis.
Benefit offering and spending varies substantially by industry
Within most industries, employee occupations and pay grades vary widely. For example, although the professional, scientific, and technical services sector is frequently associated with lawyers and scientists, establishments in that industry also employ lower-paid support staff, administrative and janitorial workers, and others whose occupations, authority, and pay do not generally command high levels of benefit spending.10
Nevertheless, significant differences in benefit spending exist across industries, even after controlling for pay, establishment size, worker union status, region, and other characteristics.11 Establishments in the mining and extraction industry and in utilities spend significantly more on benefits than do employers in other sectors. For instance, the average mining job provides over $5 more in benefits per hour worked than the average construction job. And the data show that in industries where more is spent on benefits generally, employers spend more both in dollars and as a proportion of pay. This is because establishments in high-spending industries offer many types of benefits and spend generously on them, and some industries are subject to regulatory requirements that dictate unique requirements for benefits, among other reasons.
Other industries, particularly those associated with low pay and inconsistent work hours, offer fewer types of benefits and spend less on the ones they do provide.12 For instance, employers in the administrative sector are significantly less likely than those in other industries to offer health insurance. Employers in the accommodation and food service and the retail trade sectors spend little on benefits compared with those in other industries.
Most of the gap in benefit expenditures between high- and low-spending industries, however, is explained by the greater prevalence of low pay and part-time workers in low-spending industries, rather than by peculiarities of a specific industry. For instance, the typical job in the arts, entertainment, and recreation sector provides benefits that cost employers twice the price of the benefits offered by the typical job in the accommodation and food services sector.13 However, after controlling for worker wage and part-time status in the latter sector, the cost differential is not significant.14
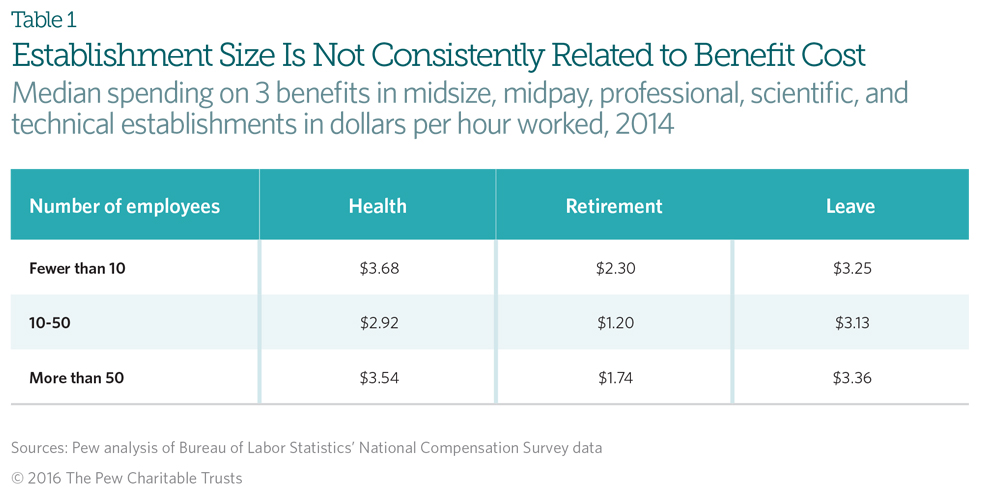
Establishment size and spending on benefits do not consistently correlate
The market for purchasing benefits is not the same for all employers. Some data suggest that benefits providers have lower administrative and marketing costs when servicing large employers versus those with smaller numbers of workers15 because of risk pooling—the ability to spread the cost of a catastrophic event across more participants—and economies of scale, which reduce the price per participant. Perhaps because they pay more per worker, smaller establishments offer fewer benefits than larger ones and, at least with respect to health insurance, engage in more cost-sharing with employees.16
In the aggregate though, assessing the relationship between establishment size and employer costs for benefits is complicated by two factors. First, larger establishments tend to pay employees more than smaller ones do. Second, across the five benefit categories, large establishments are more likely to offer benefits to their employees than smaller ones are. For example, an establishment with 60 employees is 50 percent more likely than one with 10 employees to offer health insurance.17
Generally, total benefit spending increases with the size of the establishment, but this is because larger establishments offer more benefits. Within a given benefit category, however, establishments appear to spend comparable amounts regardless of size. The data do not address the quality of individual benefits packages, though, or the value a business gets for its expenditures.18
For example, consider employees in the middle pay tier of the professional services, scientific, and technical services industry. For these workers, no consistent relationship is evident between cost and establishment size, even when the analysis is restricted to employers that provide a given benefit. (See Table 1.) Small establishments in that industry and wage tier that offer paid leave pay less for it than large establishments. At the same time, small establishments pay more for a retirement plan than do medium-size or large establishments. This pattern is repeated across industries and for workers of different wages. Sometimes small establishments pay more, sometimes less.
The wide variation in benefit spending among employers means two workers who earn similar incomes may have very different total compensation.
Jobs with higher pay also tend to have more expensive benefits
Although a few employers have always provided some ancillary benefits, historians date a sharp but unequal rise in benefit spending as a share of total compensation to the period during and just after World War II, when wages were frozen nationally as part of the war effort.19 Without the ability to compete on pay, employers used increasingly generous benefits packages to attract and retain top-quality workers.
The data do not indicate that among low-paying jobs, benefits spending is used to compensate for low wages. Rather, 70 years after the warera wage controls were lifted, higher-paid and higher-status employees receive costlier benefits than do lower-paid workers. Controlling for other factors, jobs with higher pay generally also come with more extensive and expensive benefits packages. Specifically, each additional dollar of average hourly pay is associated with another 67 cents per hour in employer spending on benefits.20
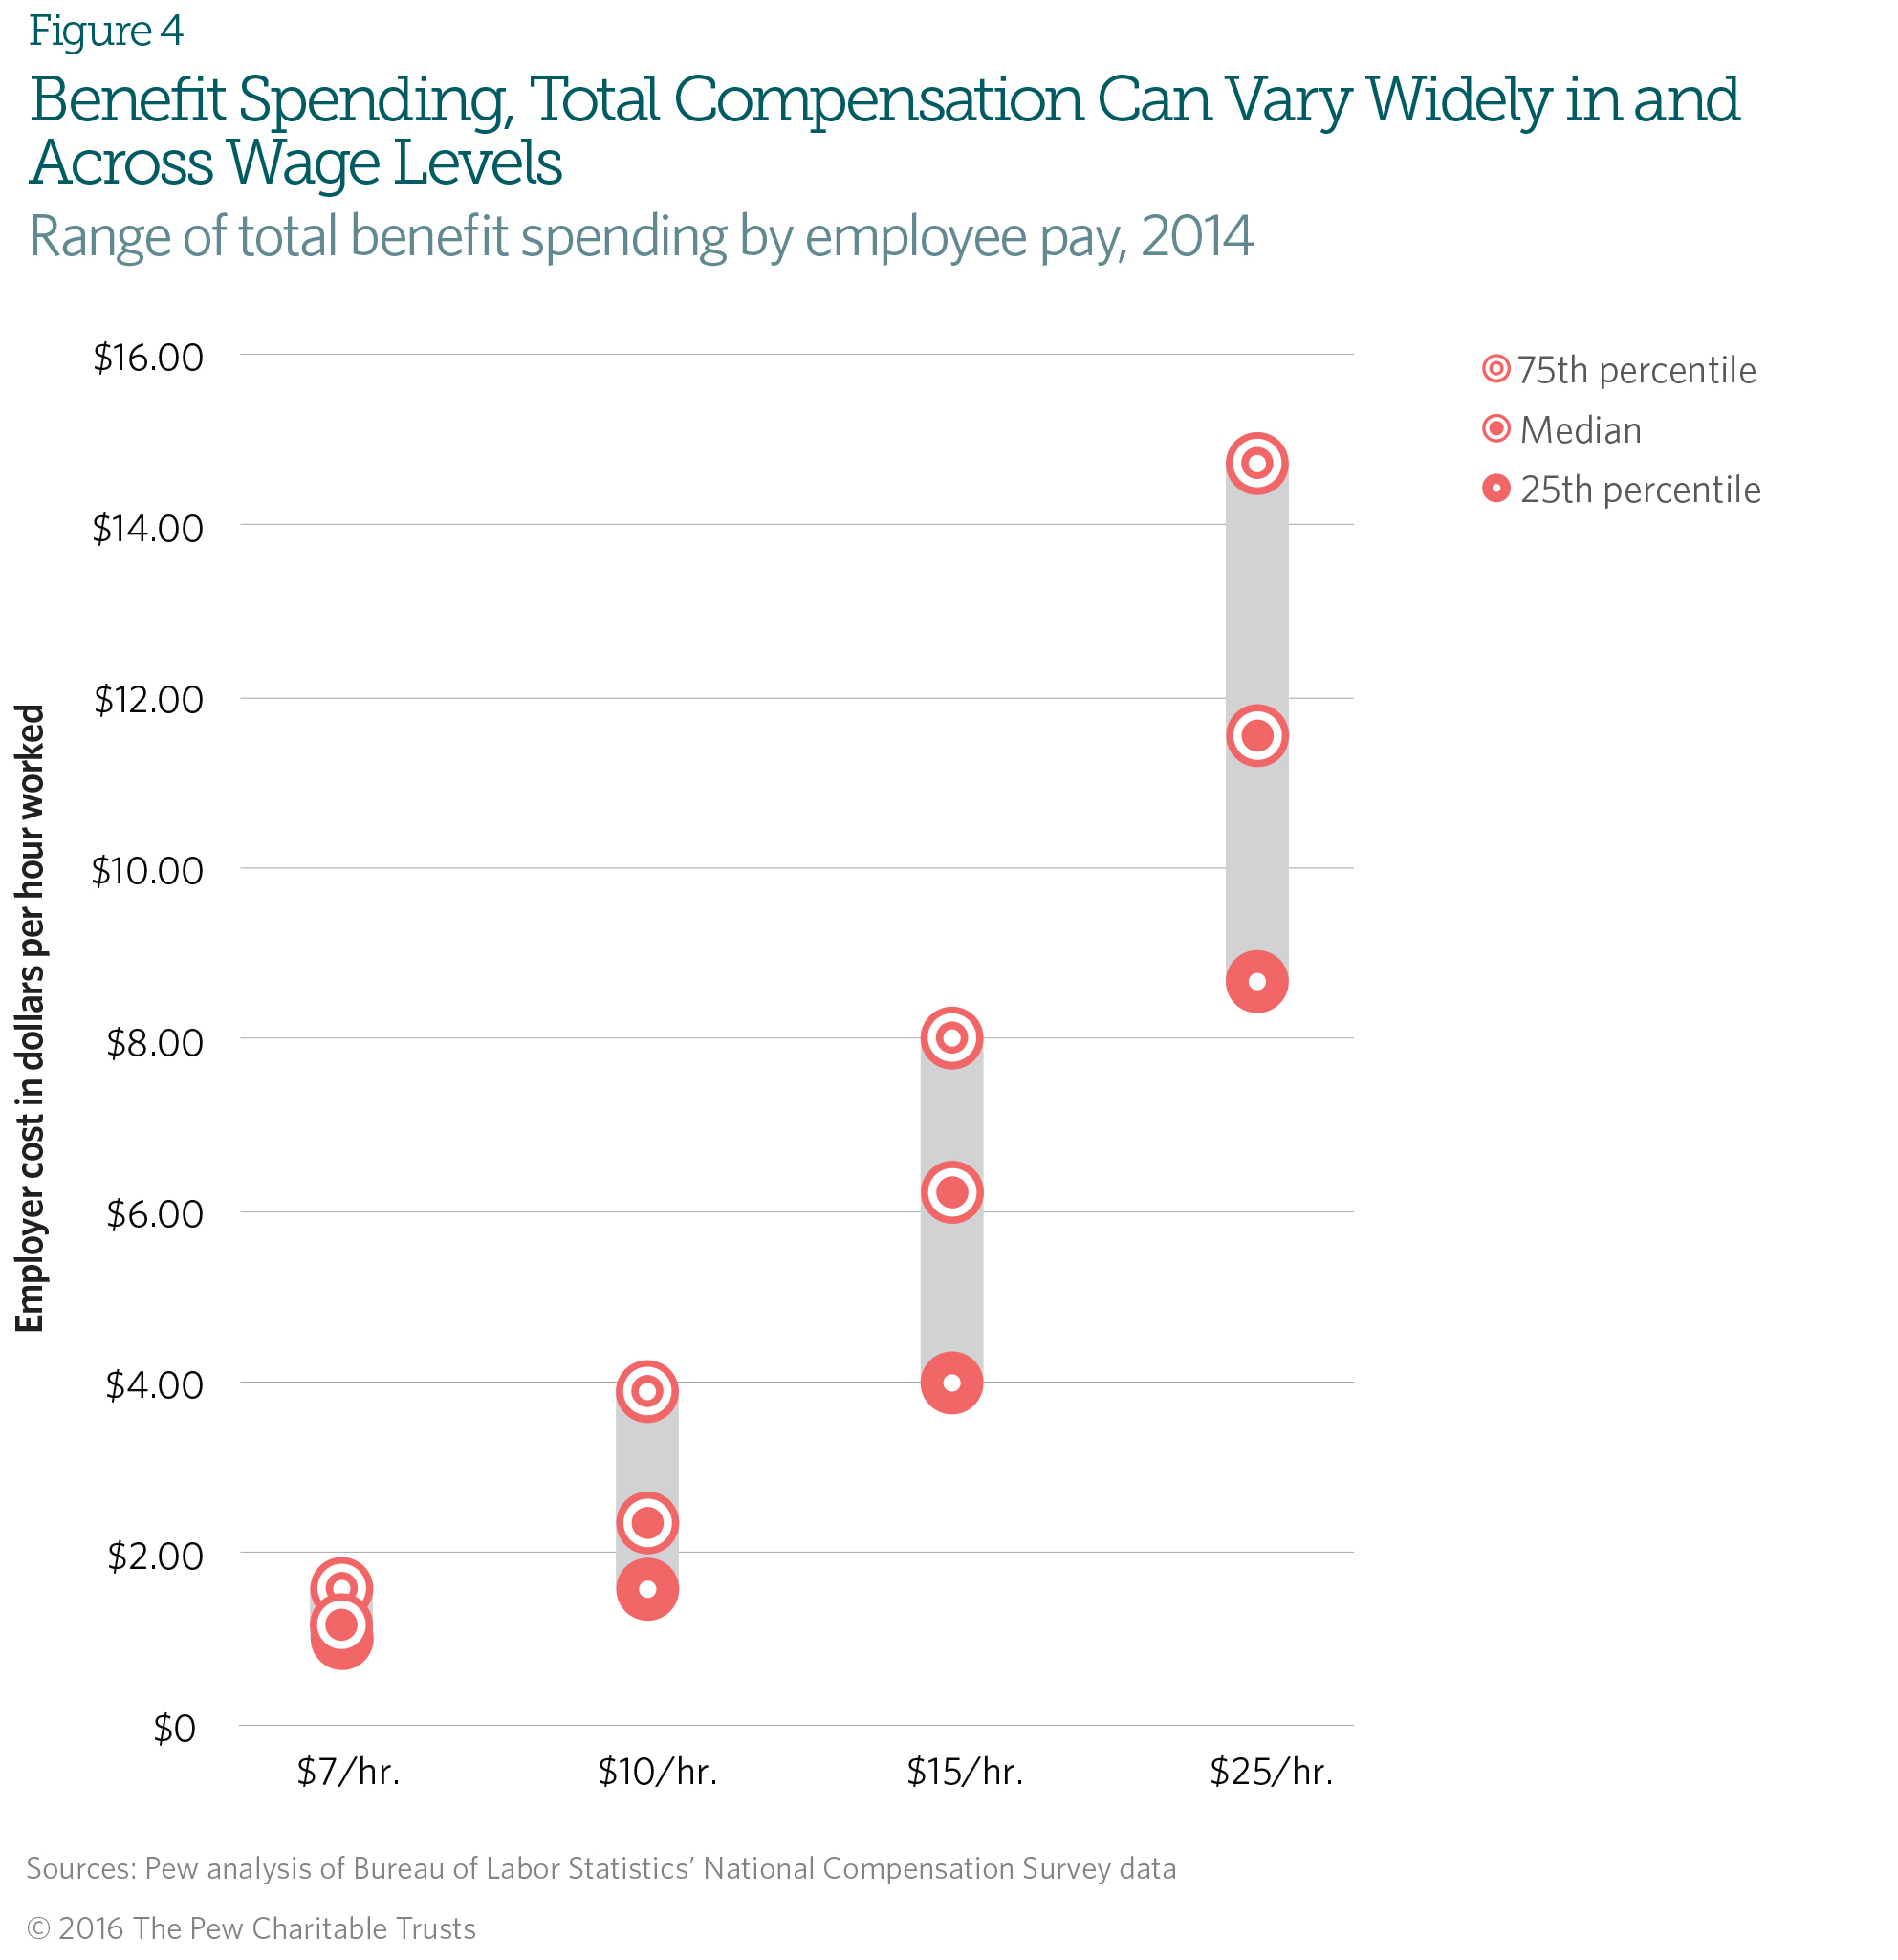
Figure 4 shows the stark difference in benefit spending as a function of worker pay. Overall, the median employer spends 38 cents on benefits for every dollar in salary. For instance, among construction jobs, employees in the lowest third of the industry’s income range typically receive 28 cents’ worth of benefits for every dollar in pay, compared with 49 cents in the highest third. And this strong relationship holds true across industries and establishment sizes. For example, employers in construction typically spend $3.60 per hour worked on benefits for employees in the lowest third of wages, $7.55 for workers in the middle third, and $18.22 for workers in the highest third. Overall, benefits widen rather than narrow wage disparities among workers within and across industries.
Benefits spending creates substantial variation in total compensation among workers earning the same pay. An examination of total compensation, which includes the wages and salaries paid to workers plus employer-paid costs of benefits, can offer insights into how different jobs might contribute to families’ economic health. The wide variation in benefit spending among employers, however, means two workers who earn similar incomes may have very different total compensation.
Figure 4, in addition to showing the variation in benefit spending at different wages, also presents the range of employer spending on benefits for jobs at the same pay level. The median job pays about $15 per hour and typically provides an additional $6.10 in spending on benefits. However, not all workers at that pay can expect to receive that compensation. A quarter of those making about $15 per hour receive less than $4.02 in benefits, and another quarter receive more than twice that. Among workers making $25 an hour, employer benefit spending is higher than for those earning less, as discussed in the previous section, but it also ranges more widely. Lower-paid workers also could end up with substantially different amounts of total compensation, but the range is narrower. For workers earning about $7 an hour, a quarter of jobs have benefits that add less than a dollar to employee wages while another quarter add $1.59 per hour worked. The range of benefits increases at higher levels of pay.
The findings on total compensation provide the clearest picture of how benefits spending can affect workers’ financial security. Insofar as benefits spending translates into improved financial well-being, the wide disparity in such expenditures could produce a substantial security gap among workers at a given income level. Although the data do not speak directly to financial well-being, these gaps in total compensation suggest that, at the same wage, differences in financial well-being driven by total compensation could be stark.
Of course employer spending on benefits may not translate directly into economic well-being for employees. For instance, if an employer spends heavily on a low-quality benefit, such as a health plan with prohibitively high out-of-pocket costs or premiums that workers cannot afford, or one that is not widely used, employees may not be much better off than if they did not have the benefit. Still, total compensation gives a fuller picture than does income alone.
Conclusion
Previous research using data from the Pew Survey of American Family Finances described many U.S. families as financially vulnerable and insecure.21 Households struggle to meet challenges from financial shocks and have little savings. In this landscape, understanding not only the difficulties that people face but also the factors that they identify as sources of financial resilience and strength can help drive development of effective policies and programs to support families’ economic health.
This analysis shows how widely access to and costs of benefits vary. Two employers offering the same benefit may pay different prices, and two workers earning the same wage could, owing to benefits, have radically different levels of total compensation. In the context of this wide variation, further research is needed to assess the impact on benefits provision and spending of new state and federal policies related to retirement, health insurance, and overtime pay.
Although further exploration is needed to gauge how much impact a dollar of employer benefit spending has on workers’ financial health, Pew’s survey data suggest that, in general, people feel their benefits contribute to economic well-being.
Endnotes
- Internal Revenue Service, Publication 1304, Table 1.4, “All Returns: Sources of Income, Adjustments Deductions and Exemptions, and Tax Items” (tax year 2013), https://www.irs.gov/uac/soi-tax-stats-individual-statistical-tables-by-size-of-adjusted-gross-income#_grpl.
- Arne L. Kalleberg, Barbara F. Reskin, and Ken Hudson, “Bad Jobs in America: Standard and Nonstandard Employment Relations and Job Quality in the United States,” American Sociological Review 65, no. 2 (2000): 256–78; Catherine E. Connelly and Daniel G. Gallagher, “Emerging Trends in Contingent Work Research,” Journal of Management 30, no. 6 (2004): 959–83, http://jom.sagepub.com/content/30/6/959.abstract; and Patrick G. McGovern, Deborah Smeaton, and Stephen Hill, “Bad Jobs in Britain: Nonstandard Employment and Job Quality,” Work and Occupations 31, no. 2 (2004): 225–49, http://wox.sagepub.com/content/31/2/225.short.
- Paul DiMaggio and Walter W. Powell, “The Iron Cage Revisited: Collective Rationality and Institutional Isomorphism in Organizational Fields,” American Sociological Review 48, no. 2 (1983): 147–60; Jeffrey Pfeffer, “Competitive Advantage Through People,” California Management Review 36, no. 2 (1994): 9–28, http://dx.doi.org/10.2307/41165742; and Margaret A. Lucero and Robert E. Allen, “Employee Benefits: A Growing Source of Psychological Contract Violations,” Human Resource Management 33, no. 3 (1994): 425, http://dx.doi.org/10.1002/hrm.3930330310.
- Legally required benefits, such as payments made by an employer on workers’ behalf to Medicare and Social Security, fund a large portion of America’s social insurance system. At the same time, employment relationships are the conduit through which most workers access private insurance products.
- Kaiser Family Foundation, “Health Insurance Coverage of the Total Population” (2014), http://kff.org/other/state-indicator/total-population; and Federal Reserve Board of Governors, “Report on the Economic Well-Being of Households in 2014: Saving for Retirement,” http://www.federalreserve.gov/econresdata/2015-economic-well-being-of-us-households-in-2014-retirement.htm#subsection-1114-B14F0306.
- Kathleen Barker and Kathleen Christensen, eds., Contingent Work: American Employment Relations in Transition (Ithaca, New York: Cornell University Press, 1998); and Alvin W. Gouldner, Patterns of Industrial Bureaucracy (New York: Free Press, 1954).
- Arne L. Kalleberg, Good Jobs, Bad Jobs: The Rise of Polarized and Precarious Employment Systems in the United States, 1970s to 2000s (New York: Russell Sage Foundation, 2011).
- Respondents who reported that they or their spouses were working were asked, with respect to retirement or pension plans and health, medical, or dental coverage, “For each of the following benefits, would you rather have your employer set up and provide you with the benefit or receive the same value in cash with your wage or salary?”
- Throughout this brief, discussions of retirement plan access do not include Social Security. For more detailed information on retirement plan access, see The Pew Charitable Trusts, Who’s In, Who’s Out: A Look at Access to Employer-Based Retirement Plans and Participation in the States (January 2016), http://www.pewtrusts.org/~/media/assets/2016/01/retirement_savings_report_jan16.pdf.
- Because pay is closely associated with both occupation and benefit cost, a unique effect of occupation is difficult to detect in the data.
- Effects presented were estimated with regression-based models. For full outputs, see the supplemental tables at http://www.pewtrusts.org/sitecore/~/media/Assets/2016/07/US_worker_benefits_supptables.xlsx.
- Laws such as the Affordable Care Act include different standards for full- and part-time workers, which can combine with labor market pressure to limit benefits in industries with larger shares of part-time workers.
- The estimate presented is based on descriptive statistics. Full descriptive statistics on benefits access and employer spending by industry, establishment size, and wage tier are available in the interactive at http://www.pewtrusts.org/en/multimedia/data-visualizations/2016/ how-do-us-workplace-benefits-differ.
- Effects presented were estimated with regression-based models. For full outputs, see the supplemental tables at http://www.pewtrusts.org/sitecore/~/media/Assets/2016/07/US_worker_benefits_supptables.xlsx.
- Michelle Long, Matthew Rae, and Gary Claxton, “A Comparison of the Availability and Cost of Coverage for Workers in Small Firms and Large Firms: Update From the 2015 Employer Health Benefits Survey” (Feb. 5, 2016), Kaiser Family Foundation, http://kff.org/private-insurance/issue-brief/a-comparison-of-the-availability-and-cost-of-coverage-for-workers-in-small-firms-and-large-firms-update-from-the-2015-employer-health-benefits-survey.
- Ibid.
- Some laws such as the Affordable Care Act have requirements that differ by the size of the firm, which may contribute to the relationship between establishment size and benefits. The data, however, capture establishments—rather than the larger firms some establishments are part of—so this effect has not been directly measured.
- Large employers have more leverage in negotiations with benefits providers and are more likely than small employers to have specialized staff to explore and choose plans, expend more resources to identify high-value benefits, and have more capacity to compare their purchases with those of peer organizations.
- James N. Baron, Frank R. Dobbin, and P. Devereaux Jennings, “War and Peace: The Evolution of Modern Personnel Administration in U.S. Industry,” American Journal of Sociology 92, no. 2 (1986): 350–83, http://www.jstor.org/stable/2780161. For a competing view, see Frank R. Dobbin, “The Origins of Private Social Insurance: Public Policy and Fringe Benefits in America, 1920–1950,” American Journal of Sociology 97, no. 5 (1992): 1416-50, http://www.jstor.org/stable/2781420.
- Total benefit costs were estimated with an ordinary least squares regression model. For full outputs, see the supplemental tables at http://www.pewtrusts.org/sitecore/~/media/Assets/2016/07/US_worker_benefits_supptables.xlsx.
- Pew’s issue briefs on short-term savings are available at http://www.pewtrusts.org/emergencysavings.


How Do U.S. Workplace Benefits Differ?
Access and employer costs vary by industry, establishment size, and wages


Employer-Sponsored Benefits and Family Financial Security
The current landscape and opportunities for the future
ADDITIONAL RESOURCES


