10 Ways Philadelphia Has Changed in 75 Years
From cowboy hat manufacturing capital to ‘eds and meds’ hub, the city—like its residents—is constantly evolving


In 1948, The Pew Charitable Trusts—then known as The Pew Memorial Foundation—was established in Philadelphia to help solve some of the era’s most pressing challenges. Since then, the city and its population have changed dramatically in countless ways, from where residents come from and where they work to who owns a home. And Pew, meanwhile, has grown from a family foundation into a global public policy organization working on issues ranging from economic policy and criminal justice reform to opioid use disorder treatment access and environmental conservation.
Yet, even as we expanded, Pew’s commitment to Philadelphia has remained steadfast—and, today, Pew supports the city and the surrounding region through local research, policy work, and grantmaking.
To help commemorate Pew’s 75th anniversary—and our deep love for all things Philadelphia—we’re sharing a different perspective on some of the key indicators in our annual “State of the City” report to highlight and reflect on some of the ways our hometown has changed since our organization was founded.
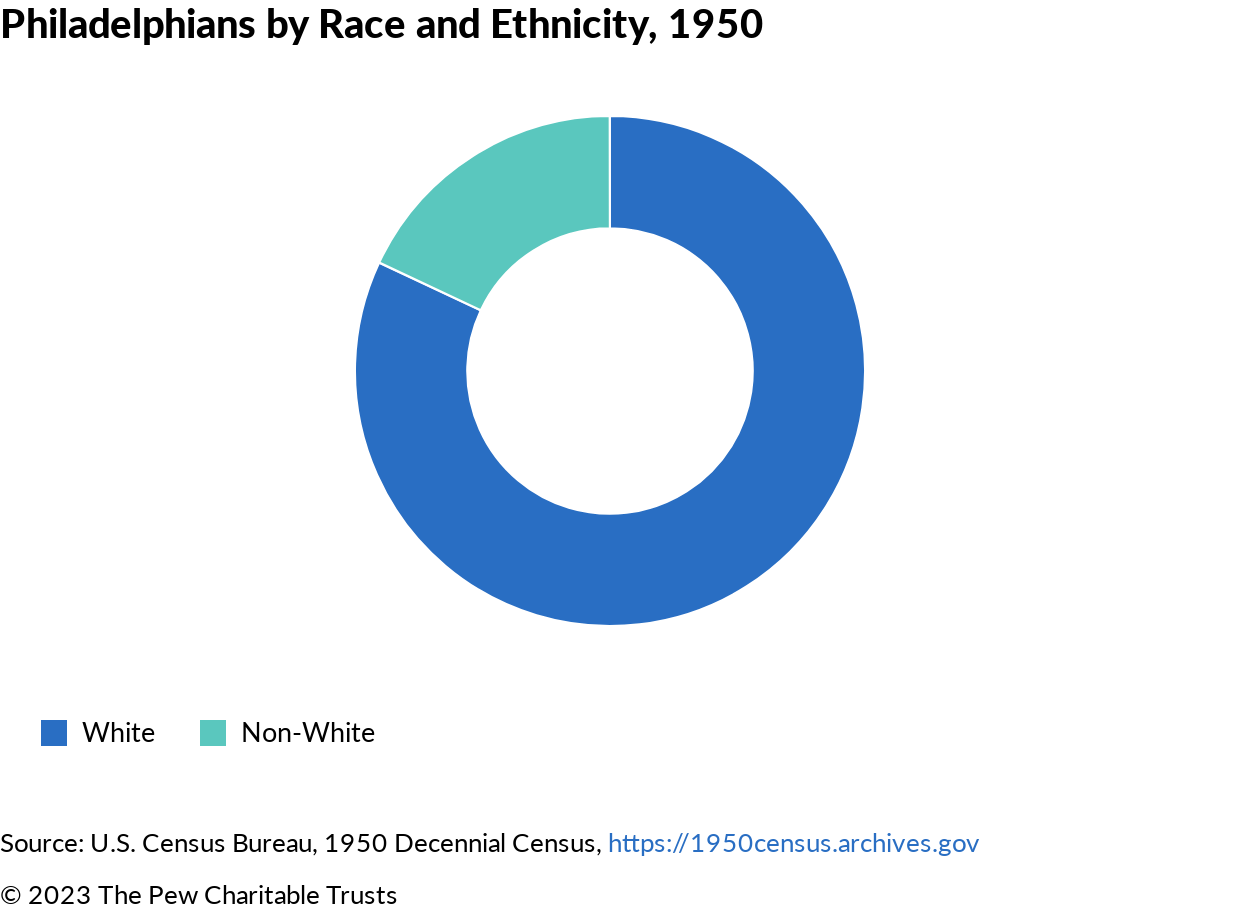
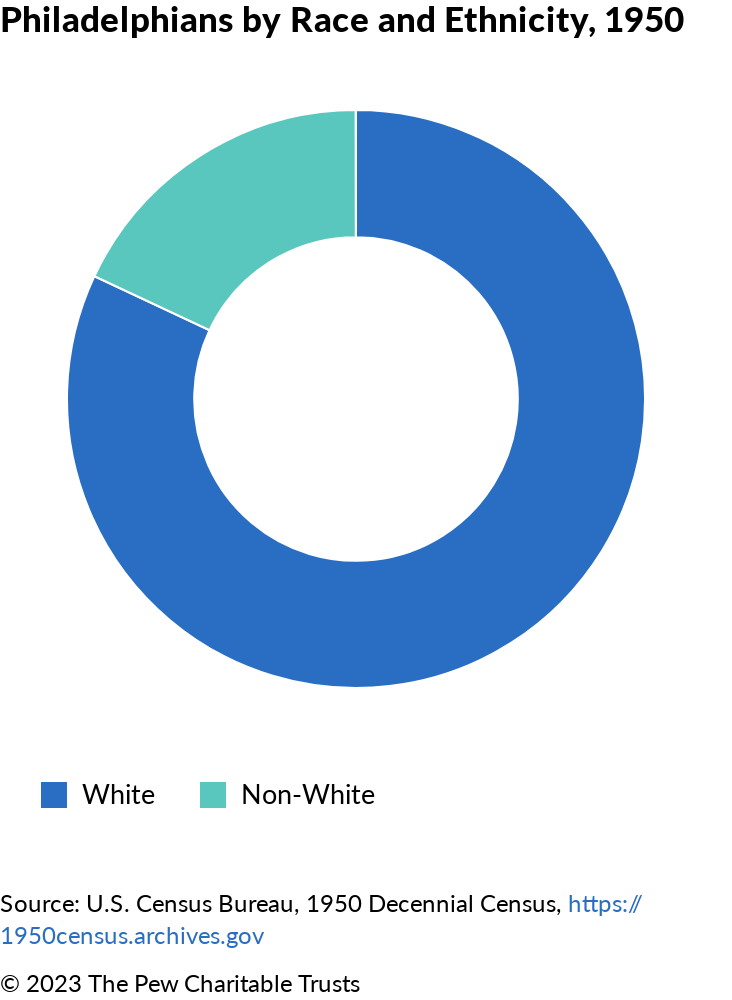
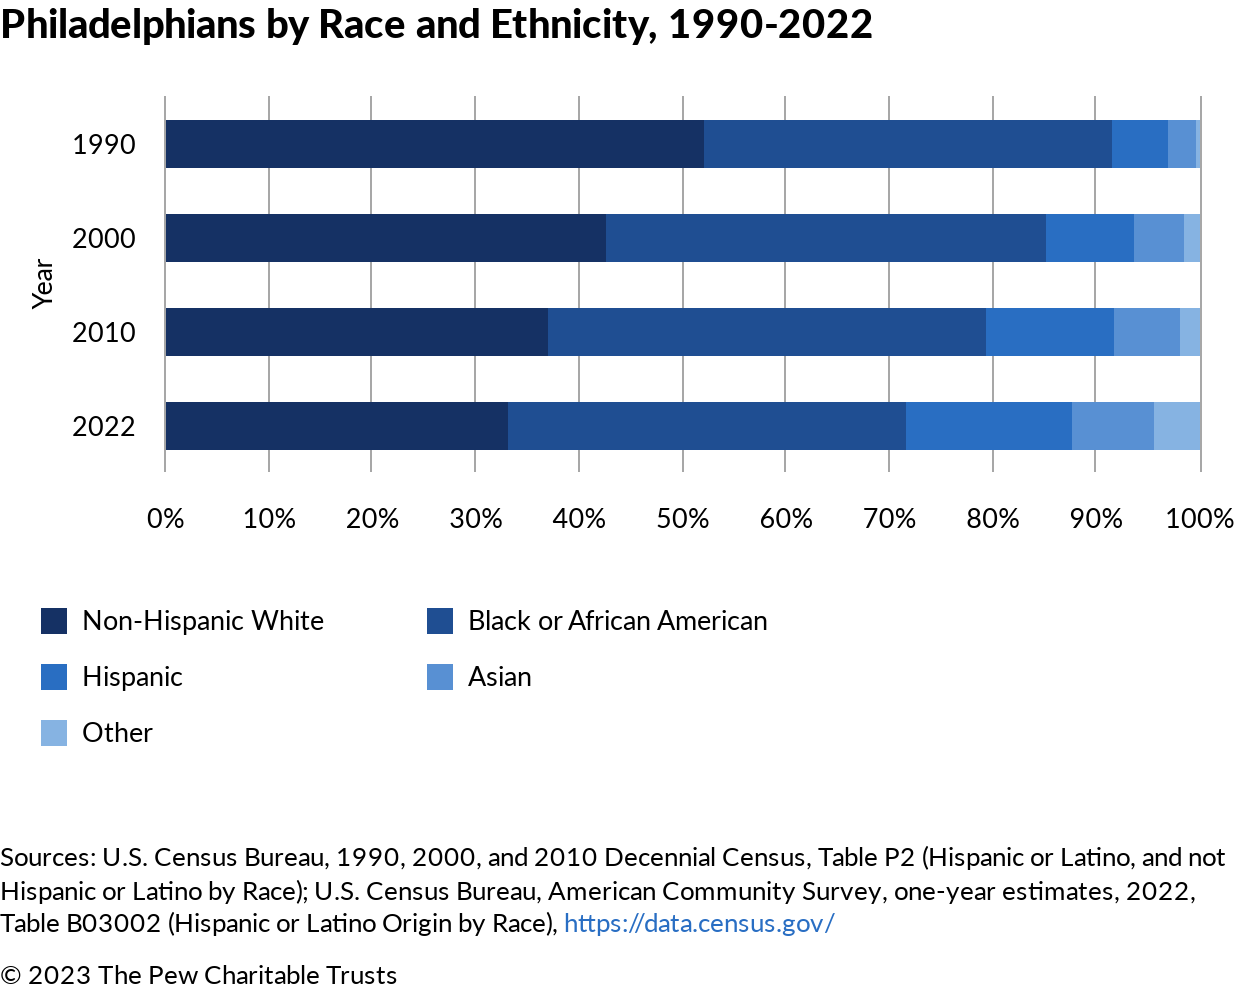
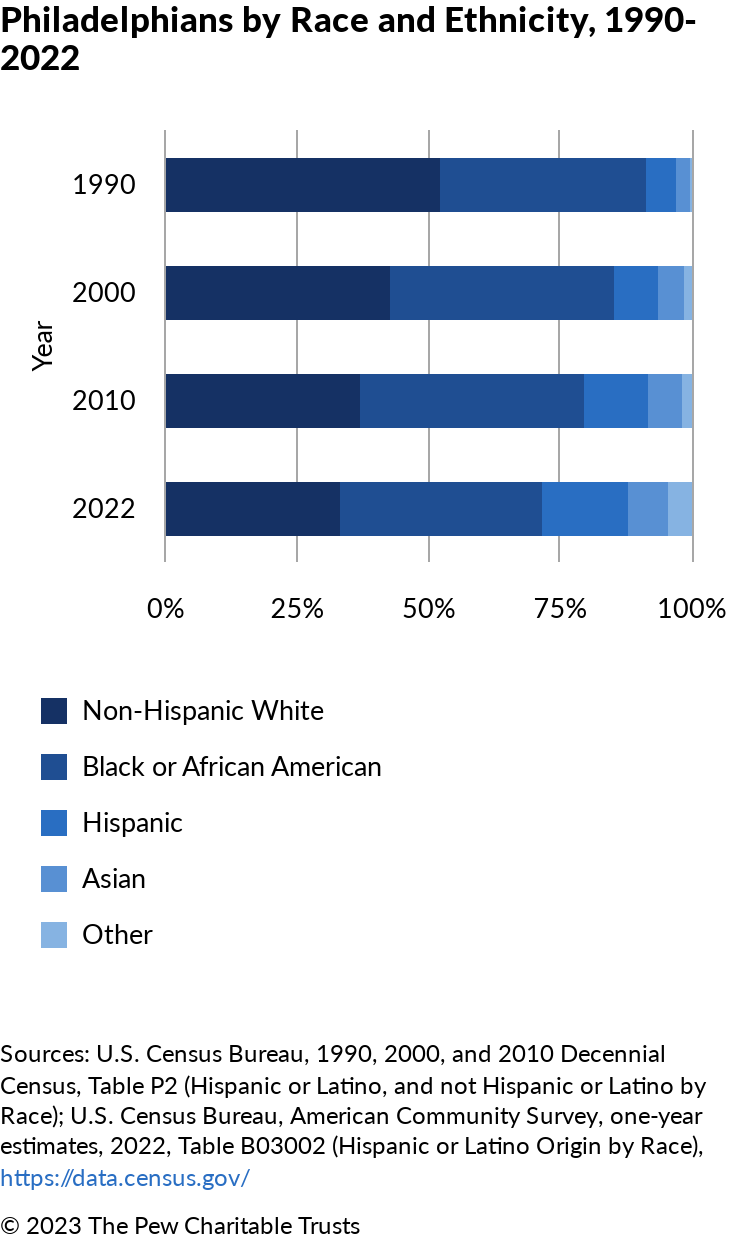
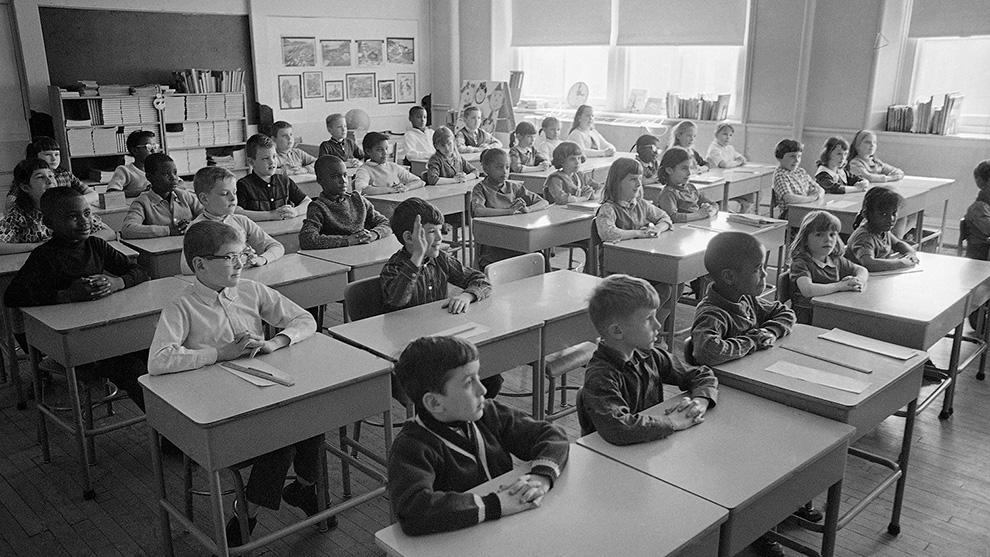
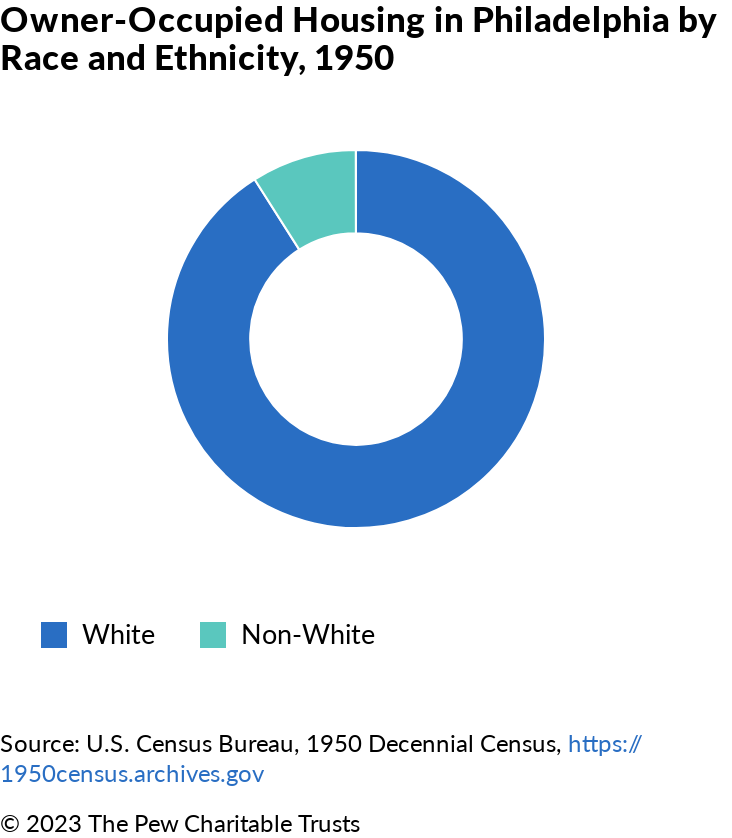
1. Philadelphia is much more diverse than it was in 1950.

In 1950, the U.S. Census Bureau provided two ways of indicating race: “White” and “non-White.” At that time, census takers also made the choice for respondents, potentially misidentifying people. According to that year’s census, more than 8 in 10 Philadelphians were White.
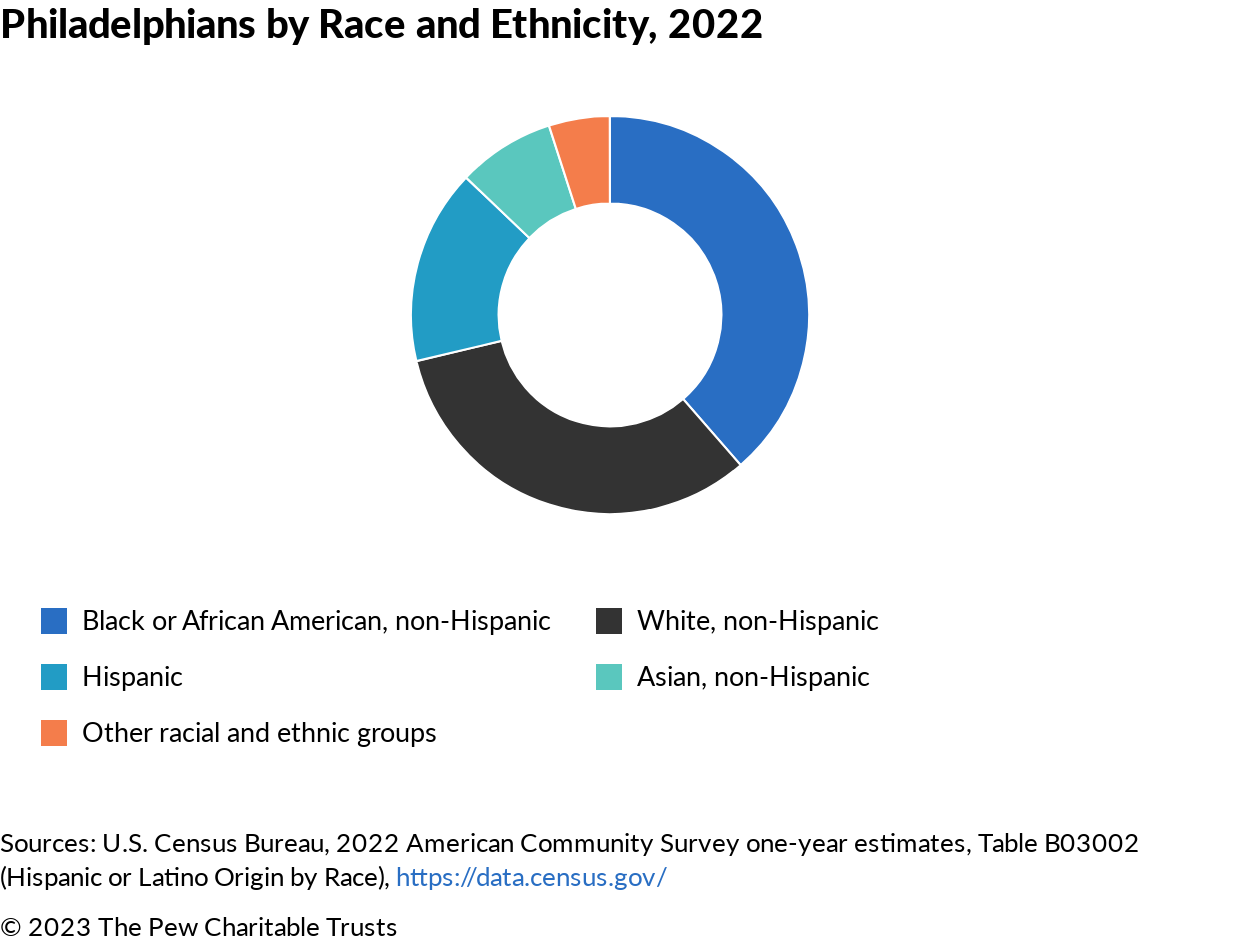
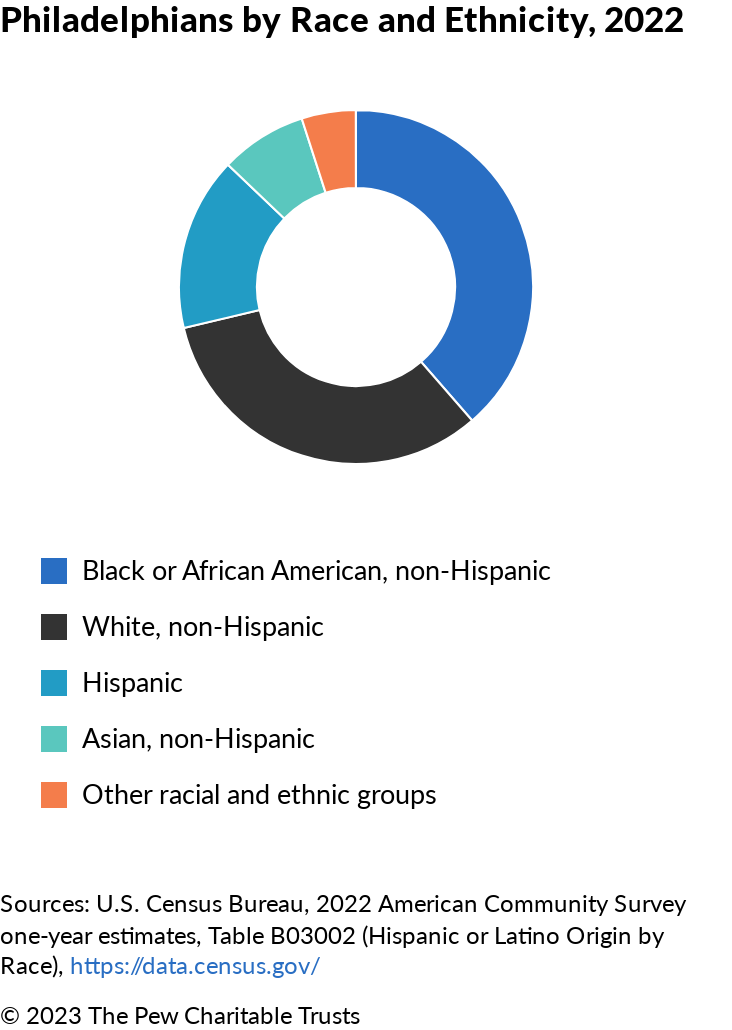
Since then, the Census Bureau has provided more opportunities for people to self-identify by race and ethnicity—and to more accurately reflect the diversity of Philadelphia and the country as a whole.
Today, approximately 3 in 10 Philadelphians identify as White (non-Hispanic), while 39% identify as Black or African American, 16% as Hispanic or Latino, 8% as Asian, and 5% as “other” racial or ethnic groups, according to 2022 census data, which offered seven choices for race or ethnicity.
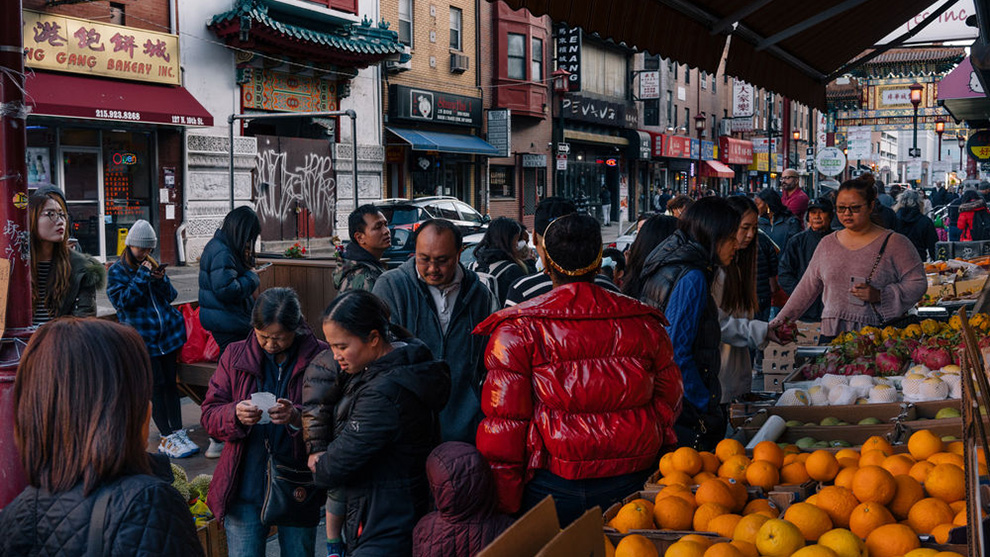
2. In 1950, Philadelphia’s largest immigrant group came from the former Soviet Union. Today, the largest immigrant group is from China.
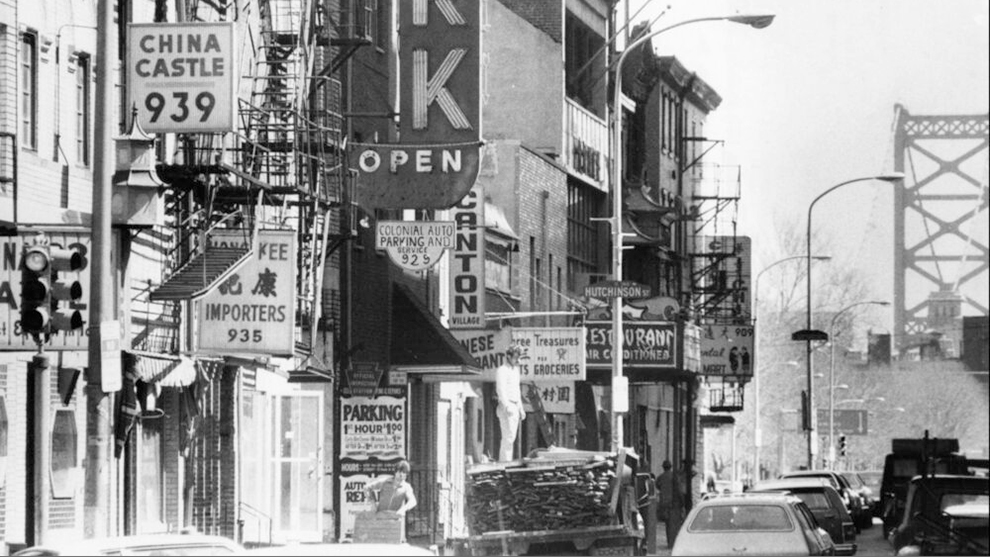
First-generation Americans in Philadelphia in 1950 were predominantly European, with most of the city’s foreign-born residents at the time coming from the former Soviet Union.
In the latter half of the 20th century, Philadelphia was considered a low-immigration city and region, with fewer people entering through or staying in Philadelphia than in other cities.
That’s been changing since the early 2000s. Today, Philadelphia has a higher foreign-born share of its population than does the nation as a whole—and its highest percentage since the 1940s.
Scholars suggest that immigration to the city has grown for several reasons:
- The availability of jobs.
- Expanded networks of expatriates.
- Local efforts to attract foreign-born people.
- Federal policies that have allowed more immigrants to enter the country.
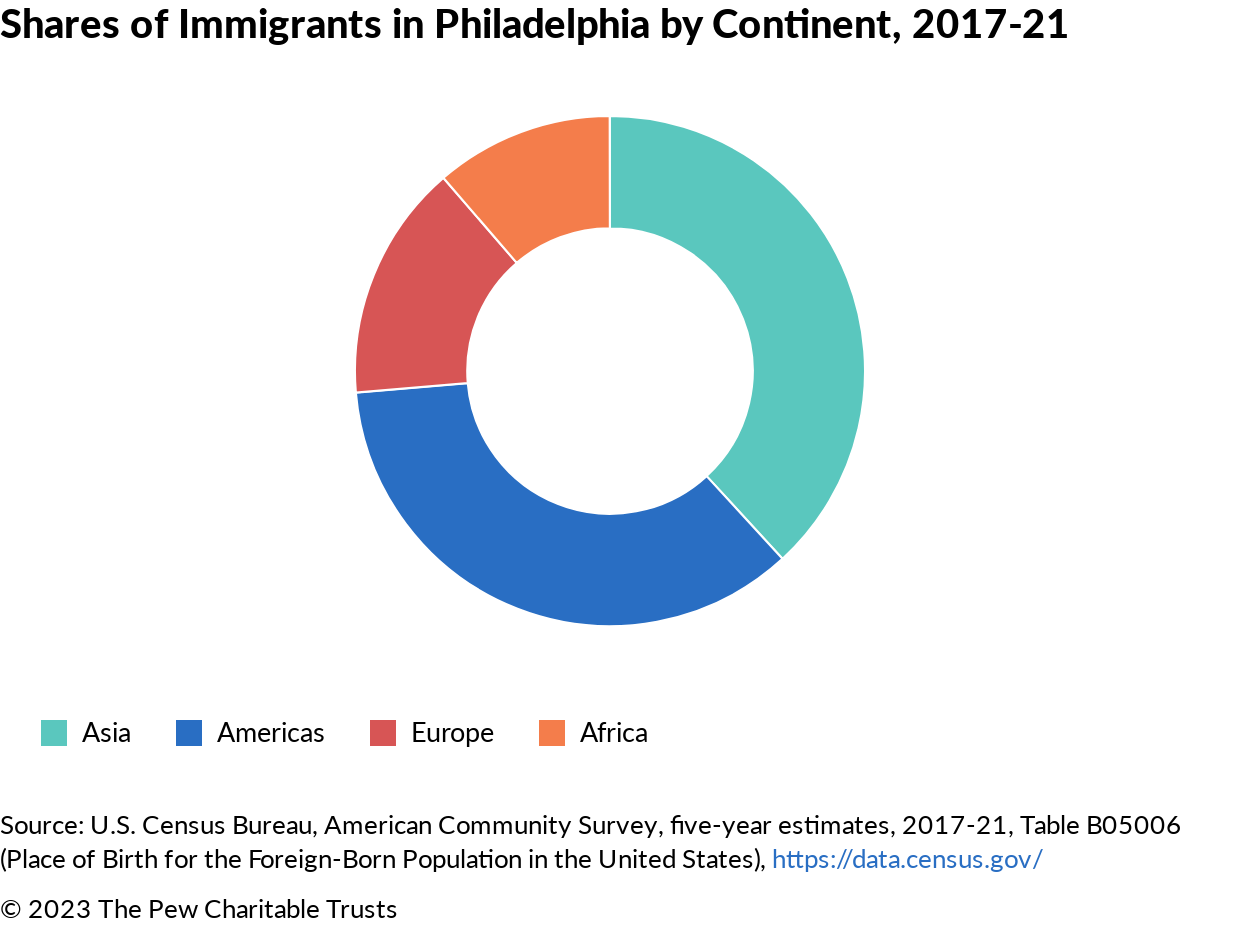
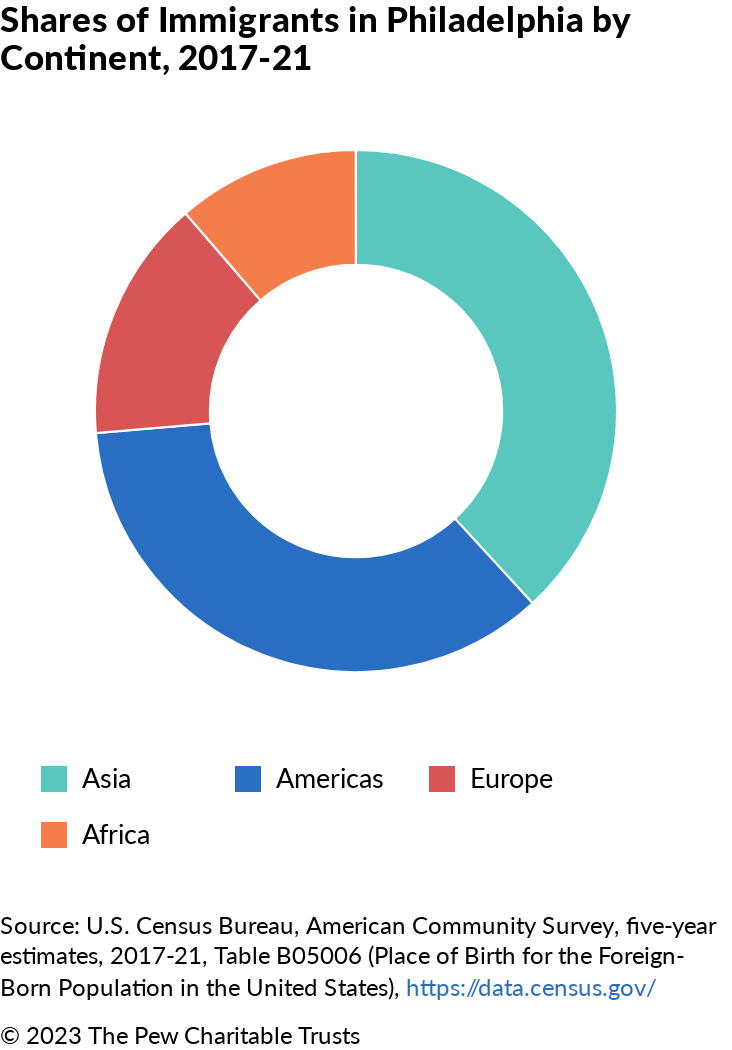
The recent wave of immigration was largely responsible for the overall population rebound from 2006 until today—and is different from the influx of immigrants to the city 75 years ago. Today, foreign-born Philadelphians are predominantly from Asia and the Americas.
Top 10 Countries of Origin for Philadelphia’s Foreign-Born, 1950 vs. 2021
Top countries of origin, 1950
| Total | 232,587 | 11.2% |
|---|---|---|
| Soviet Union | 53,906 | 23% |
| Italy | 48,721 | 21% |
| Ireland | 24,203 | 10% |
| Poland | 20,281 | 9% |
| Germany | 19,736 | 8% |
| England/Wales | 12,686 | 5% |
| Austria | 8,512 | 4% |
| Hungary | 6,531 | 3% |
| Scotland | 6,311 | 3% |
| Lithuania | 4,678 | 2% |
Top countries of origin, 2021
| Total | 228,809 | 15% |
|---|---|---|
| China, excluding Hong Kong and Taiwan | 23,893 | 10% |
| Dominican Republic | 19,662 | 9% |
| India | 12,529 | 6% |
| Vietnam | 11,719 | 5% |
| Jamaica | 11,091 | 5% |
| Haiti | 7,768 | 3% |
| Mexico | 7,544 | 3% |
| Ukraine | 6,473 | 3% |
| Brazil | 5,139 | 2% |
| Cambodia | 5,122 | 2% |
Sources: U.S. Census Bureau, 1950, https://1950census.archives.gov; U.S. Census Bureau, American Community Survey, five-year estimates, 2017-21, Table B05006 (Place of Birth for the Foreign-Born Population in the United States), http://data.census.gov
Note: In the 1950s, foreign places of birth were documented only for people considered to be White. People born in Asia and Mexico were categorized as White at that time.

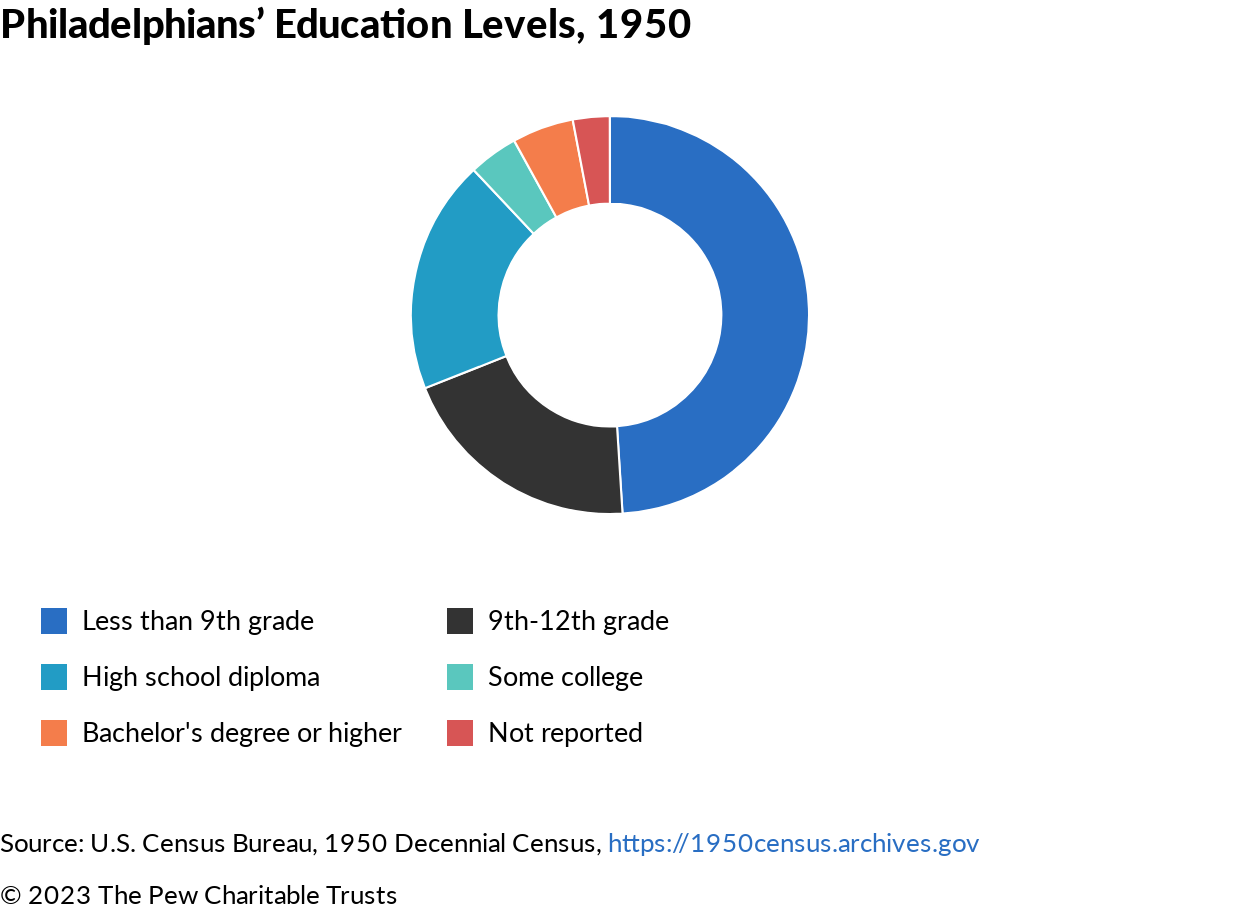
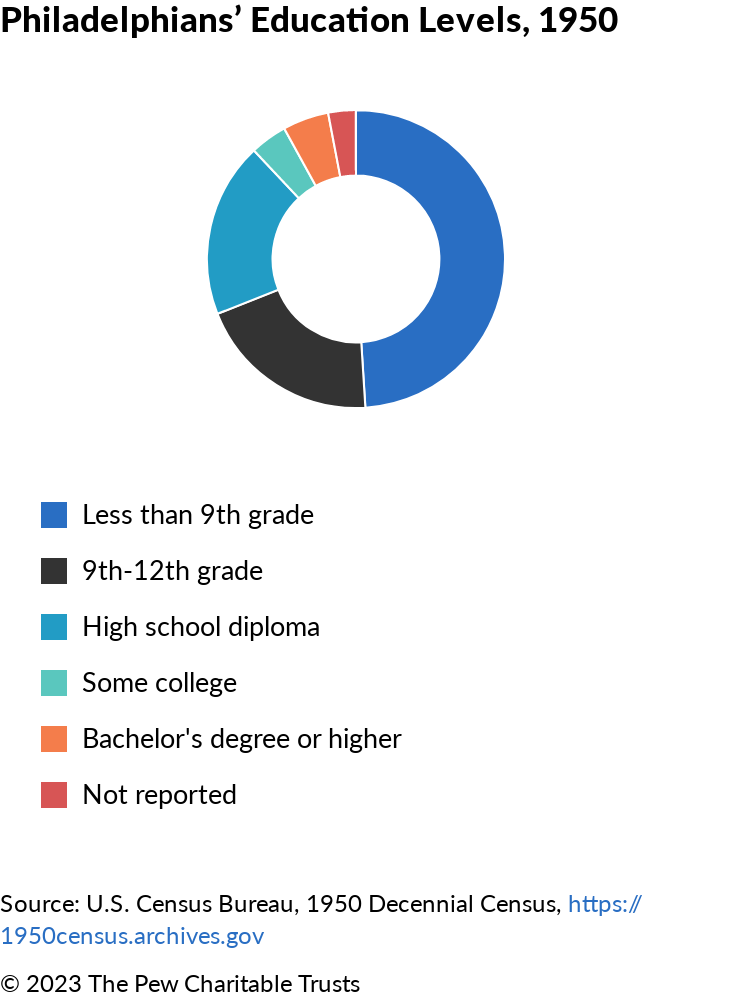
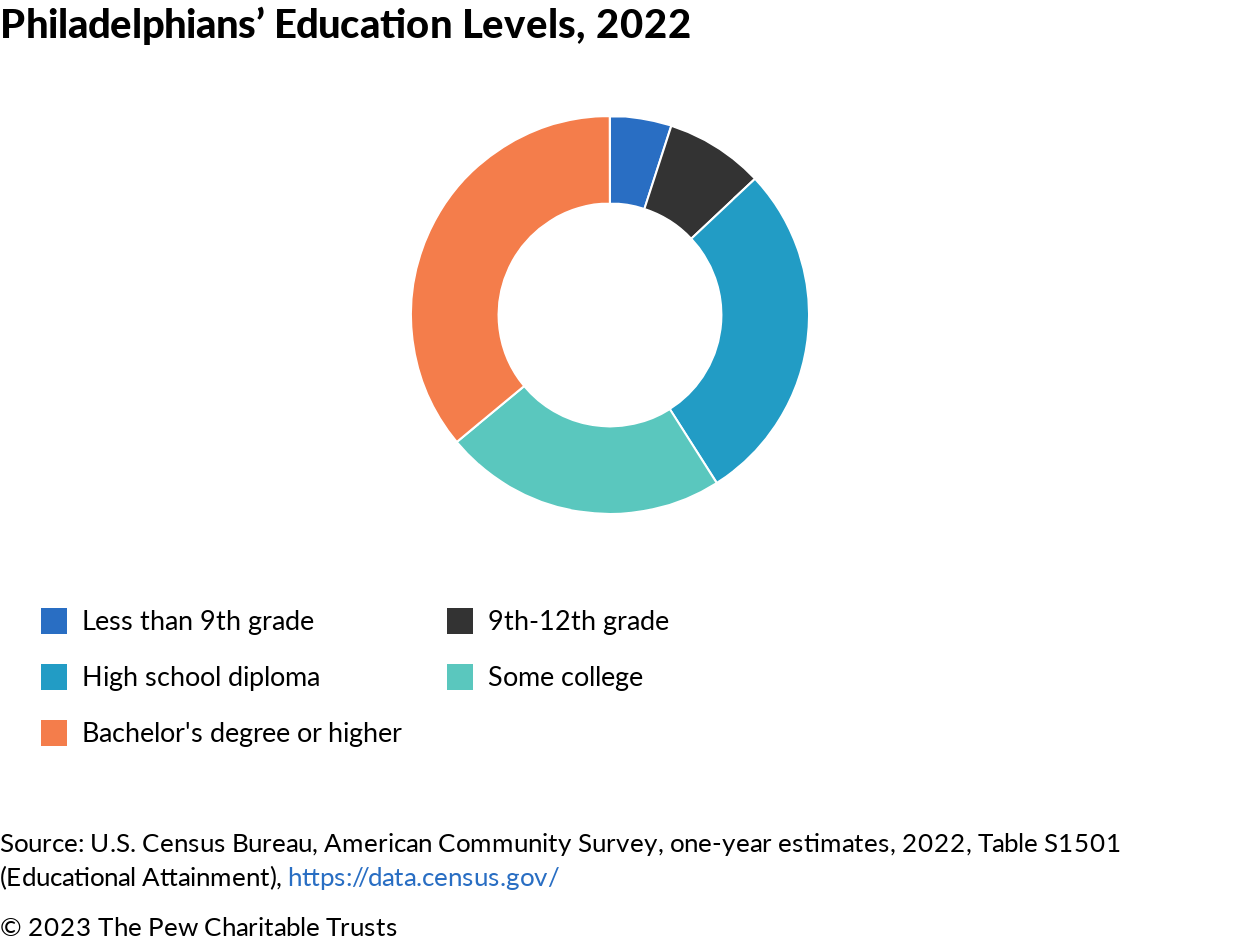
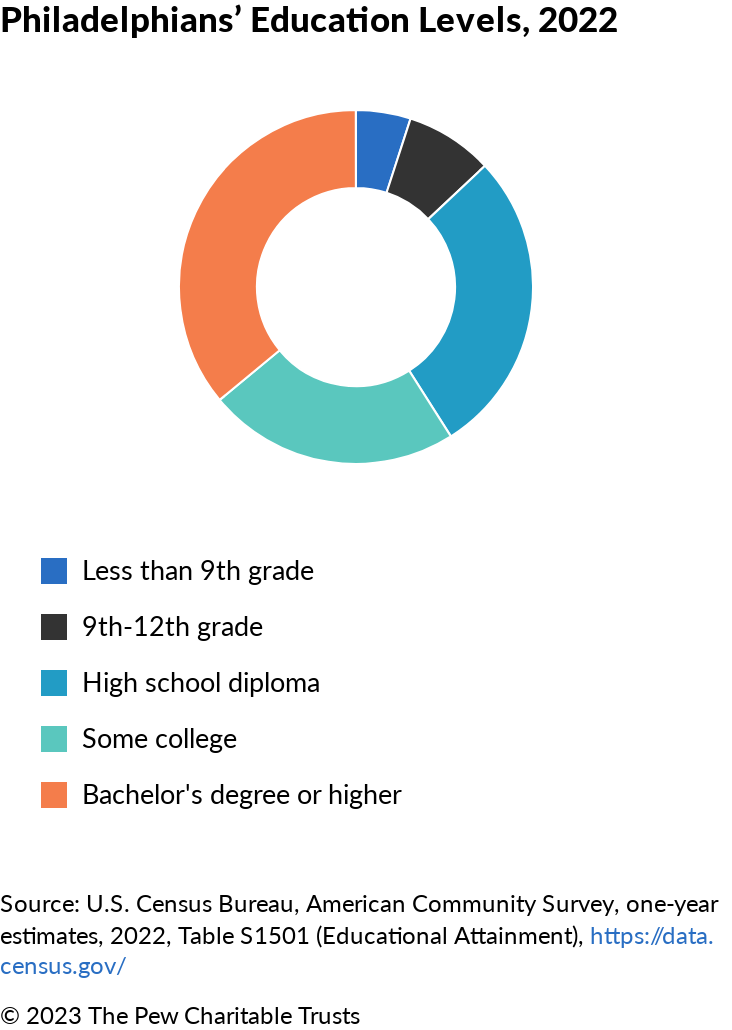
3. In 1950, the average adult Philadelphian had a ninth-grade education. Now, 36% of residents are college grads.
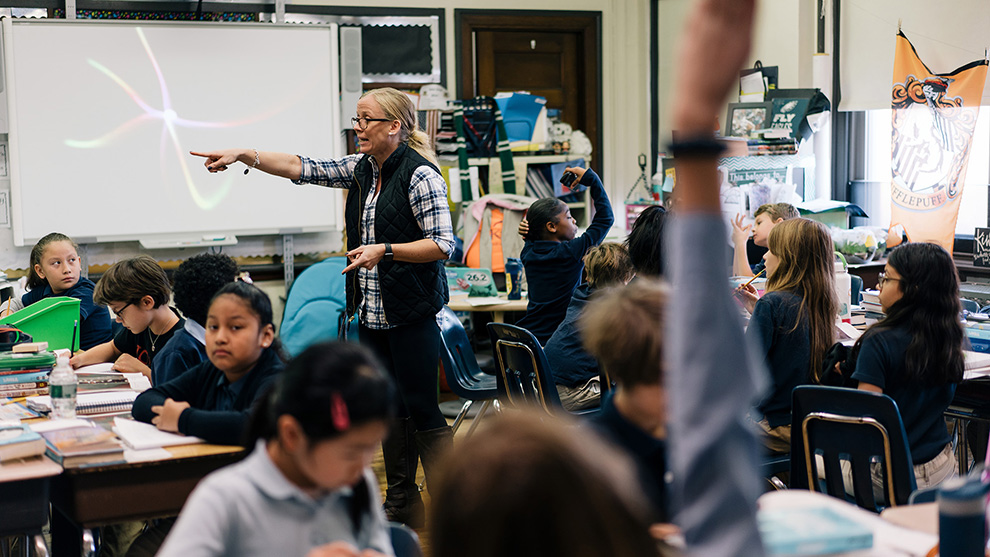
Nearly 75 years ago, the median number of years of schooling that people 25 or older completed was nine. Today, only 5% of Philadelphians have less than a ninth-grade education.
Another sign of Philadelphians’ increased education levels: Census data for 2022 showed that 36.3% of Philadelphians age 25 or older held bachelor’s degrees—higher than the national rate of 35% for the first time. This is the highest percentage on record for the city and represents an increase of 12 percentage points since 2012.
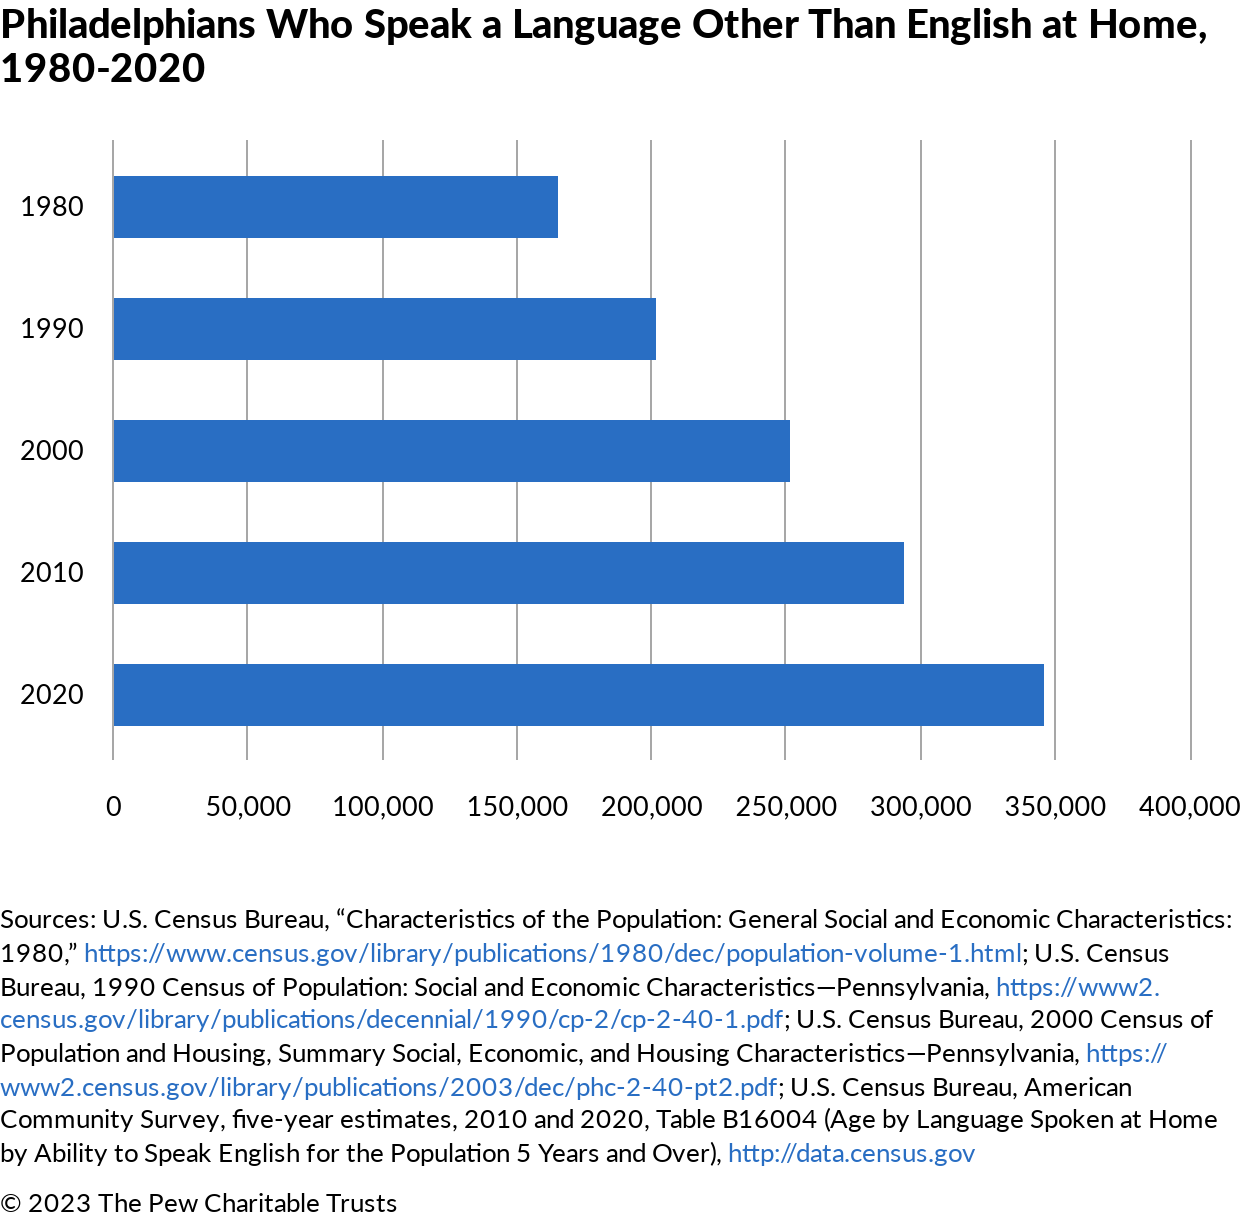
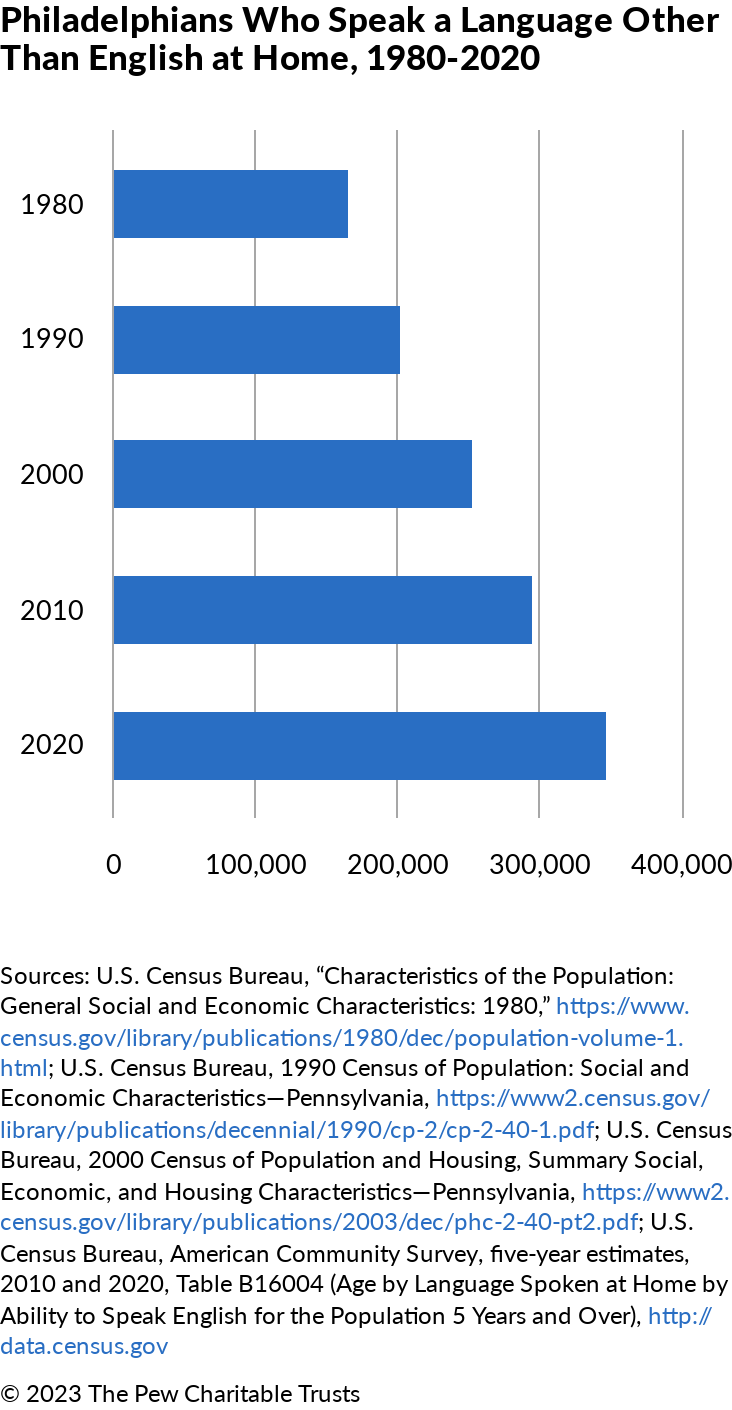
4. In 1980, Italian was the most common non-English language in Philadelphia. Today, it’s Spanish.
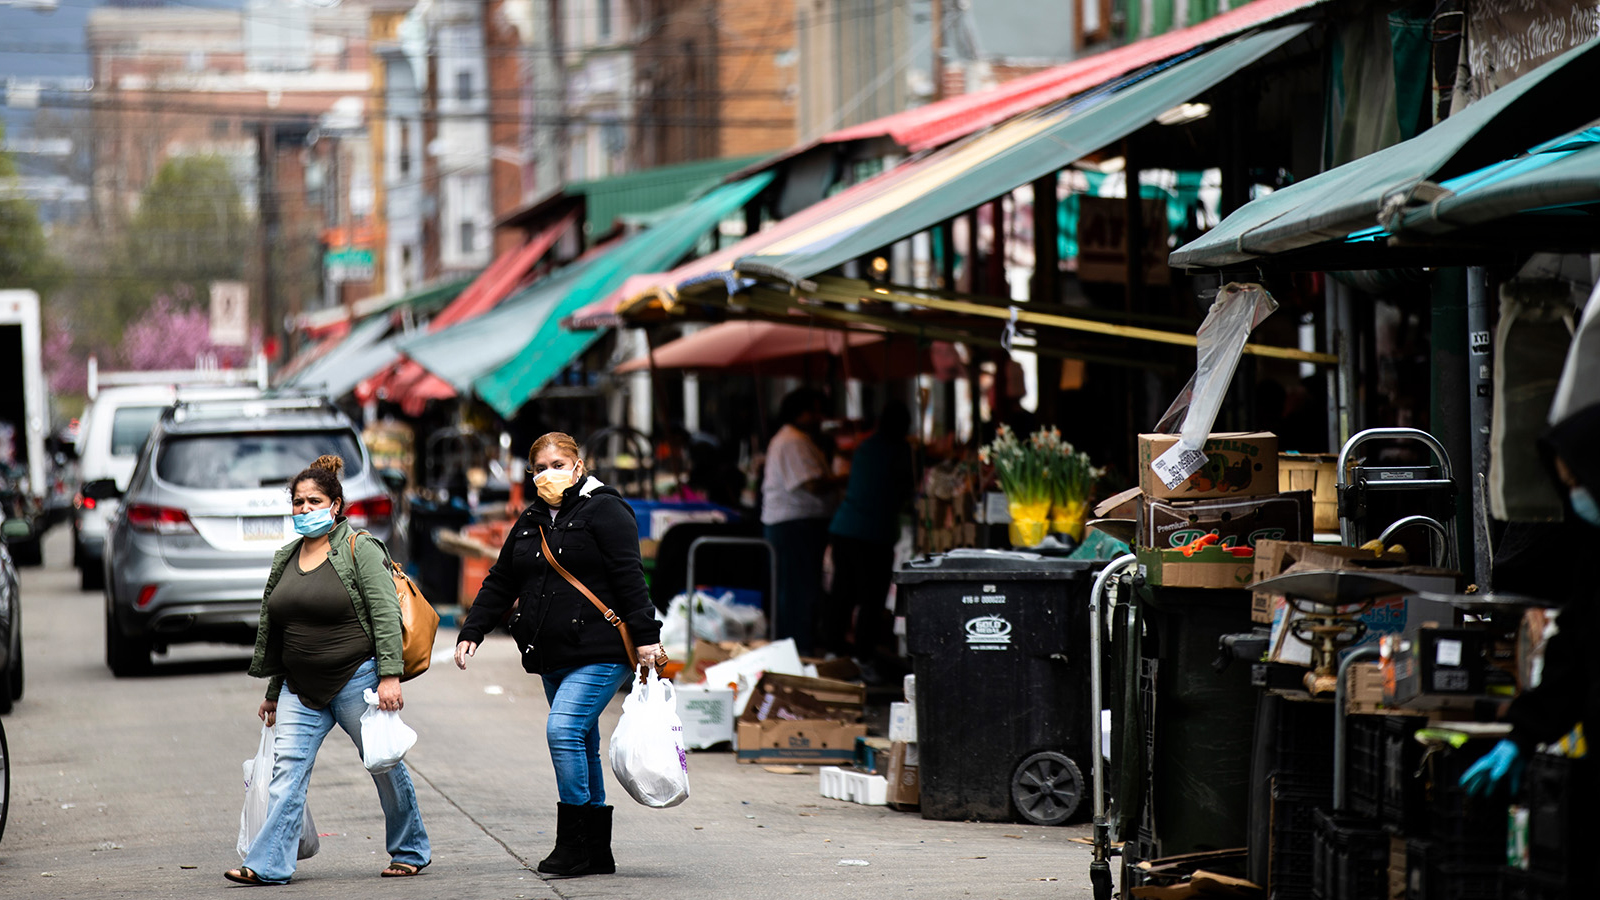
These days, Spanish is decidedly the second most popular language in the city; 45% of non-English-speaking Philadelphians over age 5 speak Spanish—up from 22% in 1980. Since 2000, that increase has been fueled in part by the near-doubling of the share of residents who identify as Hispanic.
Today, nearly a quarter of Philadelphians speak a language other than English at home—an increase of almost 2.5 percentage points since 2010.
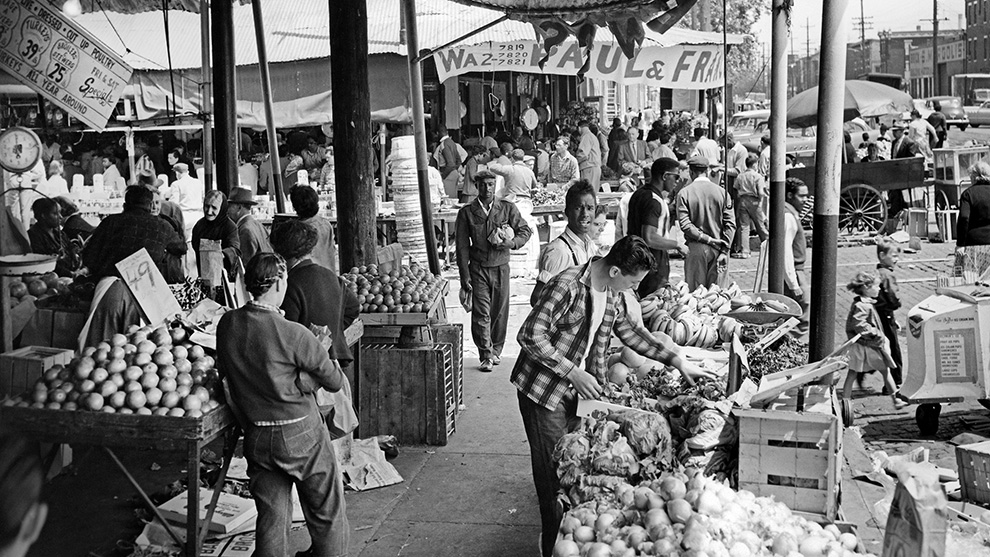
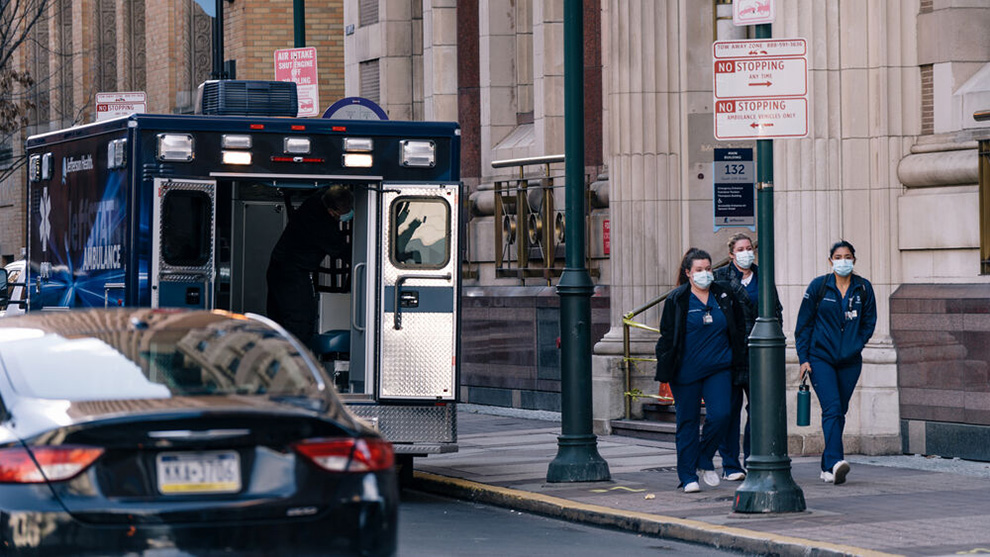
5. Philadelphia was once a manufacturing capital—known for textiles like cowboy hats. Now, “eds and meds” dominate.

In the 1950s, Philadelphia was a magnet for manufacturing—with approximately 45% of jobs in the manufacturing sector.
And even though hats of all kinds had seen their heyday by the 1950s, Philadelphia remained home to one of the largest manufacturers of cowboy hats in the country—the John B. Stetson Co.—through 1970. With over a million square feet of floor space in North Philadelphia, Stetson was a symbol of the city’s previous status as America’s manufacturing capital.
Today, manufacturing makes up only 3% of all jobs in Philadelphia, and the city’s largest employment sectors are now education, medicine, and professional and business services.
What became of the Stetson plant? Like many other industrial buildings in the city and elsewhere, the former factory is now home to loft apartments.
6. In 1950, the median household income in Philadelphia was $2,869 (just under $37,000 in today’s dollars).

That median household income is the equivalent of $36,849 in today’s dollars. Two things that $2,869 could have bought you in 1950? A new Volkswagen Beetle ($1,280) and tuition for a semester at the University of Pennsylvania ($600) or Temple University ($260).
In 2022, Philadelphia’s median household income was $56,517, compared with the nationwide median of $74,755.
Median Household Income in Philadelphia, 1950 vs. 2022
| 1950 | 2022 | |
|---|---|---|
| Median income | $2,869 | $56,517 |
Sources: U.S. Census Bureau, 1950 Decennial Census, https://1950census.archives.gov; U.S. Census Bureau, American Community Survey, one-year estimates, 2022, Table S1903 (Median Household Income in the Past 12 Months), http://data.census.gov
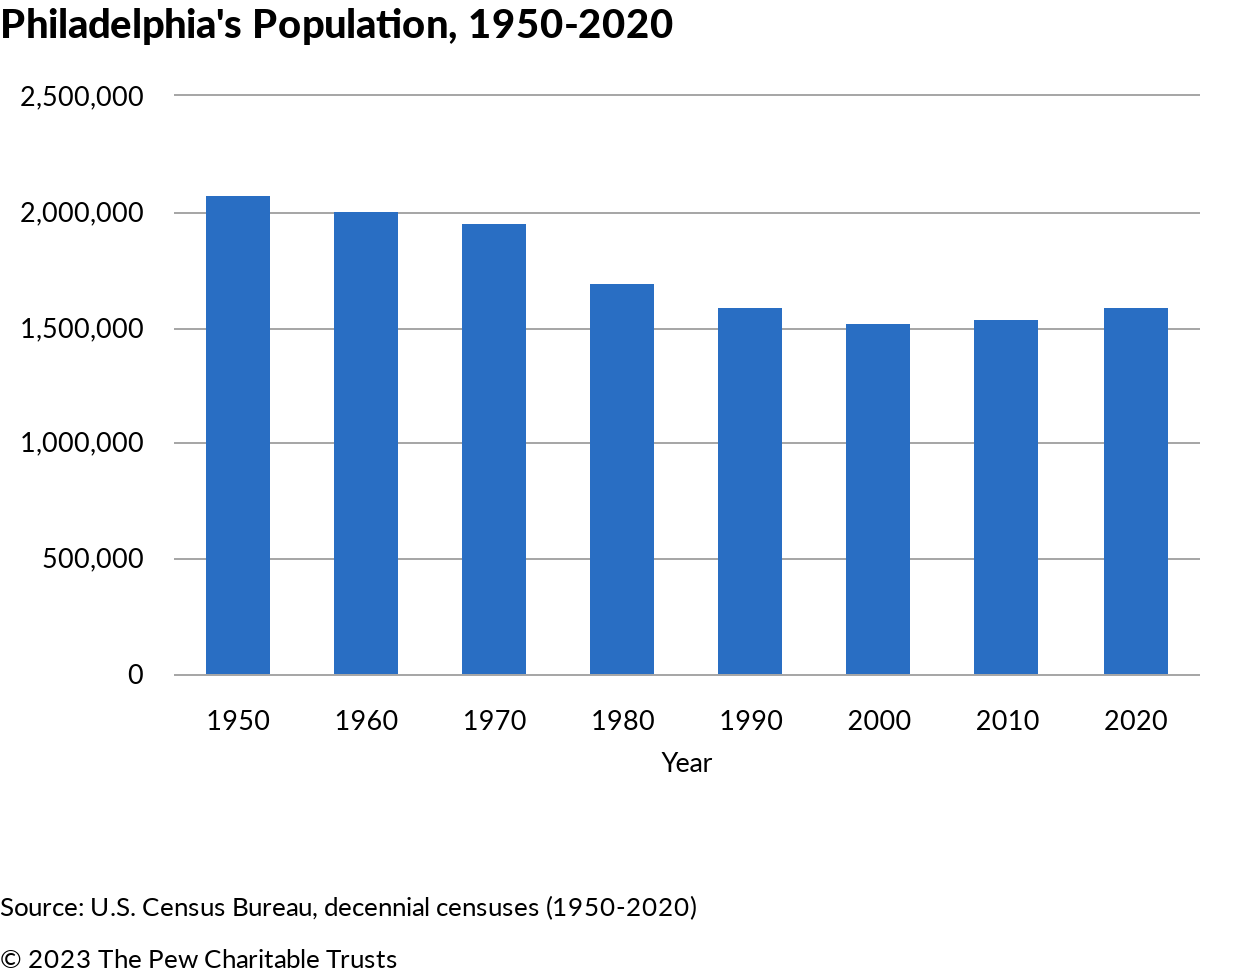
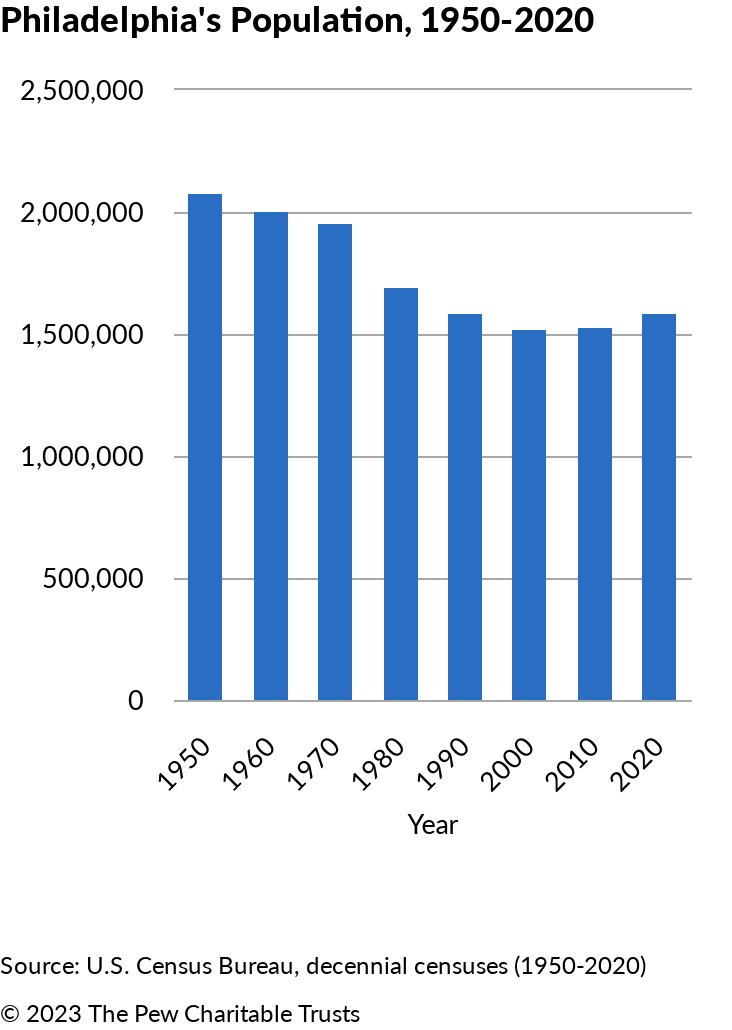
7. Philadelphia’s population has shrunk by nearly 30% since 1950.

Philadelphia lost approximately 22,000 residents from 2021 to 2022, according to U.S. Census Bureau data. That’s the largest single-year decline since 1977, the year that “Rocky” won the Oscar for best picture, and it highlights a significant impact of COVID-19.
Cities throughout the country experienced population declines during the pandemic as a shift toward the suburbs and remote work changed how many people live and work.
“One-year change is not going to be a major impact; it’s the trend over time [that matters],” Pew’s Katie Martin told The Philadelphia Inquirer. “We just have too few years of data at this point to say that this is a definitive trend.”
So what does that trend over time show?

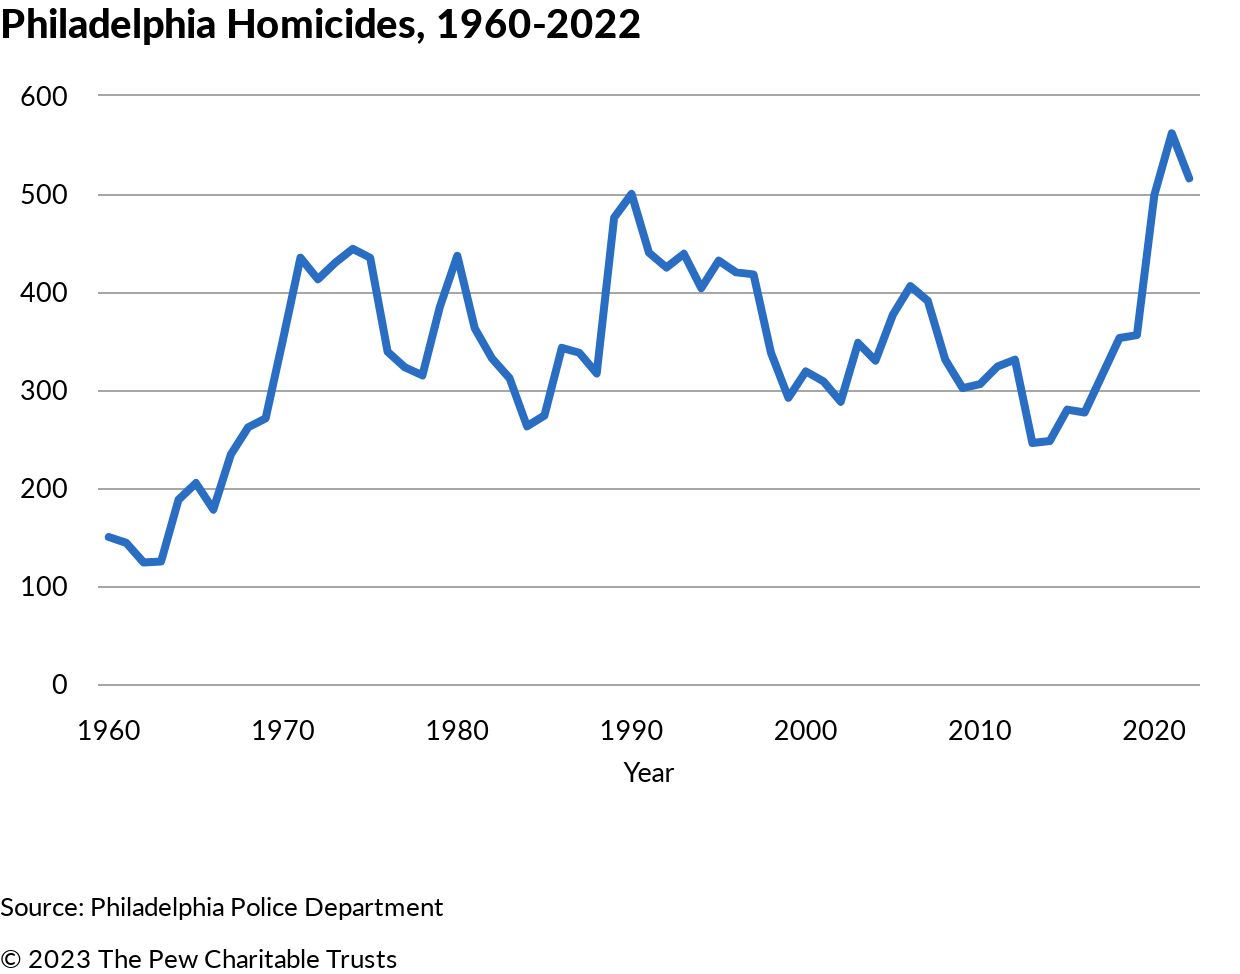
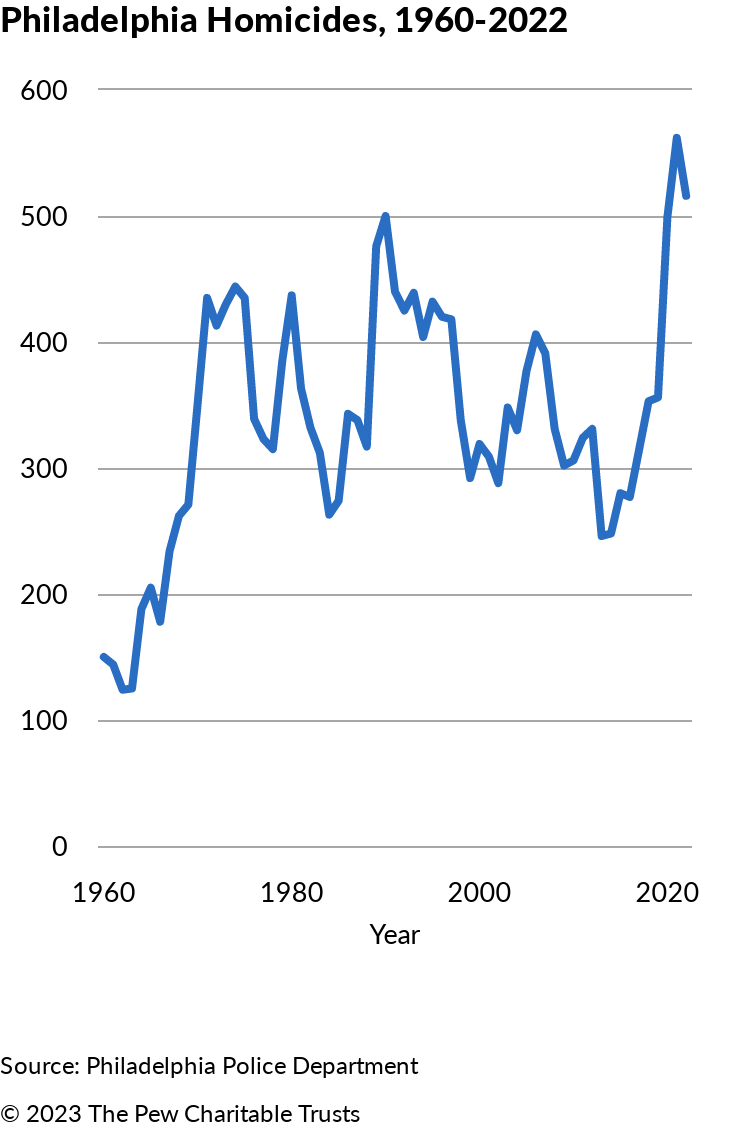
8. Today, the city has fewer residents than in 1960—but more homicides per capita.

Philadelphia’s homicide rate has skyrocketed since 1960 (the first year for which this data was available), when 150 people were reported murdered. In 2022, that number reached 516. However, through the first half of 2023, homicides were down approximately 20% compared with the previous year.
Perhaps unsurprisingly, crime and public safety are Philadelphians’ top concerns today, according to a 2023 Lenfest Institute for Journalism poll.
9. In 1950, the median home value was $7,009.
Nearly 75 years ago, the median home value in Philadelphia was $7,009, and the gross median rent was $36.42 a month.
In 2022, the median home value leapt to $237,900, and the median rent was $1,281 per month.
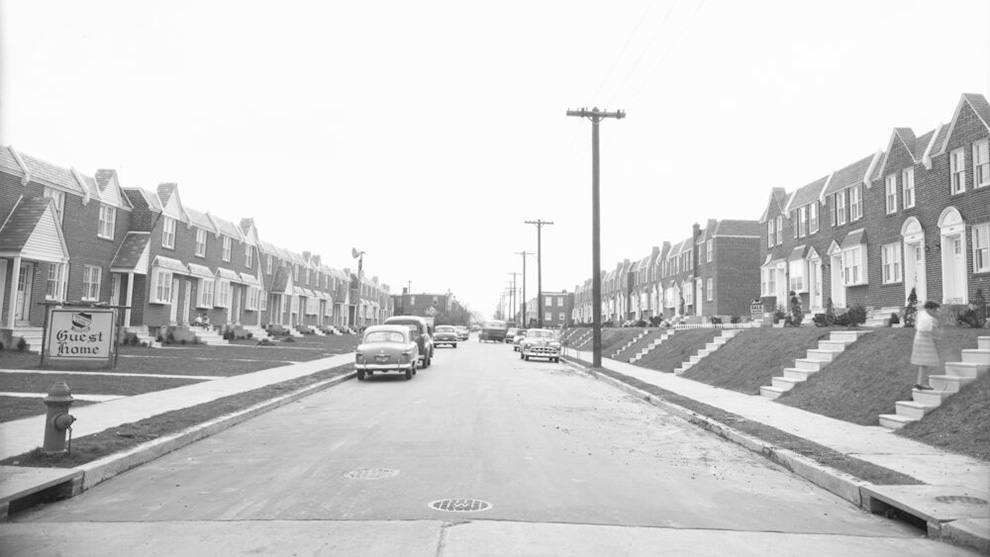
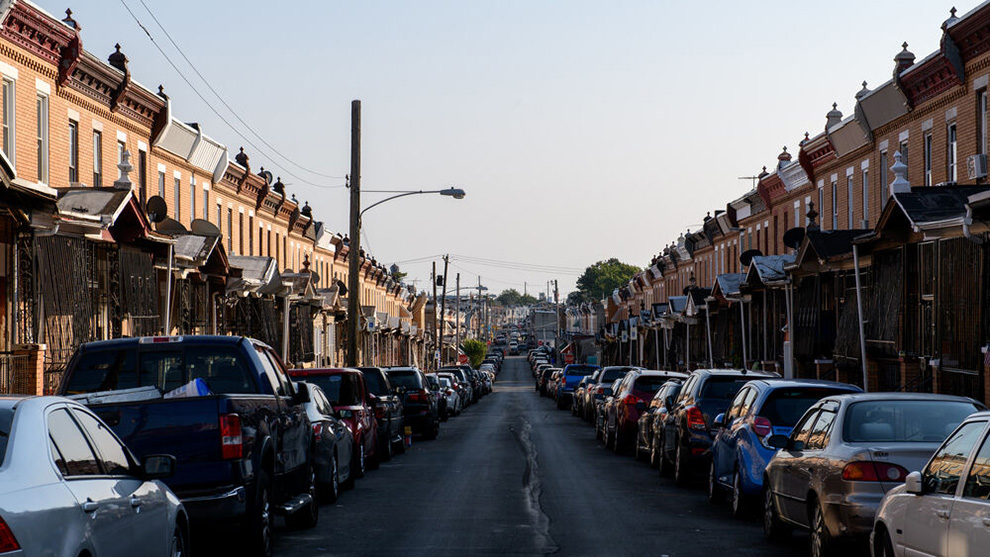
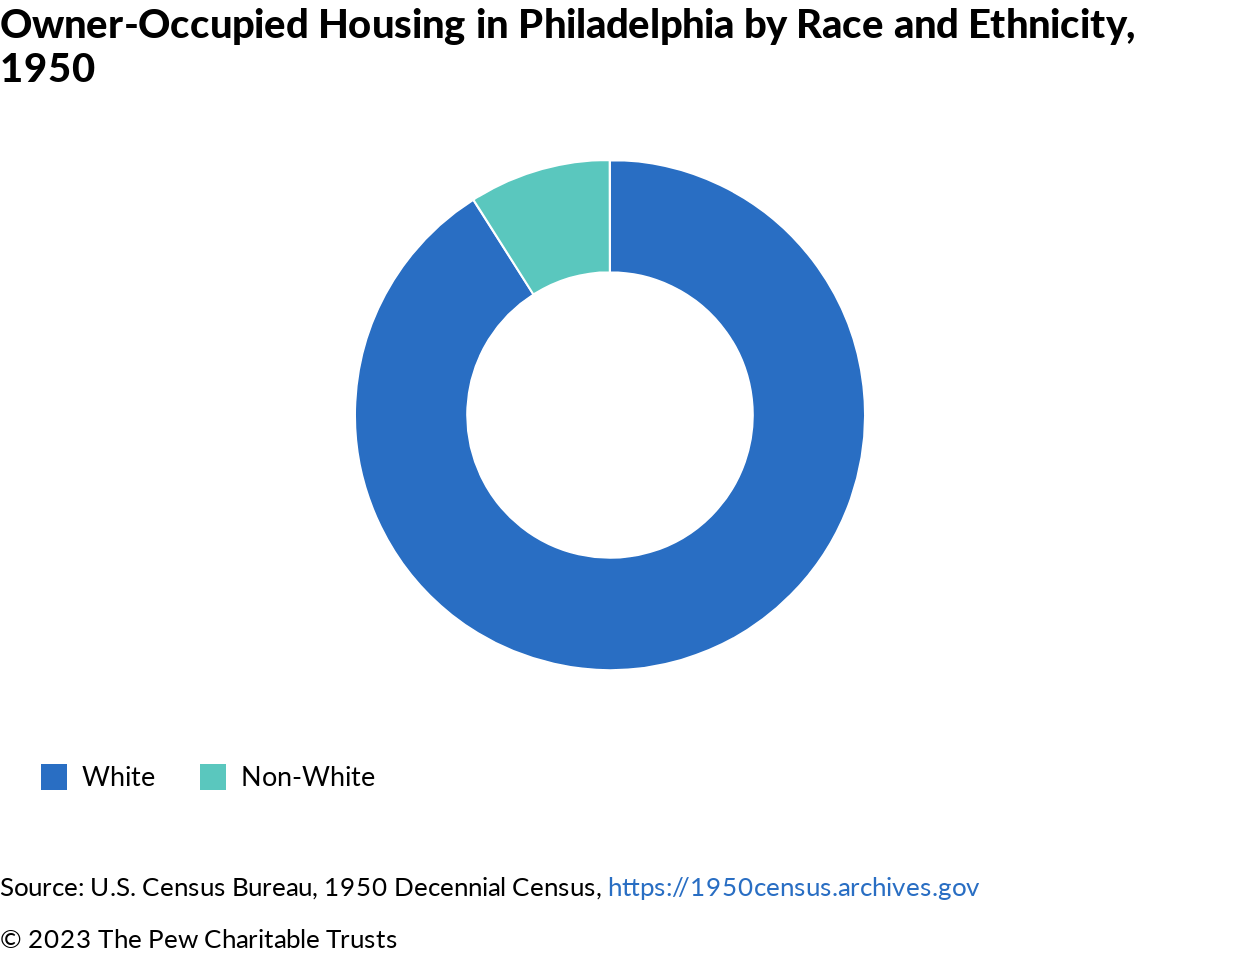
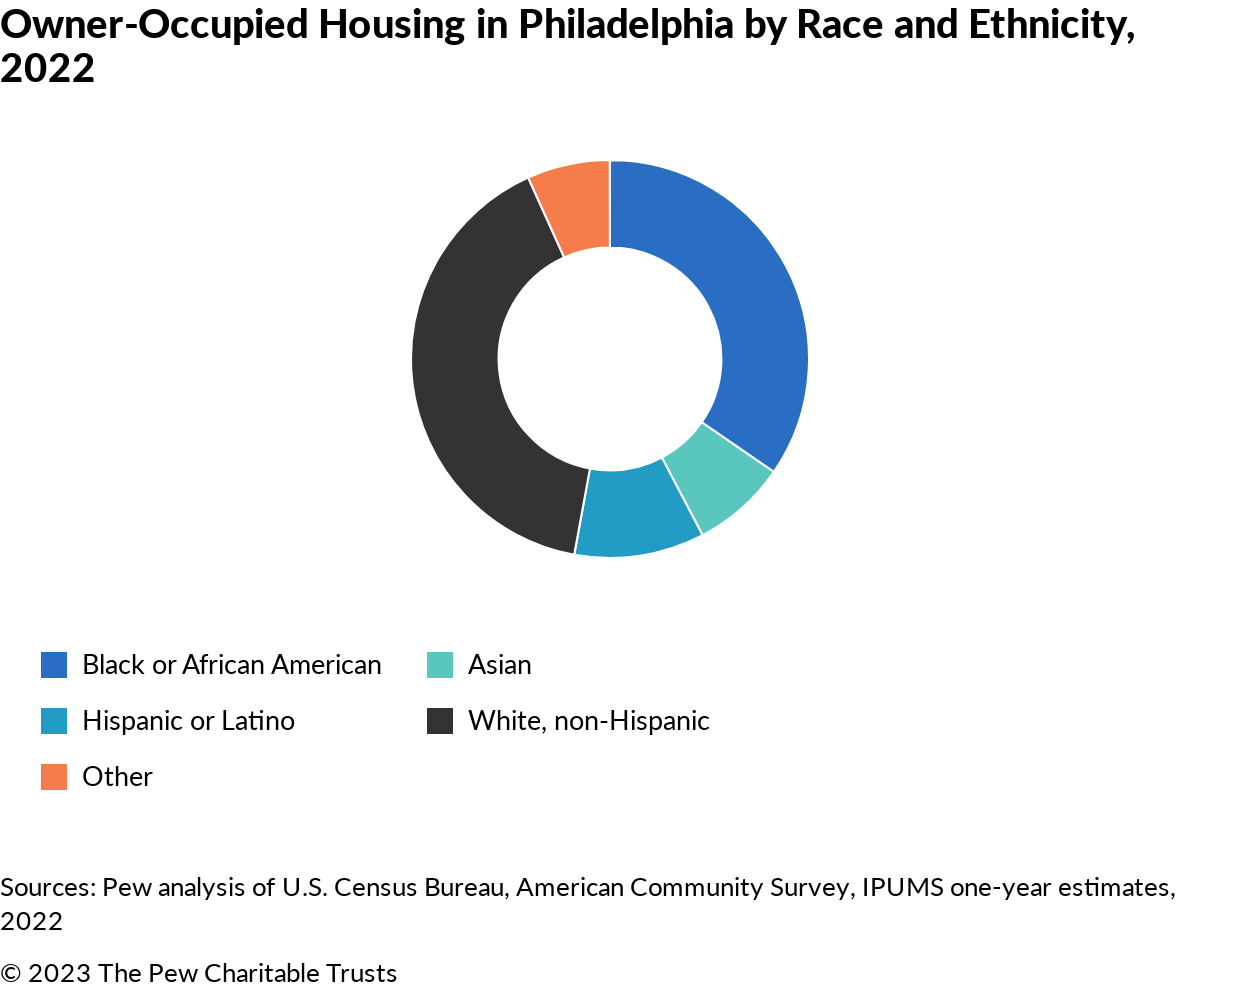
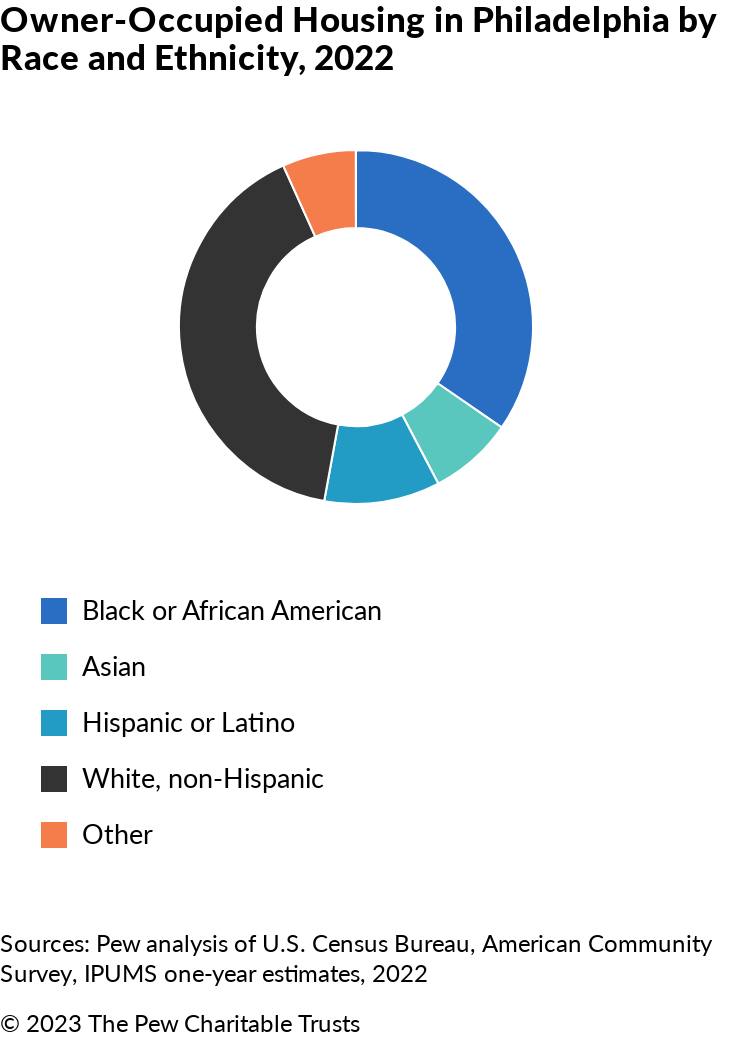
10. Homeownership by Black households has increased dramatically since the 1950s.

Despite higher home prices, the homeownership rate in Philadelphia hasn’t changed that much since 1950. Who owns Philadelphia’s homes, however, has changed. A lot.
In 1950, only 8.9% of the city’s owner-occupied housing belonged to people classified as non-White by the U.S. Census Bureau. By contrast, 36% of owner-occupied homes today are owned by Black or African American residents, 42% by White residents, 8% by Asian residents, and 11% by Hispanic residents.
Note: This analysis uses the most current data available for each topic covered. Therefore, the years that are used for comparison may vary from topic to topic. In addition, 1950 data is used to represent approximately 75 years ago because census surveys were performed only once every 10 years until the American Community Survey came into existence in 2006.

ADDITIONAL RESOURCES

Article


