Philadelphia’s Poverty Rates Explained in Five Charts
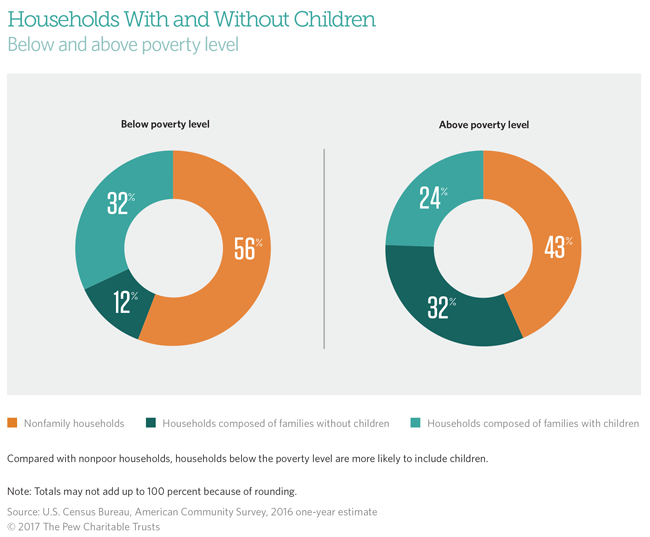
In 2016, families with children accounted for 32 percent of poor households in Philadelphia.
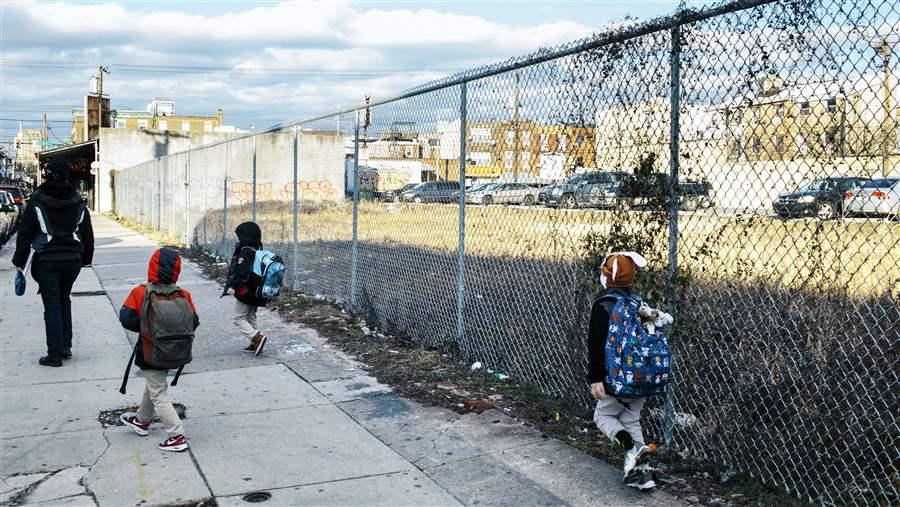
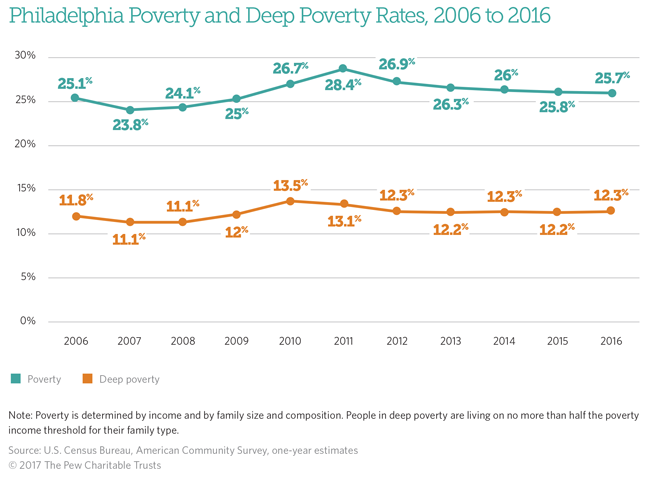
© Lexey Swall/GRAINPhiladelphia has the highest poverty rate among the nation’s 10 most populous cities, as well as the highest percentage of residents living in deep poverty, which is defined by the Census Bureau as half the poverty income threshold. Philadelphia’s deep poverty rate has generally been slightly less than half its overall rate; in 2016, it was 12.3 percent. For a family consisting of one adult and two children, the poverty threshold was $19,337 in 2016, and the deep poverty threshold was $9,669.
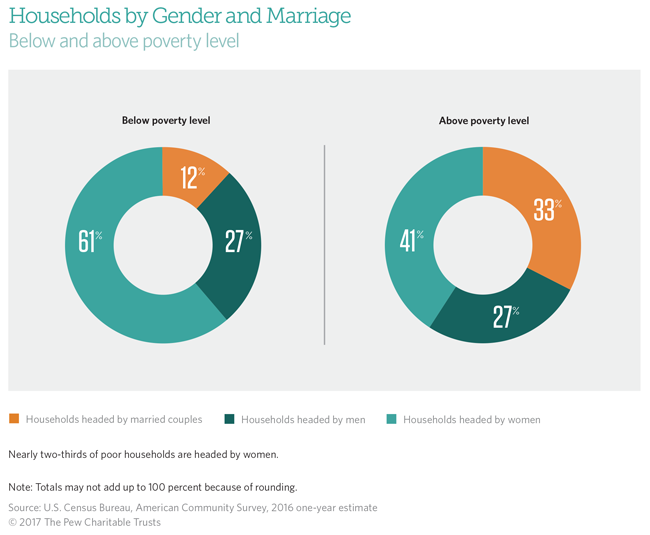
The household compositions of Philadelphia’s poor differ from those of the city’s nonpoor population. Of the poverty households, 61 percent were headed by women in 2016, compared with 41 percent of nonpoor households. Only 12 percent of the households in poverty consisted of married couples, with or without children; for the nonpoor population, it was 33 percent. The percentage of households headed by men was the same for the poor and the nonpoor (27 percent).
Another way of comparing the household compositions of the city’s poor and nonpoor populations is by looking at the presence of children. In 2016, 32 percent of poor households, accounting for 51 percent of all poor residents, consisted of families with children. Sixty-five percent of those poor families with children were headed by women. Among nonpoor households, 24 percent were families with children, and 39 percent of them were headed by women.
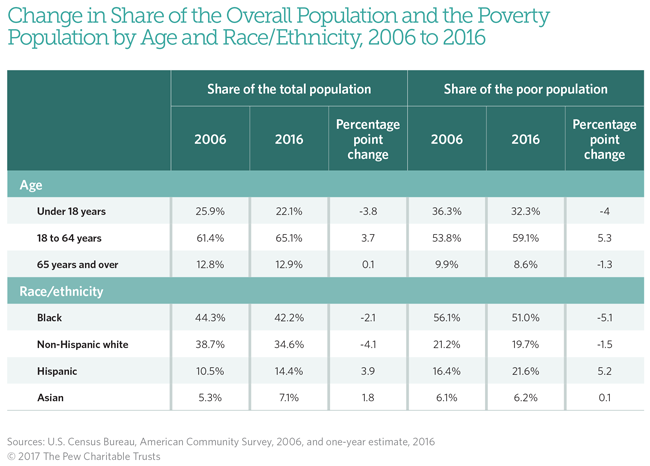
In the past decade, the demographic makeup of poverty in Philadelphia has changed, particularly when viewed by age, race, and ethnicity. The share of working-age adults among the city’s poverty population grew significantly over those 10 years, while the proportions of poor seniors and children have fallen. Among racial and ethnic groups, the Hispanic share has increased substantially; the Asian share has stayed about the same; and the shares of blacks and non-Hispanic whites have dropped. For the most part, these shifts have corresponded with changes in the city’s overall population.
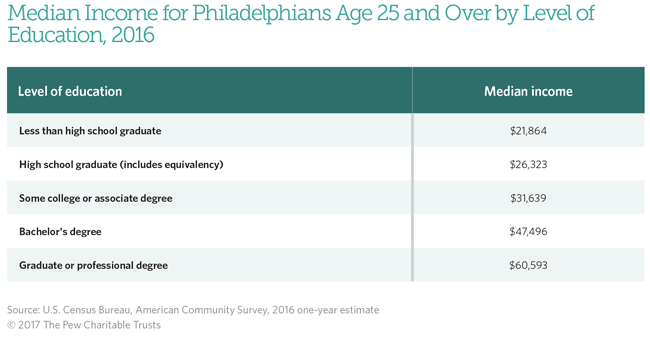
In Philadelphia, as elsewhere, people with higher education levels tend to be better equipped to get high-paying jobs and to avoid poverty. For Philadelphians age 25 and over, the poverty rate is 35.7 percent for those without a high school education, 25.5 percent for those with a high school degree or equivalent, 17.6 percent for those with some college or an associate’s degree, and 9 percent for those with a bachelor’s degree or higher.
For more statistics and charts on the demographics of poverty in Philadelphia, including comparisons with other cities and regions, read the full report, “Philadelphia’s Poor: Who They Are, Where They Live, and How That Has Changed.”
Larry Eichel is director of Pew’s Philadelphia research initiative; Octavia Howell is a researcher on the team and author of the study.


Philadelphia's Poor: Who they are, where they live, and how that's changed
Who they are, where they live, and how that has changed.


Comparing Philadelphia's Geography of Poverty With Other Regions


Poverty in Philadelphia
See all of The Pew Charitable Trusts' research on this topic.
tweetable fact
ADDITIONAL RESOURCES

Article


