Philadelphia Ranks High for Smoking and Other Unhealthy Behaviors
Federal data show how Philly compares with other big cities

A man smokes in the shade afforded by Interstate 95 in Philadelphia.
© Matt Rourke/APNew data from the Centers for Disease Control and Prevention (CDC) present a troubling picture of Philadelphians and their smoking, lack of exercise, obesity, binge drinking, and inadequate sleep. Among adult residents of the nation’s 30 largest cities, Philadelphians rank in the bottom 10 on all five unhealthy behaviors, which are considered risk factors for chronic diseases and lower health outcomes.
The data come from the CDC’s 500 Cities Project, created in collaboration with the Robert Wood Johnson Foundation, which provides city- and neighborhood-level information to help the cities better understand the health of their citizens and plan public health initiatives. The data source is a 2014 national telephone survey sponsored by the CDC and administered by state health departments. In the past, such data was available primarily at the county level. The data also show the role poverty plays in the increased percentage of people with unhealthy behaviors.
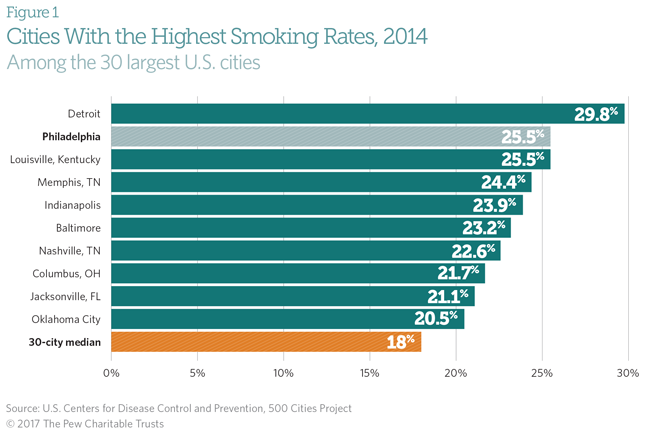
Smoking
Philadelphia had the second-highest smoking rate among the 30 largest cities; 25.5 percent of adult Philadelphians reported being smokers, which was tied with Louisville, Kentucky, and fell behind only Detroit at 29.8 percent. Seattle had the lowest smoking rate, at 11.7 percent. The national rate was 17.5 percent, and the median for the 30 cities was 18 percent. Another survey—conducted in the Philadelphia area by Public Health Management Corp. and reported in Pew’s “Philadelphia 2017: The State of the City” —found a smoking rate in the city of 22 percent.
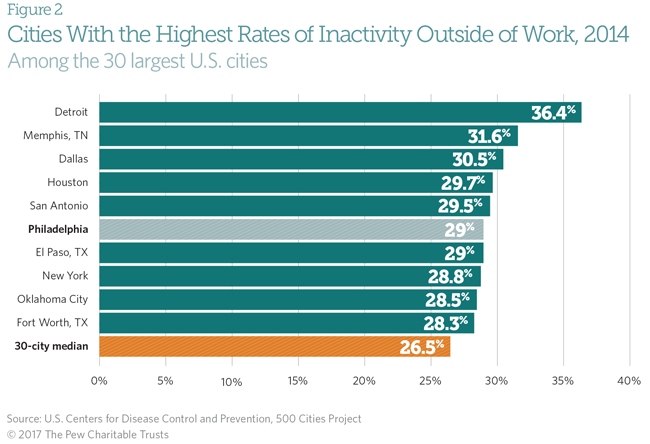
Exercise
Philadelphia tied for sixth worst among the 30 cities when it came to lack of exercise. Twenty-nine percent of adult Philadelphians, the same figure as for El Paso, Texas, answered “no” to the following question: “During the past month, other than your regular job, did you participate in any physical activities or exercises such as running, calisthenics, golf, gardening, or walking for exercise?” Detroit had the highest rate of inactivity (36.4 percent), and Seattle the lowest (13.6 percent). The national rate was 23.3 percent, and the median for the 30 largest cities was 26.5 percent.
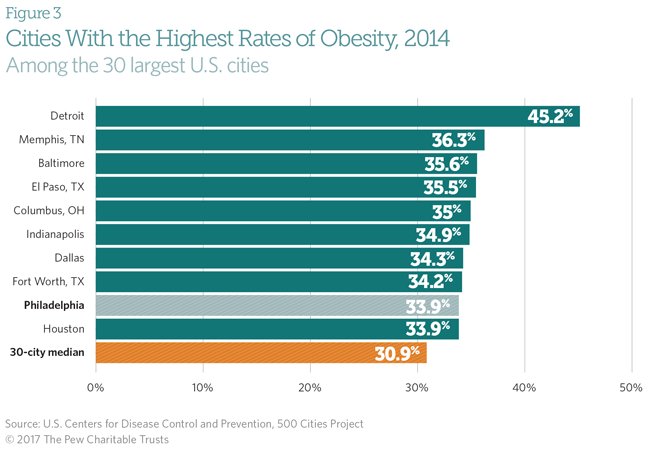
Obesity
Philadelphia had the ninth-highest obesity rate, tied with Houston; 33.9 percent of the city’s adult residents qualify as obese, defined as having a body mass index equal to or greater than 30. Body mass index is calculated by taking one’s weight in kilograms and dividing it by the square of one’s height in meters. Rates were calculated based on self-reported weight and height in the CDC survey, which is known as the Behavior Risk Factor Surveillance System. Detroit had the highest rate on this measure as well, 45.2 percent, and San Francisco had the lowest, at 18.4 percent. The national rate was 28.7 percent, and the 30 city median was 30.9 percent.
Binge drinking and sleep deprivation
Philadelphians fared poorly in binge drinking and for sleep deprivation as well.
Binge drinking is defined for men as having five or more drinks on an occasion in the past month, and for women as four or more drinks on one occasion. Philadelphia’s adults reported the eighth-highest rate of binge drinking (17.5 percent). Portland, Oregon, had the most binge drinkers (20.4 percent), while Memphis had the fewest (9.6 percent). The national rate was 16.8 percent, and the median city rate was 15.6 percent.
On sleep deprivation, 44.3 percent of Philadelphia’s adults said they sleep less than 7 hours on average, the third-highest percentage among the 30 cities; the CDC recommends at least 7 hours of sleep for all adults. Detroit ranked worst in this category as well, with 50.8 percent of its residents reporting less than 7 hours of sleep, while Denver ranked best, at 28.1 percent. The national average was 35.1 percent, and the 30 city median was 36.2 percent.
Poverty and unhealthy behaviors
On four of the five unhealthy behaviors, cities with poverty rates of 20 percent or higher (like Philadelphia) tended to perform more poorly than cities with lower poverty rates. On obesity, for instance, eight of the ten worst performing cities had poverty rates of at least 20 percent; on sleep deprivation, smoking, and lack of exercise, four of the bottom five did. The exception was binge drinking; only three of the 10 worst on this measure had poverty rates of 20 percent or higher— Boston, Chicago, and Philadelphia.
Conclusion
The 500 Cities Project represent a good one-time snapshot of health indicators for these big cities, but Philadelphia also has tracked several of the “unhealthy” behaviors over time, with data from the CDC and the Community Health Database of Public Health Management Corporation. The city’s trends show improvement in some areas but not in others. For instance, in recent years Philadelphia’s incidence of smoking has gone down. Since 2010, the city has operated a program known as Get Healthy Philly, which focuses on reducing smoking, promoting exercise, and increasing access to healthy food. Obesity, however, continues to increase among adult Philadelphians, and the level of drinking has been relatively stable.
Larry Eichel is the director of Pew’s Philadelphia research initiative, and Stephen Camp-Landis is a researcher on the team.


ADDITIONAL RESOURCES

Article

Article


