State and Local Governments Face $105 Billion in Deferred Maintenance for Roads and Bridges
After years of underinvestment, better data and increased investment are needed to manage this growing liability

Overview
Are states investing enough in roads and bridges to prevent them from falling apart and to avoid leaving future generations on the hook for a costly repair bill? Historically, a lack of consistent information on the condition and needs of this infrastructure in states has limited policymakers’ ability to answer this question, prevented governments from making fully informed investment decisions to address maintenance backlogs, and hindered public accountability and transparency about whether decisions are fiscally sustainable.1
With these limitations in mind, The Pew Charitable Trusts examined data from the Bureau of Economic Analysis (BEA) and the Federal Highway Administration (FHWA) to estimate state and local deferred maintenance backlogs for roadways from 1999 through 2023.2 For the purposes of this analysis, “roadways” refers to state and locally owned roads, bridges, and related structures and assets, or what the BEA data categorizes as “highways and streets.”
The analysis shows that during that period, state and local governments fell short of the investments needed to maintain the value of their roadways by $105 billion. Over the first two decades of the 21st century, real investments in state and local roads and bridges fell, and depreciation—the annual decline in the value of infrastructure assets from wear and tear, damage, and age—outpaced spending on preservation, rehabilitation, and repair.3
This brief explores these national findings, which, although they cannot answer questions about individual state performance, highlight the broader roadway-related challenges facing state and local governments, help policymakers understand the scale and scope of needed investments, and underscore the importance of more consistent and detailed data and reporting.
What Is Deferred Maintenance?
Deferred maintenance is the accumulated gap between what should have been invested to preserve, maintain, and repair public infrastructure and what was actually spent for those purposes. When states put off fixing roads and bridges, they create a liability that will place demands on future budgets and leave residents to drive on roadways that are in poor condition.
State and local investments have declined
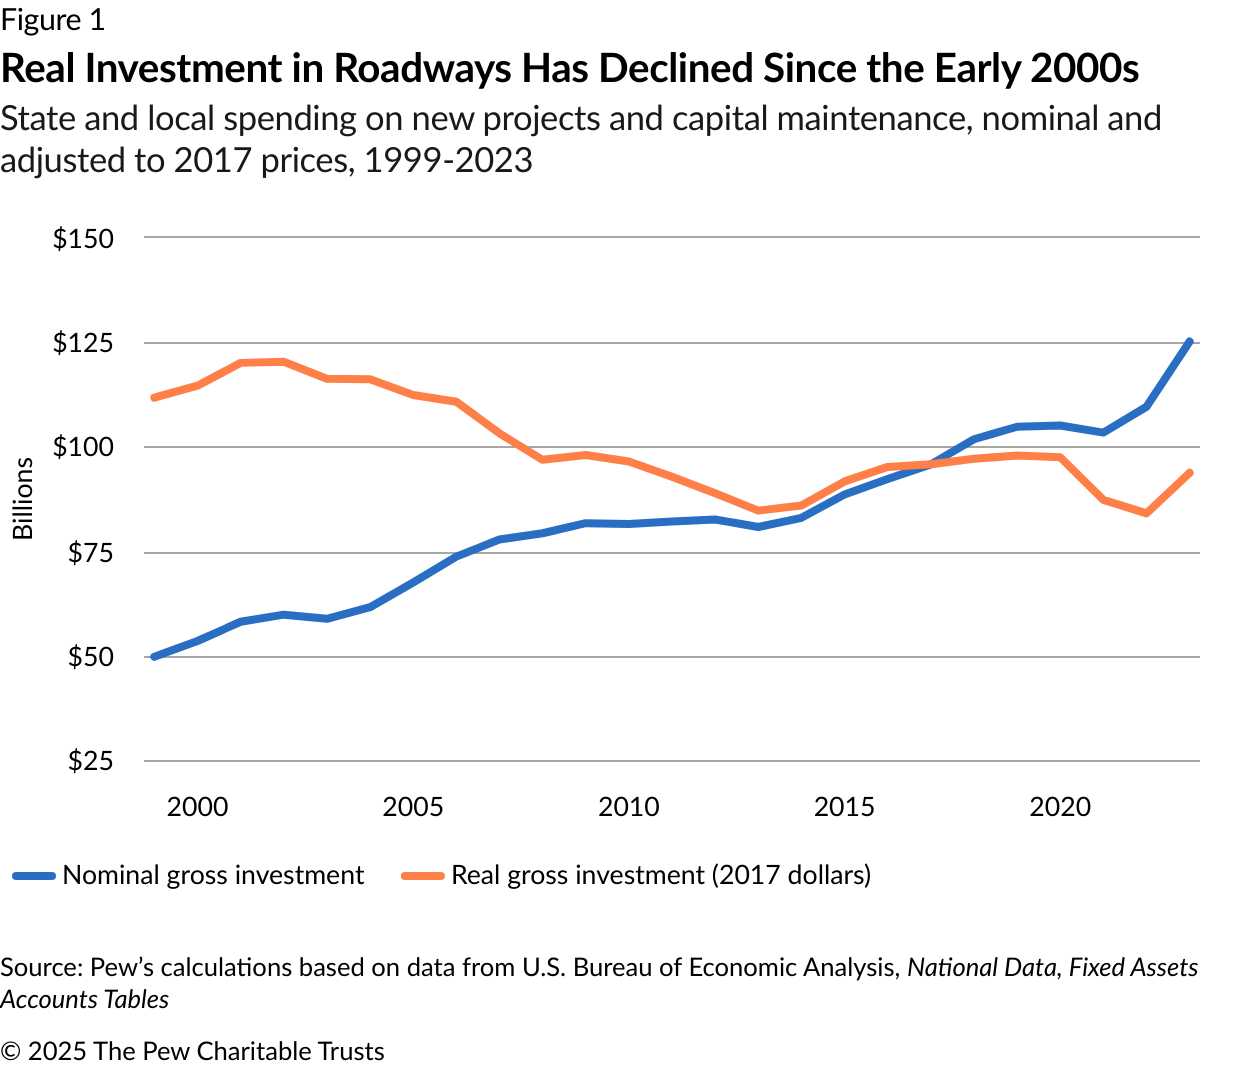
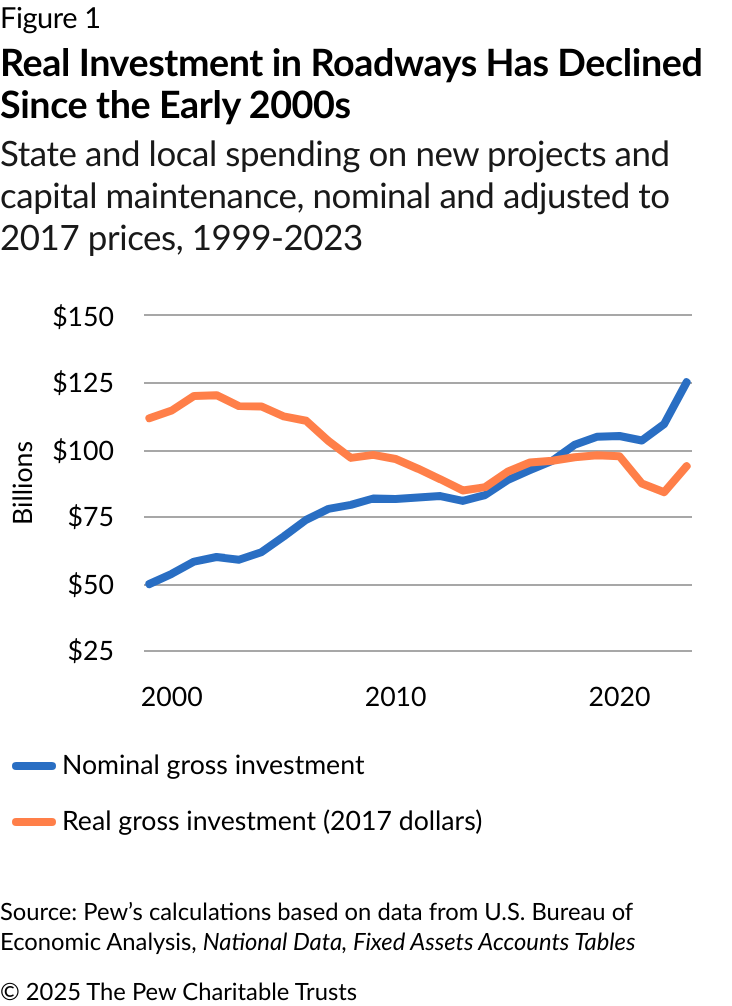
In 1999, state and local governments spent $50 billion on roadways, including for repairs to existing roads and bridges and for new construction. (See Figure 1.) By 2023, that spending had increased to $125 billion, but after adjusting for rising construction costs and other inflationary pressures, the real value of those investments, also called the “real gross investments,” declined. The BEA normalizes investments in infrastructure across years to present a “constant price” based on 2017 costs.4 The $50 billion spent in 1999 is equivalent to $112 billion in 2017 road and bridge construction costs. So, although state and local investments rose from $96 billion in 2017 to $125 billion six years later, the 2023 figure would cover only about $94 billion worth of new highway projects and needed maintenance and repairs based on 2017 prices. As a result, despite the higher spending, the real gross investments decreased over time.
Net investments in roadways are declining
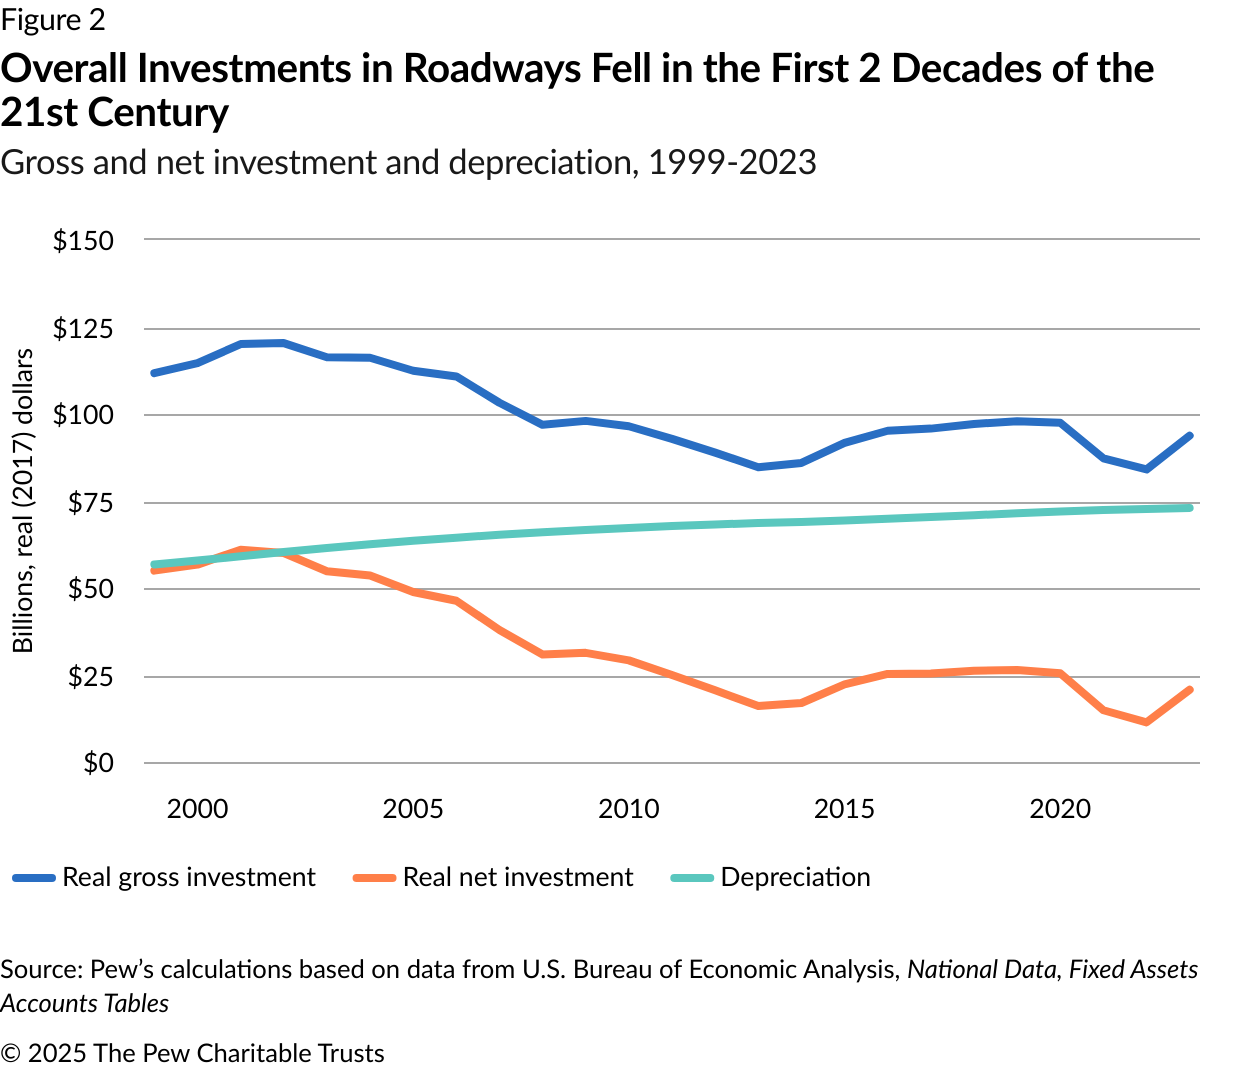
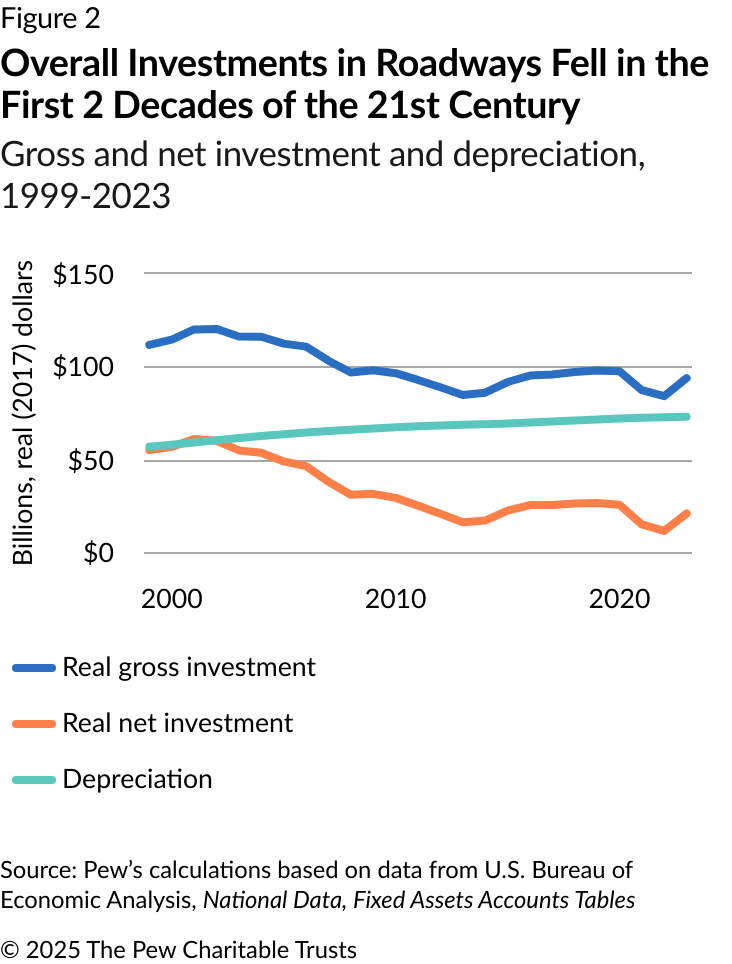
Despite the decline in real investments, the value of state and local roadways still increased by about $791 billion in real terms from 1999 to 2023. This rise in asset value led to higher maintenance costs, with depreciation growing from about $57 billion in 1999 to $73 billion in 2023. (See Figure 2.) This trend underscores the increasing financial resources required to preserve and maintain roadway assets over time.
The change in value of state and local roadways in a given year is represented by “net investment,” which is calculated by subtracting states’ estimated depreciation from their annual real gross investments. From 1999 through 2003, net investment in state and local highways averaged $57.5 billion annually, but over the ensuing 20 years, it dropped to less than $25 billion annually. This decline resulted from the combination of increased annual depreciation driven by the expansion of highway infrastructure and shrinking total investments, especially after 2003.
Maintenance versus new construction
Although total state and local investments exceeded annual depreciation during the study period, as demonstrated by the fact that net investment remained positive, not all of this spending is directed toward preserving existing roads and bridges. New roads and bridges must also be built, and every dollar spent on new projects represents a missed opportunity to invest in critical maintenance or rehabilitation of existing assets.
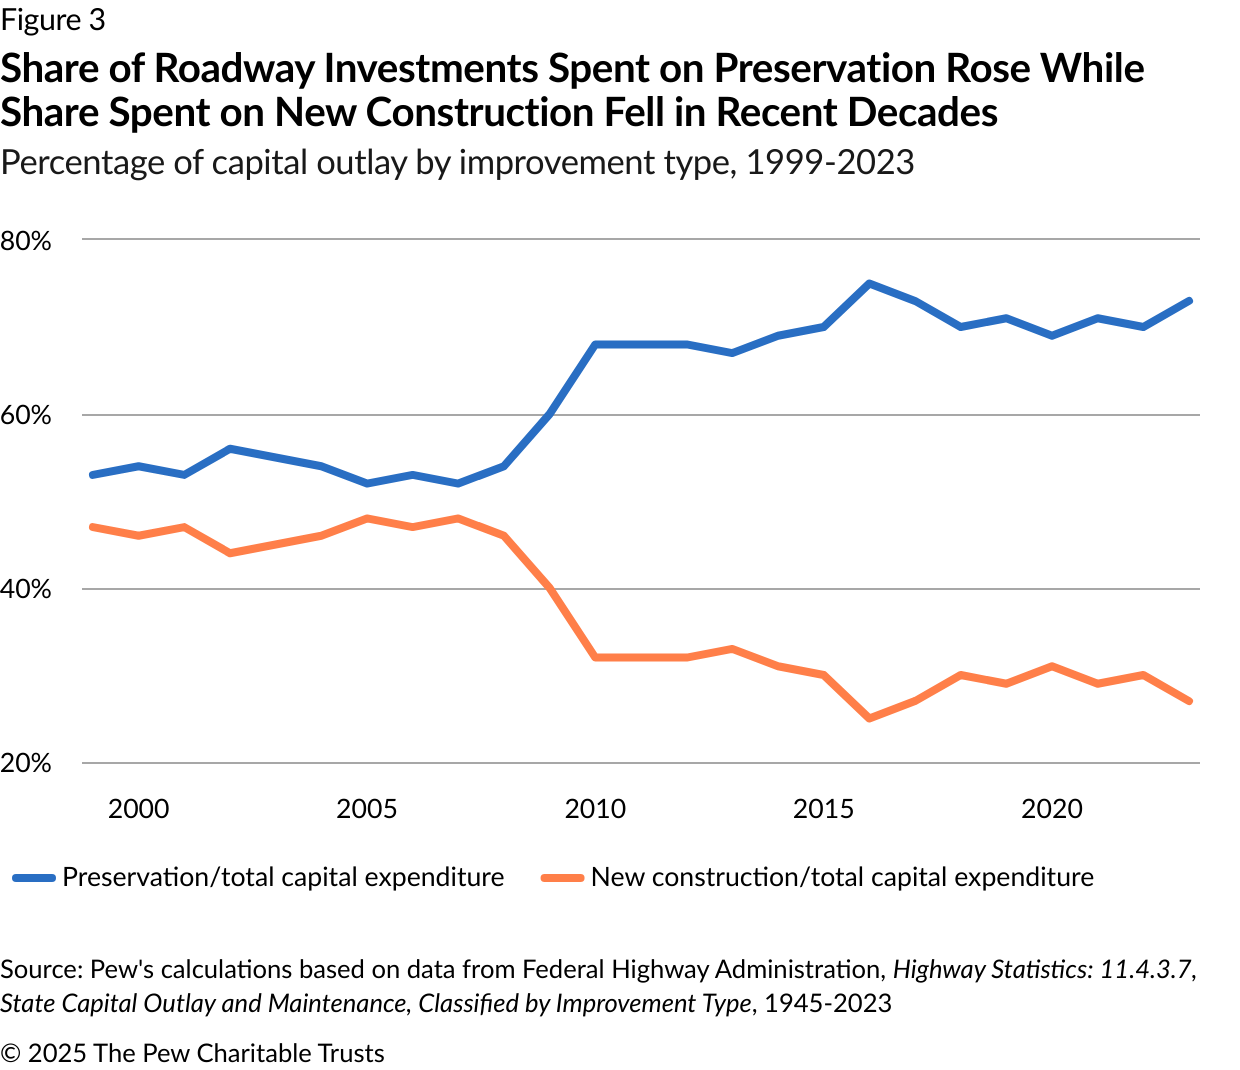
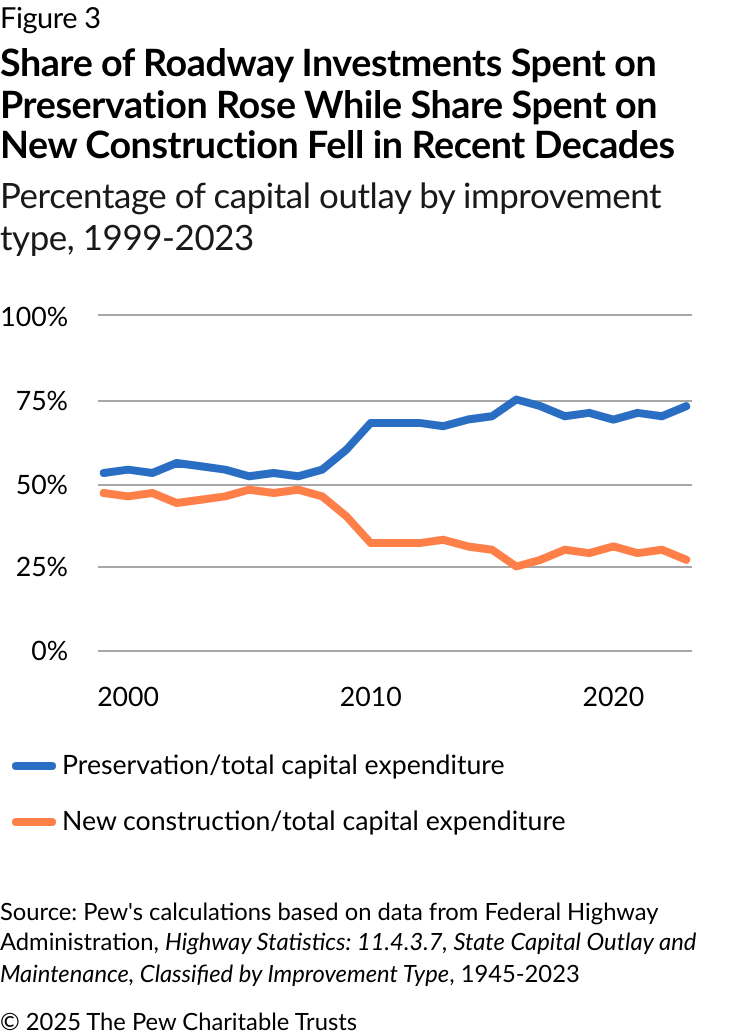
To assess whether state investments in existing roads and bridges are adequate, depreciation is compared with capital spending on system preservation, meaning the rehabilitation, repair, or replacement of roadway assets. FHWA data indicates that from 1999 to 2023, the share of highway investments allocated to new construction decreased from about 47% to 27% while the share directed toward system preservation increased from 53% to 73%, with most of that shift in spending occurring after 2008.5 (See Figure 3.)
Deferred maintenance has grown substantially since 2004
In 2023, “net maintenance” of roadways—the annual difference between the share of net investment used to preserve existing assets (or “capital maintenance”) and annual depreciation—was -$5 billion. Though still a shortfall, this was an improvement over the prior year when net maintenance was -$14 billion; the smaller gap was the result of a roughly $10 billion increase in capital maintenance investments in 2023.
Although nearly two-thirds of every dollar spent on state and local roads and bridges was directed toward maintaining existing assets, governments consistently fell short of addressing annual depreciation. In such cases, when net maintenance is negative, the amount of the shortfall is the “deferred maintenance,” which in turn contributes to an accumulated funding gap called the “deferred maintenance liability.”
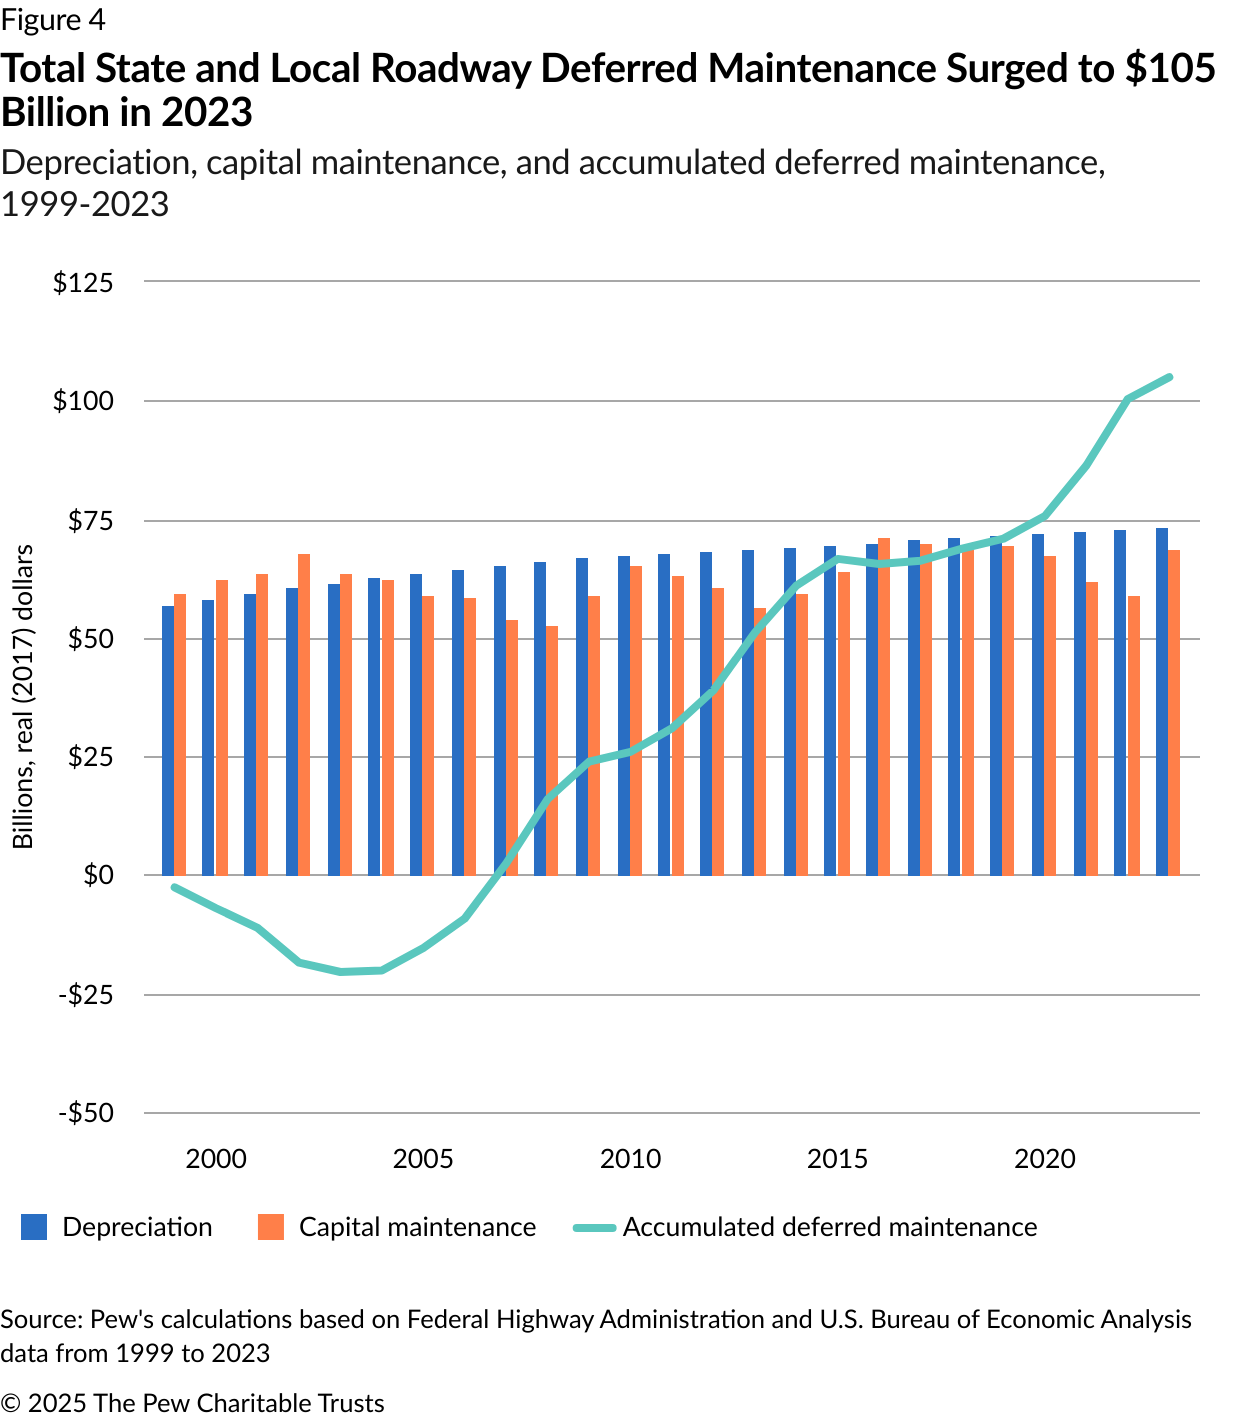
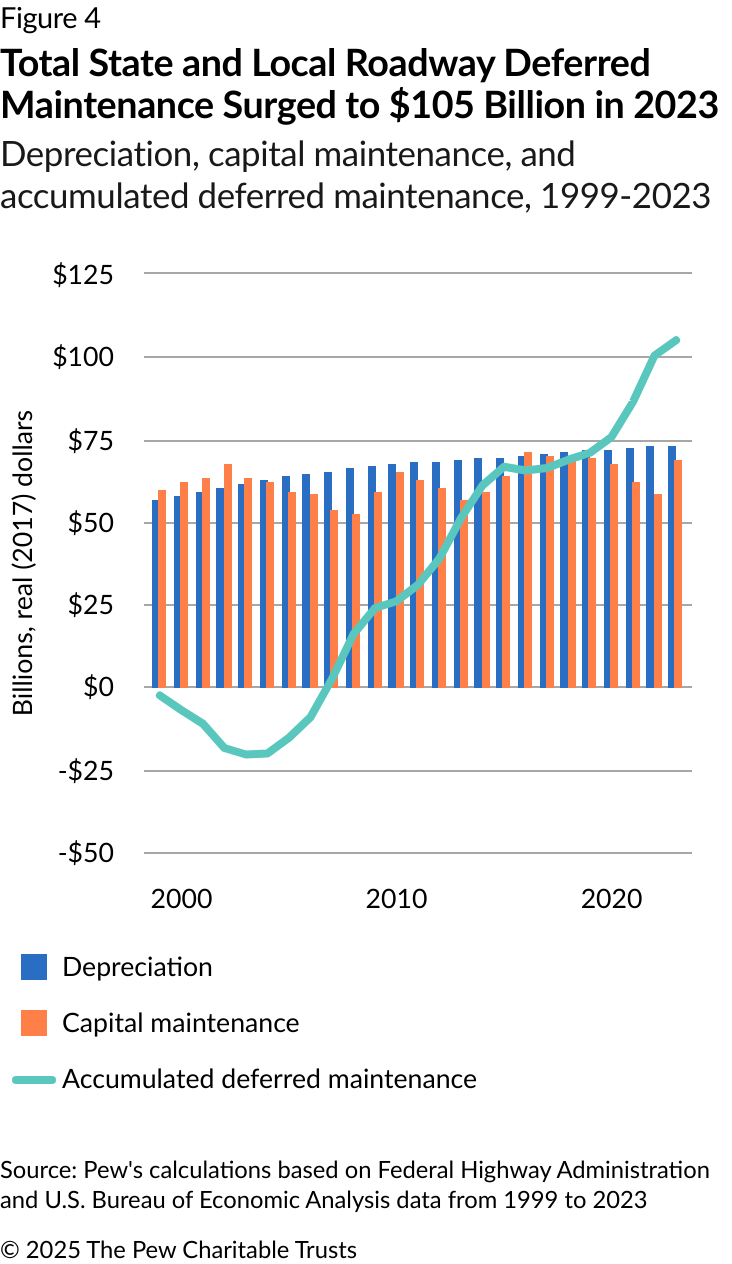
From 1999 to 2023, depreciation increased as the inventory of roadways expanded and more assets were subject to wear and tear. Although capital maintenance fluctuated during this period from a low of $52.5 billion in 2008 to nearly $71 billion in 2016, net maintenance was negative every year from 2004 through 2023 except for 2016, with the largest gap in 2022. Nevertheless, before 2004, net maintenance was positive, with the largest surplus of over $7 billion in 2002. (See Figure 4.)
The accumulated shortfalls in net maintenance since 2004 resulted in a deferred maintenance liability of almost $105 billion as of 2023. And just stopping the problem from growing will not be sufficient to fix the funding gap that state and local governments now face. A $5 billion increase in capital maintenance investments in 2023 would have prevented additional deferred maintenance liabilities from accumulating but would not have made a dent in the existing backlog.
How better data can help
Given the lack of state-reported data on roadway costs, depreciation serves as a useful proxy for the amount of money that states and local governments should be investing in their roads and bridges. However, state-provided estimates of maintenance and preservation needs and of whether current investments are sufficient to meet those needs would offer a more direct view of the sustainability of individual states’ and localities’ infrastructure policies. For example, if states regularly reported on their deferred maintenance liabilities for key infrastructure, including roads and bridges, and the funding levels necessary to address those liabilities, policymakers, stakeholders, and the public could better understand whether their state’s policies are sufficient to preserve roads and bridges over time and what steps are needed to close any deferred maintenance gaps.
Conclusion
The gap between the costs of maintaining state and local roads and bridges and the investments that governments are making has been persistent and widening, particularly since 2004. This growing deferred maintenance liability will put pressure on states and municipalities that do not quickly figure out how to fund needed repairs for their roadway infrastructure. Even with the significant 2023 increase in capital maintenance, state and local investments still are not sufficient to close the ongoing shortfalls, let alone to make progress on previously deferred maintenance.
Moving forward, policymakers and researchers will need more accurate and regular information to understand what is needed to maintain and repair these essential public assets and to guide budgeting and capital planning so that roadways remain in safe, usable condition and future generations do not face an unsustainable financial burden.
Appendix: Methodology
This analysis uses available aggregate 50-state data to show the overall increase in long-term infrastructure liabilities for roadways and how the trend worsened from 1999 to 2023.
The key data sources used in this analysis are the BEA Fixed Asset accounts and the FHWA Highway Statistics Series. The BEA data, collected for the purpose of estimating gross domestic product and other key economic indicators, provides information on state, local, federal, and private infrastructure assets.6 The FHWA data, reported to the agency by states, includes details on capital outlays for preservation and new construction.
Using these data sources, Pew’s analysis followed four steps:
- Identify the value of state and local roadways: The BEA calculates the value of different types of public and private infrastructure, including state- and locally owned roads, bridges, and associated infrastructure, categorized by BEA as “highways and streets.”
- Identify annual decline in the value of state and local roadways: The BEA data provides the dollar value of asset depreciation, which serves as a proxy for the amount of investment needed to maintain the overall condition of state and local highways.
- Estimate capital maintenance spending: The BEA data provides total investment in state and local roadways, and the FHWA data enables estimates of the share of that investment that is directed toward maintaining and preserving existing assets.
- Calculate deferred maintenance: If the amount invested in the preservation of existing assets is less than the annual decline in the condition of those assets, the difference is the deferred maintenance accumulated in that year. Tallying the excesses and shortfalls over this period yields the total accumulated deferred maintenance costs that state and local governments will need to make up to undo the declines in asset conditions.
The analysis covers the period from 1999 to 2023. Before then, FHWA data was not available in the format needed for this analysis.
Identifying the real value of state and local highways, investments, and depreciation is done using BEA’s Fixed Asset account data, which includes nominal asset values, investments, and depreciation for each year, along with quantity indices based on 2017 as the base year. The BEA depreciation numbers used in this calculation could represent an underestimate if the effective useful life of transportation assets changes over time because of different usage patterns, types of infrastructure being built, or external conditions, such as extreme weather and annual climate trends. Alternatively, trends toward better materials, more resilient construction methods, or more effective operational maintenance approaches could reduce annual depreciation if incorporated into the calculation.
To estimate capital maintenance—investments directed toward rehabilitating, repairing, or reconstructing existing assets, rather than building new ones—researchers relied on the State Capital Outlay and Maintenance data table in the FHWA Highway Statistics Database, which classifies investments by improvement type. The capital improvements were grouped into three categories: new construction, system preservation, and system enhancement and operation. New construction includes capacity additions to existing facilities, while system preservation includes reconstruction with no added capacity, minor widening, “3R” maintenance (resurfacing, restoration, and rehabilitation), bridge replacement, and major and minor bridge rehabilitation. System enhancement and operations, which includes safety, traffic control systems, and environmental enhancements, were excluded from the total capital outlay calculations because the relative proportion of new construction to system preservation could not be estimated for that category.
After allocating different improvement types, Pew calculated the share of system preservation in the total capital outlay for each year from 1999 to 2023. Two categories of investment listed in the FHWA data could not be assigned to a category: right of way (ROW) expenditures and engineering outlays. Because ROW does not appear in BEA’s definition of investment, Pew did not include it when calculating the share of highway investments going to capital maintenance. And because engineering outlays for capital maintenance could not be distinguished from those for new construction, those expenditures were allocated proportionately across the other categories.
The FHWA does not have data available for 2011, so the share for that year was estimated as the average of the 2010 and 2012 values. Several states reported no new construction over multiple years, which could indicate a mismatch between how they report their numbers and the FHWA reporting framework. Pew excluded these states from the calculation of “share of new construction” for the years in which no new construction was reported.
Finally, using the data on depreciation and capital maintenance, Pew calculated the annual surplus or deficit. The accumulated shortfall of $105 billion over the study period represents the total state and local deferred maintenance liability. This estimate covers the funding gap for capital maintenance and preservation but excludes routine maintenance that does not extend the expected service life or condition of state and local roadways.
Endnotes
- Jerry Zhirong Zhao, Camila Fonseca-Sarmiento, and Jie Tan, "America's Trillion-Dollar Repair Bill: Capital Budgeting and Disclosure of State Infrastructure Needs," The Volcker Alliance, 2019, https://www.volckeralliance.org/resources/americas-trillion-dollar-repair-bill.
- Pew used two key data sources for this analysis: “National Data, Fixed Assets Accounts Tables,” U.S. Bureau of Economic Analysis, https://apps.bea.gov/iTable/?ReqID=10&step=2&_gl=1*wszg2k*_ga*Mjk5NDc2MDg2LjE3MzE1OTk2OTI.*_ga_J4698JNNFT*MTczMTc0MjkyNy41LjAuMTczMTc0MjkyNy42MC4wLjA. “Highway Statistics: Table 11.4.3.7, State Capital Outlay and Maintenance, Classified by Improvement Type,” Federal Highway Administration, https://www.fhwa.dot.gov/policyinformation/statistics/2022/. The BEA tracks state and local fixed investment in “highways and streets,” which includes roads, bridges, and related structures and assets. For more detail, see: Robert Kornfeld and Barbara M. Fraumeni, “How Should We Measure Infrastructure? The Case of Highways and Streets,” U.S. Bureau of Economic Analysis, 2022, https://www.bea.gov/index.php/research/papers/2022/how-should-we-measure-infrastructure-case-highways-and-streets.
- Because of data limitations, Pew relied on depreciation as a proxy for needed investments in preservation and maintenance and on state data reported to the FHWA to estimate how BEA-reported investments are used for state and local roads and bridges.
- A dollar spent on highways in 2023 will buy less than a dollar spent in 1999. The BEA provides a “chain-type quantity index” that allows users to adjust for price increase and construction cost changes as well as for substitutions in the inputs used for infrastructure construction. Following the BEA’s methodology, Pew used the chained quantity indices for highway stocks, investments, and depreciation to adjust the nominal dollar values to 2017-dollar equivalents. This shows the extent to which state and local investments in roadways failed to keep pace with increases in construction costs over the study period. See “National Data, Fixed Assets Accounts Tables,” U.S. Bureau of Economic Analysis, and Robert Kornfeld and Barbara M. Fraumeni, “How Should We Measure Infrastructure? The Case of Highways and Streets.”
- The Federal Highway Administration’s data on highway expenditures includes interstate, arterial, and collector roads but excludes roads that only meet local needs.
- For more information on using BEA Fixed Asset accounts to measure infrastructure, see: Jennifer Bennett et al., “Measuring Infrastructure in the Bureau of Economic Analysis National Economic Accounts,” U.S. Bureau of Economic Analysis, 2020, https://www.bea.gov/research/papers/2020/measuring-infrastructure-bureau-economic-analysis-national-economic-accounts.

State Infrastructure Financing
Collected resources on federal funding opportunities, metrics, and financing tools

Electric Vehicles Can Affect State Transportation Budgets

Planning Can Curb Costs, Climate Stress on Infrastructure
ADDITIONAL RESOURCES

Article


