Retirement Needs and Preferences of Younger Public Workers
Pew survey shows priorities center on savings portability, benefit guarantees

© Getty Images
Overview
After the Great Recession took a toll on retirement savings for millions of Americans in the late 2000s, many baby boomers working in the public sector postponed their retirements. Today, however, the retirement rate among these workers is rising, with many state and local governments reporting increases in recent years.
Since baby boomers—born from 1946 through 1964—make up a large share of the public workforce, especially in senior management, this has major implications for state and local governments, which employ more than 19.4 million people nationwide.1 As more veteran workers retire, public employers increasingly will have to recruit and retain their next generation of employees, whose priorities and concerns may be different from those who came before them.
Along with these demographic changes, many public retirement systems face funding challenges that have led to modifications of retirement benefits to improve fiscal sustainability. Factoring in the needs and preferences of the growing number of younger workers will help ensure that states and municipalities have the talented workforces they need. And because most reforms apply primarily to new employees, these changes can have a pronounced effect on younger people as they enter the public sector.
To deepen understanding of these early and midcareer state and local government workers, The Pew Charitable Trusts conducted a national survey in 2016 that included 436 public employees under 40 (“younger workers”), most of whom are millennials, as well as more than 500 age 40 and over (“older workers”). The sample allowed for an examination of attitudes among two subgroups of younger workers: those under 30 and those 30 to 39. The national survey, preceded by a series of focus groups, followed up on a similar Pew survey done in 2013.2
The survey and focus groups were designed to examine younger workers’ knowledge of current benefits, learn about their motivations for working in the public sector, assess confidence in their ability to plan a secure retirement, and explore their future needs and retirement plan preferences. Among the top findings:
- Younger workers are generally confused about many aspects of their plans, and more than a third of those under 30 could not name the type of retirement plan their employer offers.
- Younger workers’ top priority for their retirement plans is the ability to take savings with them when changing jobs, followed closely by having a fixed, lifetime monthly benefit at retirement.
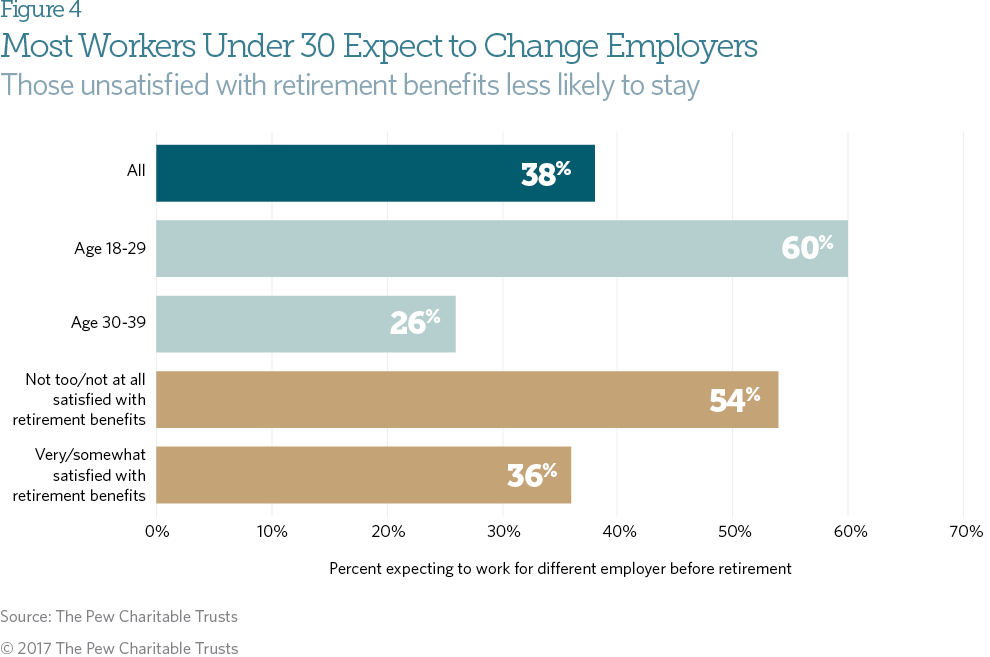
- 60 percent of workers under 30 do not expect to work for their current employer until retirement, compared with 26 percent of workers 30 to 39.
- Nearly 80 percent of respondents are very or somewhat confident that they will receive the full retirement benefit promised by their employers.
- The results suggest that younger workers choose government jobs more for the day-to-day advantages, such as stable employment and work-life balance, than for retirement benefits.
Key Terms and Definitions
Plan types
- Defined benefit: A plan in which the employer promises a specific amount of monthly retirement income based on a formula that typically takes into account the employee’s salary, years of service, and age.
- Defined contribution: A plan that provides employees with an individual retirement account that grows through investment of accumulated employer and employee contributions. Annual returns are generally based on investment performance and are not typically guaranteed. These plans can provide workers with access to annuities upon retirement.
- Hybrid: A plan that combines a defined benefit based on the employee’s final average salary with a separate defined contribution savings account.
Generations
- Baby boomers: Born from 1946 through 1964.
- Generation Xers: Born from 1965 through 1980.
- Millennials: Born after 1980.
A profile of younger public workers
Millennials differ in many ways from baby boomers and even members of the generation that immediately precedes them, Generation X. Born after 1980, millennials are more racially and ethnically diverse, have higher education levels, and are more likely to have delayed traditional markers of adulthood, such as marriage or parenthood, than previous generations at similar ages.3
In addition, millennials typically have accumulated less wealth than baby boomers had at the same point in their lives.4 They entered the workforce at a time when both private and public sector employers were changing how they helped workers prepare for retirement. Assumptions about how long people would stay in specific jobs were evolving as well.
Most private employers had already shifted from offering defined benefit pensions to defined contribution savings accounts such as 401(k)s. In the public sector, many governments had reduced retirement benefits for new employees. In addition, many of these younger workers will change jobs more frequently than their predecessors have.
Wide range of jobs in majority-female workforce
Our survey found public workers under age 40 tend to be mostly female (60 percent), college educated (63 percent), and married (52 percent). Fifty-seven percent work for municipal or local governments, while the remainder are employed by states. Occupations vary widely, including public safety officers, social workers,
and engineers, although about 1 in 5 is a teacher. More than half (53 percent) reported having had a full-time job in the private sector. In addition, 56 percent started working for their current employer in 2011 or later. Nearly 9 in 10 (88 percent) are employed full time.
Majority carry debt and have limited savings
More than half of younger public workers (57 percent) reported household incomes of $75,000 or more. One- third said their household income is between $35,000 and $74,999, while 10 percent said it is less than $35,000.
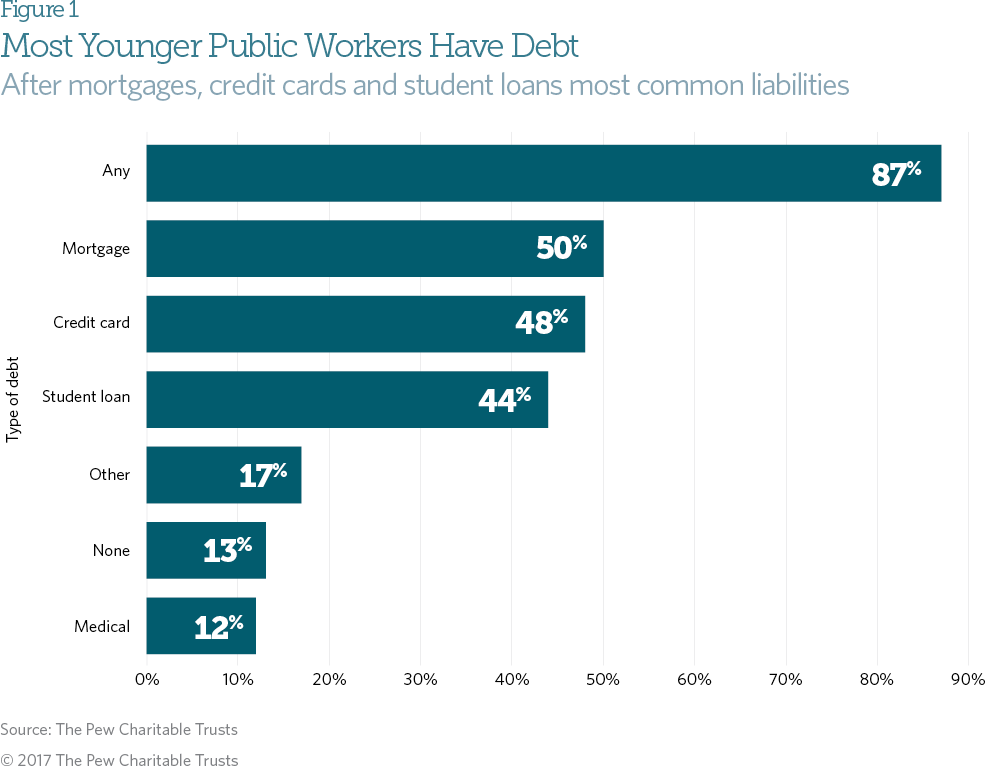
Nearly 9 in 10 (87 percent) carry some kind of debt, with credit cards (48 percent) and student loans (44 percent) the most common nonmortgage liabilities. Excluding monthly mortgage payments, 64 percent of younger workers with some kind of debt owe less than $25,000. Of those with student debt, 46 percent hold less than $25,000 in loans, and roughly 7 in 10 have less than $50,000.
Still, 10 percent of younger workers with student loans have a balance of $100,000 or higher. These largely millennial workers with student loans tend to have lower savings. A majority of those with less than $10,000 in savings and investments have student loans (54 percent), while about a third of those with savings between
$10,000 and $25,000 carry student debt.
Excluding the value of a primary residence or any defined benefit pension plan assets, about two-thirds of younger workers—along with their spouse or partner—reported less than $25,000 in savings and investments. Among those ages 30 to 39, 56 percent have less than $25,000 saved. Not surprisingly, workers in their 30s are more likely than those in their 20s to have higher savings. These findings echo those in a recent study by the Employee Benefit Research Institute of primarily private sector workers in similar age groups.5
Most younger workers satisfied with current financial situation
A majority of the younger workers signaled confidence about their immediate and long-term economic standing; 72 percent indicated they were very or somewhat satisfied with their current financial situation, and 69 percent reported feeling very or somewhat financially secure. Workers in their 30s generally have higher levels of financial security and satisfaction than those in their 20s. Those who said they were very or somewhat confident in their ability to retire comfortably were also more likely to say they feel financially secure and satisfied.
Almost all of those surveyed (90 percent) participate in their employer retirement plan, and most of those who do not are employed part time. About half (46 percent) said their employer offers a defined benefit plan, 24 percent had a defined contribution plan, and 9 percent were in a hybrid, cash balance, or some other plan. About a fifth did not know what type of retirement plan their employer provides.
Social Security does not cover all government workers. About two-thirds (67 percent) said they are enrolled in Social Security in their current job, and of those who are not, most (72 percent) said they do not want to
participate in the system. Some 62 percent reported being offered a voluntary, supplemental savings plan, similar to a 401(k), in addition to the primary employer-sponsored retirement plan. Similar to other questions about participation in retirement programs, a substantial proportion (25 percent) of younger workers were unsure if their employer offers a supplemental plan. For those who said they have access to a supplemental plan, about half (54 percent) said they contribute.
Younger public workers’ knowledge of their retirement plans limited
Because of the complexity of retirement planning, retirement systems that use education and engagement programs effectively may be able to better help workers attain financial security. Many younger workers have limited knowledge about their retirement plans; 24 percent of millennials and 34 percent of workers under 30 said they do not know what type of retirement program their employer offers.
For all workers under 40, nearly 6 in 10 (57 percent) said they know what happens to their accrued benefits if they leave their employer before retirement, but only 43 percent of workers under 30 knew. Of those in the full group who could not identify their retirement plan type, 71 percent could not say what happens to their benefits if they change jobs or leave before retirement. Less than half of workers under 40 said they understood their retirement plans well enough to be able to estimate how much they would get at retirement. Those in their 20s were less likely to be able to estimate their benefit than those 30 to 39 (28 percent vs. 57 percent, respectively).
Of the 79 percent who could identify their retirement plans, most said they understand the basic contours of their plans, but even they had limited knowledge about specifics. Among those with a defined benefit plan— as a stand-alone plan, or in conjunction with a 401(k)-style individual savings account as part of a hybrid plan— respondents were most likely to rate themselves as “very knowledgeable” or “moderately knowledgeable” on employee contribution rates (53 percent), vesting periods (50 percent), or age of retirement eligibility (62 percent). Workers were less likely to say they were very or moderately knowledgeable about the formula used to determine benefits (39 percent), cost-of-living adjustments (29 percent), or how investments are managed (20 percent).
It is kind of embarrassing how little I know. I have never spent the time to try to figure it out.public worker in Portland, Oregon (age 21-29)
Younger workers with defined contribution plans were most knowledgeable about employee contribution rates (55 percent very or moderately knowledgeable) and employer match rates (59 percent very or moderately knowledgeable). They were less knowledgeable about vesting periods (46 percent very or moderately knowledgeable) and investment options (40 percent very or moderately knowledgeable).
Some focus group participants said they had not spent time learning about plan details and expressed similar levels of confusion about their plan type and how it worked.
My mom works for a retirement [service]; so she is always on me about knowing stuff about my retirement. I have heard about it, but again, to be honest, I don’t know anything about it.teacher in Lansing, Michigan (age 21-29)

Older workers typically expressed greater knowledge about their retirement plans than workers under 40 did. Of older workers in a defined benefit plan, 62 percent said they are very or moderately knowledgeable about employee contribution rates. In comparison to their younger counterparts, they also reported greater knowledge of vesting periods (72 percent), age of retirement eligibility (81 percent), benefit formulas (52 percent), cost-of- living adjustments (47 percent), and how investments are managed (36 percent).
Views of younger workers mixed on employer education, outreach efforts
The younger workers surveyed displayed mixed opinions of their employer’s education and outreach efforts about their retirement plans. Around 45 percent said their employer’s plan is doing a fair or poor job communicating about benefits. The same percentage of these workers rated the information they receive on retirement
planning as fair or poor. Similar proportions of younger workers gave fair or poor ratings to the effectiveness of their retirement plan in ensuring they have enough money for retirement (42 percent) and providing enough information to make informed choices about retirement options (46 percent).
The most common resource younger workers use to learn about their retirement benefits is their plan statement (54 percent). Forty-four percent have visited the retirement plan website in the last three years, with the
college-educated more likely to do so (50 percent) than those without a college degree (32 percent). Less than 40 percent said they used the employee handbook, while only 19 percent had attended seminars about the retirement plan put on by their employer.
When it comes to learning more about their retirement plans, younger workers prefer information from official sources. Respondents said they are more likely to trust information from the benefits website (56 percent) or human resources representatives (59 percent) than family or friends (37 percent), colleagues (32 percent), or union representatives (26 percent).
Because decisions made early in a career can have a substantial impact on future financial security, policymakers may want to consider ways to increase engagement earlier to help employees make informed choices.
I know they contribute the 6 percent, I know that once a year I get that statement from them saying what’s been contributed and if I retire what I get. But outside that I don’t think like I know anything else about it.public worker in Portland, Oregon (age 30-39)
Most younger workers confident of receiving promised benefits
The largely millennial employees appear to be confident that their employers can deliver promised benefits. About 79 percent of younger workers said they are very or somewhat confident that they will receive the full retirement benefits promised by their current employer. Nearly half said they would prefer that their employer manage their retirement investments rather than having more personal control over where money is invested.
Confidence in Social Security is far lower: Only 31 percent of workers under 40 said they are very or somewhat confident that the system will be able to pay full benefits throughout their retirement. This belief varies significantly by age, with 50 percent of workers 40 and over very or somewhat confident. Surveys of the nation’s workforce—in both the public and private sectors—show similar levels of concern about future benefits. The Employee Benefit Research Institute’s 2016 Retirement Confidence Survey found that 39 percent of public and private sector workers were very or somewhat confident that the Social Security system would continue to provide benefits at least equal in value to the benefits retirees receive today.6
These results also are similar to those from Pew’s 2015 survey of state workers in Michigan. In that study, only 27 percent of respondents said they were very or somewhat confident that Social Security would be able to provide full benefits; 71 percent said they were either not too or not at all confident in the program. Moreover, older workers reported higher confidence in the federal program than younger ones did.7
Job security and flexibility key recruitment and retention factors
To help researchers determine what is important in recruiting and retaining public employees, respondents were asked to rate the influence of various job factors that often affect whether people choose to work for and then remain with an employer.
Workers under 40 gave greater importance to immediate benefits than job factors that take time to materialize, such as opportunities for advancement and retirement benefits. They rated job security (36 percent), work in specific field/profession (35 percent), and work-life balance (34 percent) as “essential” in decisions to work for the government.
In contrast, only 25 percent rated retirement benefits as an essential reason, although workers in their 30s rated it higher (31 percent) than those in their 20s (16 percent). Among those who rated more than one factor as essential, respondents ranked work in specific field/profession as most important (21 percent), followed by salary (18 percent), job security (15 percent), and work-life balance (14 percent).
The results suggest that younger workers choose jobs in government more for the day-to-day benefits, including the peace of mind that comes from having stable employment and the ability to balance work and family demands, than factors that improve long-term well-being, such as retirement benefits or opportunities for advancement.
I’m young and I’m not really thinking about retirement. I’m not much of a planner; I live in the moment, so I don’t really care about health, dental, or retirement yet. I’m only 27, so up until a year ago I’ve been under my parents. All I’m thinking about is I want to love what I do.public worker in Baltimore (age 21-29)
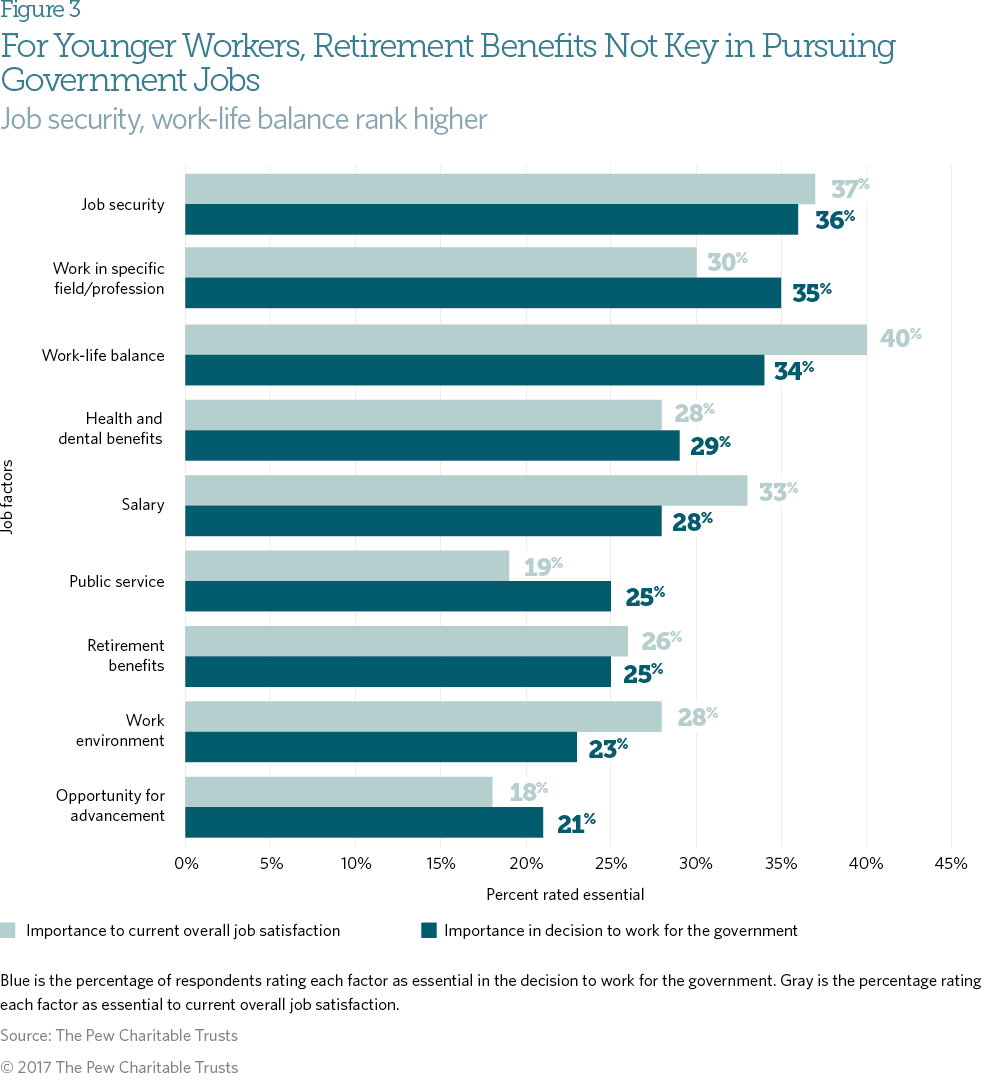
Among the top factors for current job satisfaction, younger workers most often rated job security (37 percent) and work-life balance (40 percent) as essential, with salary the next most important factor (33 percent). Public service (19 percent) and opportunity for advancement (18 percent) were least likely to be seen as essential factors in overall job satisfaction. Retirement benefits ranked near the lower end of the list.
Workers in their 20s and 30s differ on employment expectations
The median tenure for a state worker is 5.8 years.8 Although 62 percent of younger workers said they expect to work with their current employer until retirement, most under 30 expect to change jobs. Some 74 percent of those 30 to 39 expect to work for the same employer until retirement, while 60 percent under 30 said it is more likely they will work for a different employer.
About two-thirds of those under 40 who said they expected to change jobs said they think it is more likely they will take another position in government than in the private sector. Only 35 percent of these younger workers expect to leave government service for the private sector. A majority (59 percent) of those who expect to take another government job said they think it will most likely be in the same retirement system.
The vast majority of those who think it is likely they will eventually work for a different employer do not expect to stay much longer with their current organization. Fifty-seven percent expect to work less than five years with their current employer; more than 90 percent said they think their tenure will be less than 10 years.
Those planning to leave indicated that they were less content with their earnings and more likely to be nervous about the future. Fifty-two percent of younger workers not satisfied with their salary expect to switch employers, compared with 32 percent of those satisfied. Employees under 40 not confident that they will have money to live comfortably throughout retirement are also more likely to plan to change jobs (60 percent) than those who are confident (29 percent).
In addition, younger workers who reported being not too or not at all satisfied with their retirement benefits are more likely to expect to work for a different employer (54 percent) than those who said they are very or somewhat satisfied (36 percent). The large difference suggests the importance of this benefit as a retention tool, even if many younger workers have higher priorities early in their careers.
Retirement planning not a priority for most younger workers
Planning for retirement is not a priority for most millennials. Only 33 percent of younger workers said such planning is a “pretty big priority.” Fewer than 1 in 10 called it a “top priority.” Age plays a role here.
Public workers in their 30s were twice as likely (50 percent) as those in their 20s (25 percent) to say retirement planning is a top or pretty big priority. Yet despite placing a low priority on retirement planning, many younger workers expect to retire early; 35 percent said they expect to retire before 60, while 58 percent expect to retire before 65. Seventy-one percent of younger workers are very or somewhat confident that they will have enough money to live comfortably in retirement.
About a third of those in defined contribution plans (34 percent) said they need a higher savings rate than what they actually put away in the previous year. Nearly 2 in 10 (17 percent) said they did not know how much they saved last year for retirement.
Still, many workers are taking advantage of opportunities to save. Nearly 6 in 10 (57 percent) in defined contribution plans said they saved 5 percent or more of household income, while 44 percent saved 10 percent or more.
Many younger workers acknowledged they are saving less than they will need for retirement, in large part because they are focused more on short-term goals, such as a home down payment (51 percent), family obligations (45 percent), current level of debt (45 percent), other important spending priorities (45 percent), and cost of living (44 percent). Few said that a lack of knowledge (16 percent) or being too busy to adjust the savings rate (12 percent) are major reasons for saving less than needed.
Top retirement priorities are portability and lifetime benefit
Despite younger workers’ limited knowledge of their retirement benefits, they reported being generally satisfied with the retirement benefits provided by their employer. Some 88 percent said they are very or somewhat satisfied with these benefits—with 26 percent saying they are very satisfied. That total is more than the 71 percent who said they are very or somewhat satisfied with their salaries. Still, the youngest group demonstrated the lowest satisfaction; only 17 percent of workers under 30 reported being very satisfied with their plan, compared with 31 percent for those in their 30s. Even workers who were unable to identify their retirement plan type reported high levels of satisfaction (77 percent somewhat or very satisfied), suggesting general confusion about retirement benefit specifics.
Workers under 40 also are more than three times as likely to say retirement benefits are better in the public sector (51 percent) than in the private sector (14 percent). And they are almost equally likely to say salaries are better in the private sector (59 percent) than public sector (20 percent).
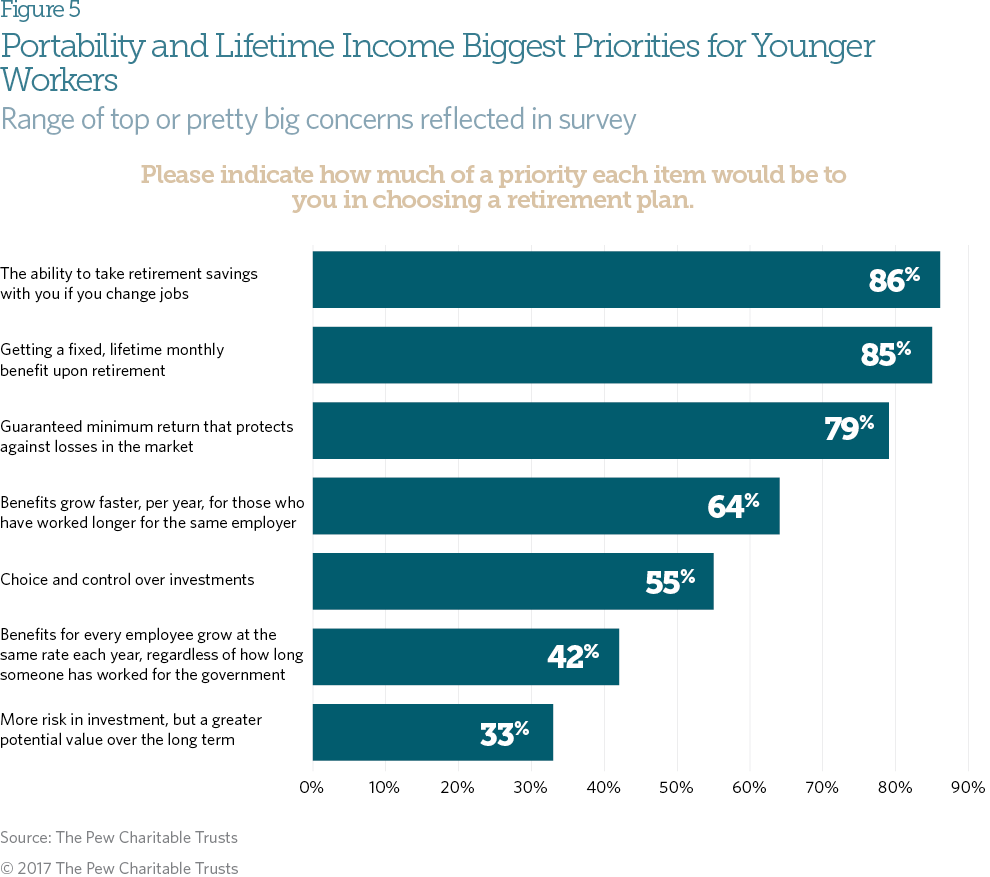
Younger workers’ top priority for their retirement plan was portability. Eighty-six percent ranked the ability to take retirement savings with them when changing jobs as a top or pretty big priority. Receiving a guaranteed, lifetime income was the second most important; 85 percent said getting a fixed, lifetime monthly benefit upon retirement was a top or pretty big priority.
Workers under 40 in defined contribution plans were especially likely to list savings portability—a key attribute of that approach—as a top priority (63 percent), while people in defined benefit plans were most likely to say getting a lifetime monthly benefit—a key characteristic of traditional pensions—was a top priority (52 percent). A solid majority of participants in any kind of plan highly rated receiving a guaranteed minimum return that protects against losses in the market (32 percent top priority, 47 percent a pretty big priority).
By contrast, only a third of younger workers said that more risk in investment in exchange for potentially higher returns was a top or pretty big priority in choosing a retirement plan. When asked how they would prefer to receive their retirement benefits, almost all said they would want them either as a series of guaranteed lifetime payments (48 percent) or partially as a lump sum with the remainder as a series of guaranteed lifetime payments (42 percent). Only 10 percent said they would prefer to receive their retirement benefit entirely as a lump sum.
Many younger workers prefer the type of plan they are in over other options, whether they have a defined benefit, defined contribution, or hybrid plan. Forty-six percent of those in defined benefit plans said they prefer that type of plan most, while 54 percent of people in defined contribution plans said they like that type of plan. Similarly, 51 percent of hybrid plan participants preferred a hybrid pension plan. This may reflect the finding that many younger workers have limited knowledge of their retirement benefits.
Conclusion
The survey results indicate that younger workers have a limited knowledge of retirement benefits compared with older workers, with a significant portion unable to name their retirement plan type. Job security, work-life balance, and the ability to work in their chosen field appear to be more important than retirement programs when younger workers are deciding whether to work for state or local governments or the private sector. Nevertheless, employer-sponsored retirement plans are seen as a valuable benefit.
The findings also suggest that younger workers put a high priority on portable savings and access to lifetime retirement income. As state and local governments consider potential changes to their retirement plans, lawmakers should keep in mind younger workers’ priorities and find ways to provide additional education about retirement benefits.
Endnotes
- Center for State and Local Government Excellence, “The Great Recession and the State and Local Government Workforce” (January 2010), http://slge.org/wp-content/uploads/2011/12/Great-recession-and-govt-workforce_10-150.pdf; Mike Maciag, “The ‘Silver Tsunami’ Has Arrived in Government,” Governing, May 31, 2016, http://www.governing.com/topics/mgmt/gov-government-retirement-survey-center-state-local.html; U.S. Bureau of Labor Statistics, “Current Employment Statistics: Establishment Data,” Table B-1a, http://www.bls.gov/web/empsit/ceseeb1a.htm.
- The Pew Charitable Trusts, “Preparing for Retirement: More Findings From a Survey of Public Workers on Retirement Benefits” (October 2015), http://www.pewtrusts.org/~/media/assets/2015/10/statelocalemployeesurvey-report.pdf.
- Paul Taylor and Scott Keeter, “Millennials: A Portrait of Generation Next,” Pew Research Center (2010), http://www.pewsocialtrends. org/files/2010/10/millennials-confident-connected-open-to-change.pdf; Carlo de Bassa Scheresberg, Annamaria Lusardi, and Paul J. Yakoboski, “College-Educated Millennials: An Overview of Their Personal Finances,” TIAA-CREF Institute and the Global Financial Literacy Excellence Center (2014), https://www.tiaainstitute.org/sites/default/files/presentations/2017-02/gflec_overview_millennials_ personal_finances_feb2014.pdf; Erika Poethig, Pamela Blumenthal, and Rolf Pendall, “Housing Policy and Demographic Change,” in “HUD at 50: Creating Pathways to Opportunity,” Department of Housing and Urban Development (2015), 219–50, https://www.huduser.gov/hud50th/HUDat50Book.pdf.
- Eugene Steuerle et al., “Lost Generations? Wealth Building Among Young Americans,” Urban Institute (2013), http://www.urban.org/ sites/default/files/alfresco/publication-pdfs/412766-Lost-Generations-Wealth-Building-among-Young-Americans.PDF.
- The Employee Benefit Research Institute’s 2016 Retirement Confidence Survey (RCS) compared savings and investments (not including the value of any primary residence or defined benefit plan assets) for workers in the following age groups: 25 to 34 and 35 to 44. Employee Benefit Research Institute and Greenwald & Associates, “2016 RCS Fact Sheet #4: Age Comparisons Among Workers” (2016) https://www.ebri.org/files/RCS_16.FS-4_Age.pdf.
- Employee Benefit Research Institute, “2016 RCS Fact Sheet #6: Attitudes About Current Social Security and Medicare Benefits Levels” (2016), https://www.ebri.org/pdf/surveys/rcs/2016/RCS_16.FS-6_SS-Med.pdf.
- The Pew Charitable Trusts, “Public Workers Preparing for Retirement: Top Findings From a Survey of Michigan’s State Employees” (May 2016), http://www.pewtrusts.org/~/media/assets/2016/05/ michiganstateemployeesretirementbriefdraft.pdf.
- U.S. Bureau of Labor Statistics, “Employee Tenure Summary,” news release, Sept. 22, 2016, http://www.bls.gov/news.release/tenure. nr0.htm.
Acknowledgment
This work is funded in part by The Pew Charitable Trusts with additional support from the Laura and John Arnold Foundation.


