Philadelphia 2024
The state of the city

Editor’s note: The Figure 12 note was updated on April 16, 2024, to reflect that the commuting data is the most recent available.
Overview
In many ways, 2024 is a year of significant transition for Philadelphia. The city has a new mayor in Cherelle Parker, plenty of fresh perspectives in City Council, and leadership changes at some of the largest and most influential institutions, including the University of Pennsylvania and Temple University. The trends that have given the city a sense of dynamism in recent years—including its increasingly well-educated and diverse population— show no signs of weakening. But Philadelphia’s persistent problems remain as well, threatening to undermine any sense of progress. Those problems include the high crime rate, the staggering number of drug overdose deaths, and the fact that over 1 in 5 residents are still living below the poverty line.
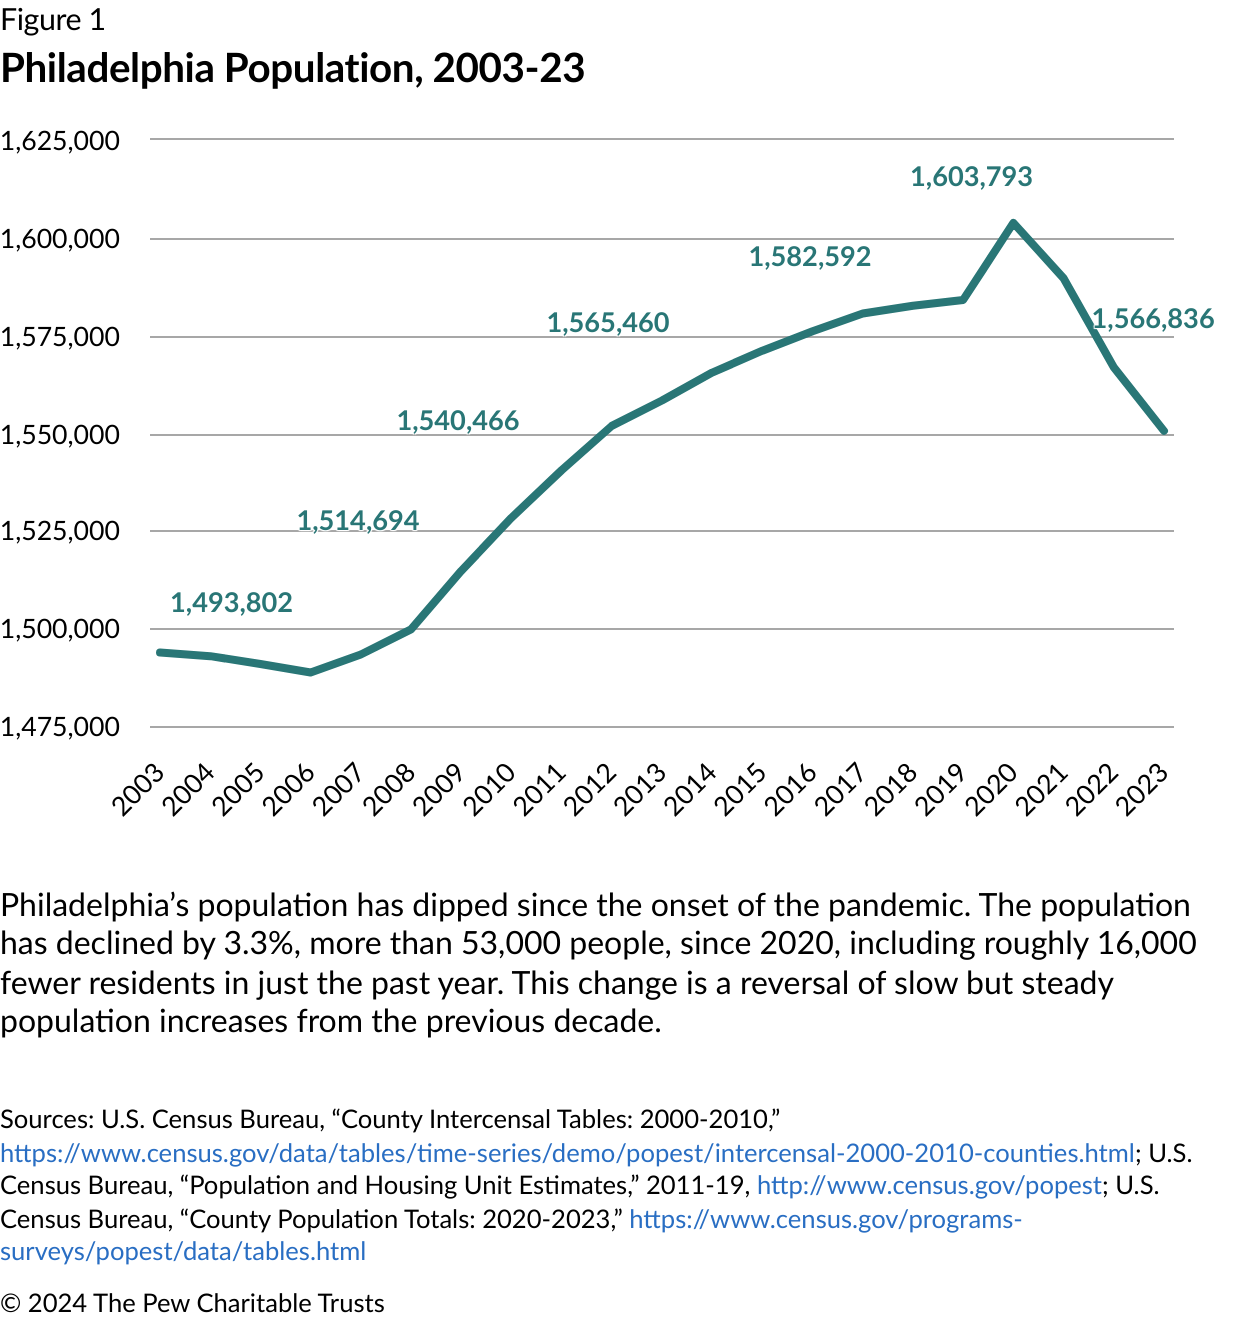
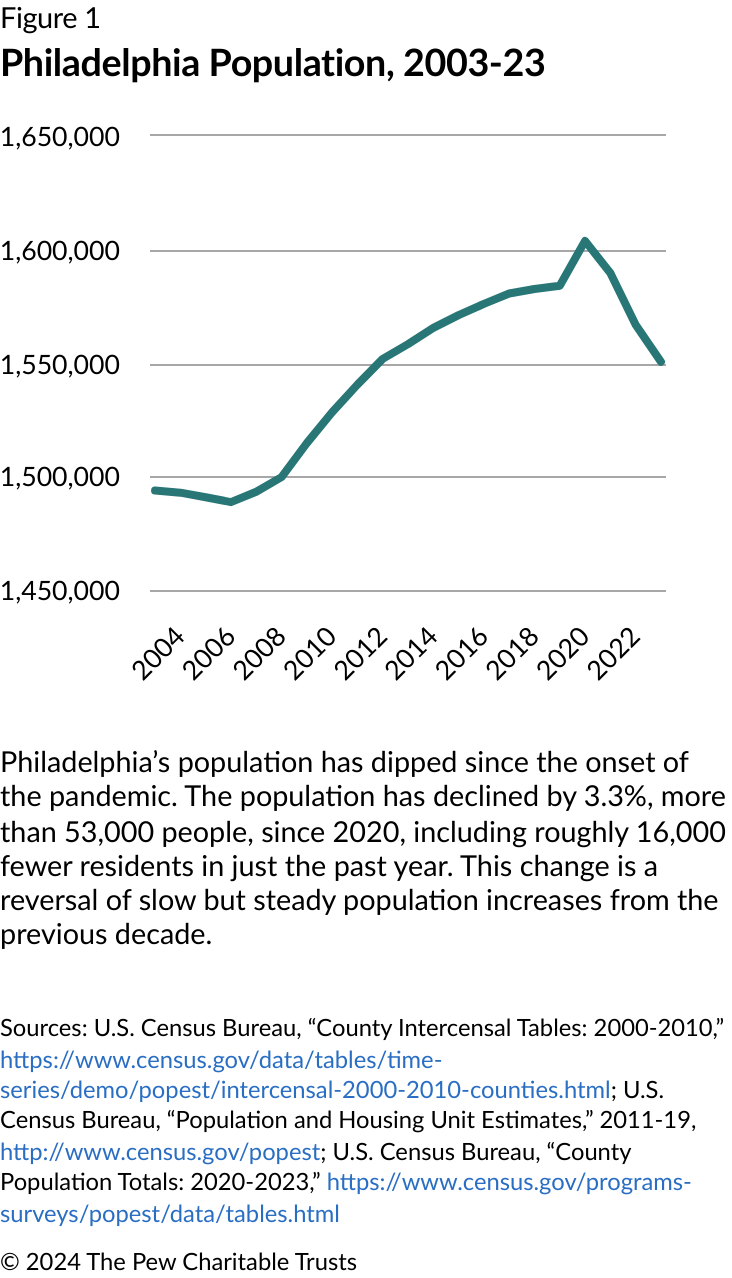
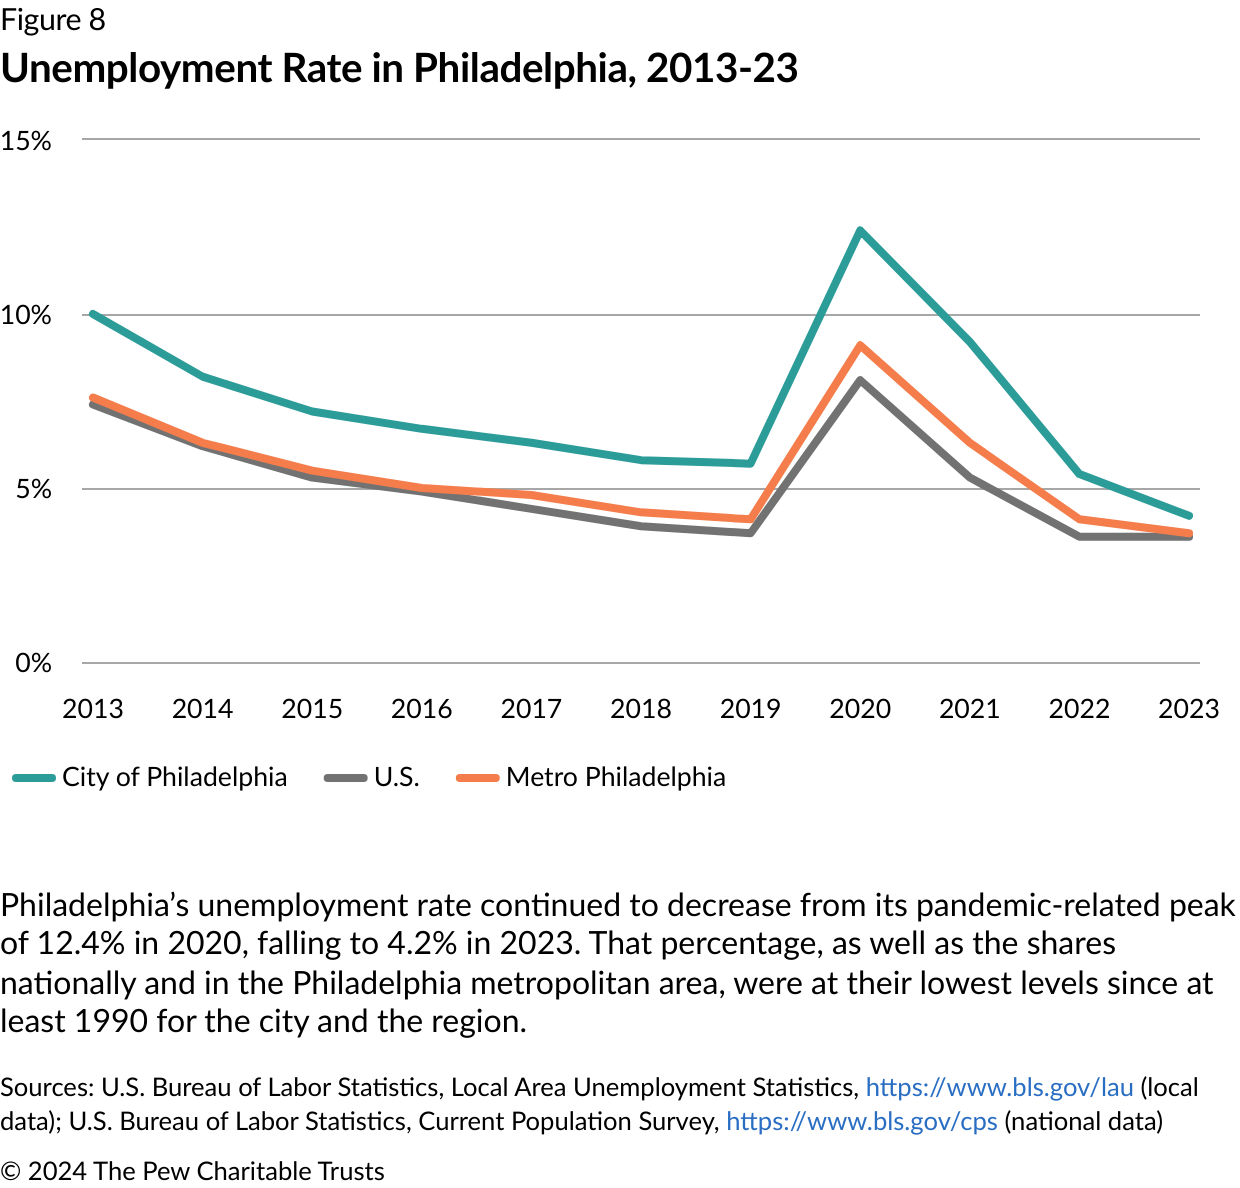
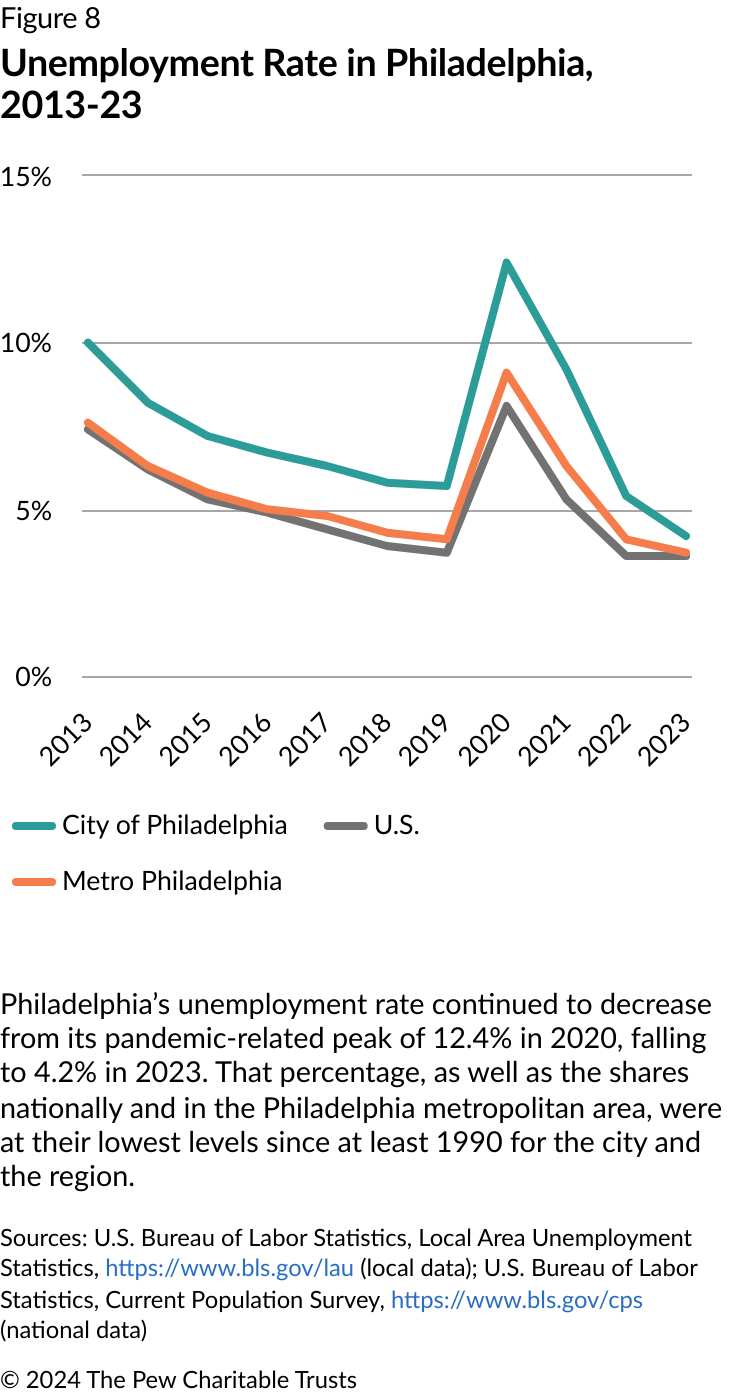
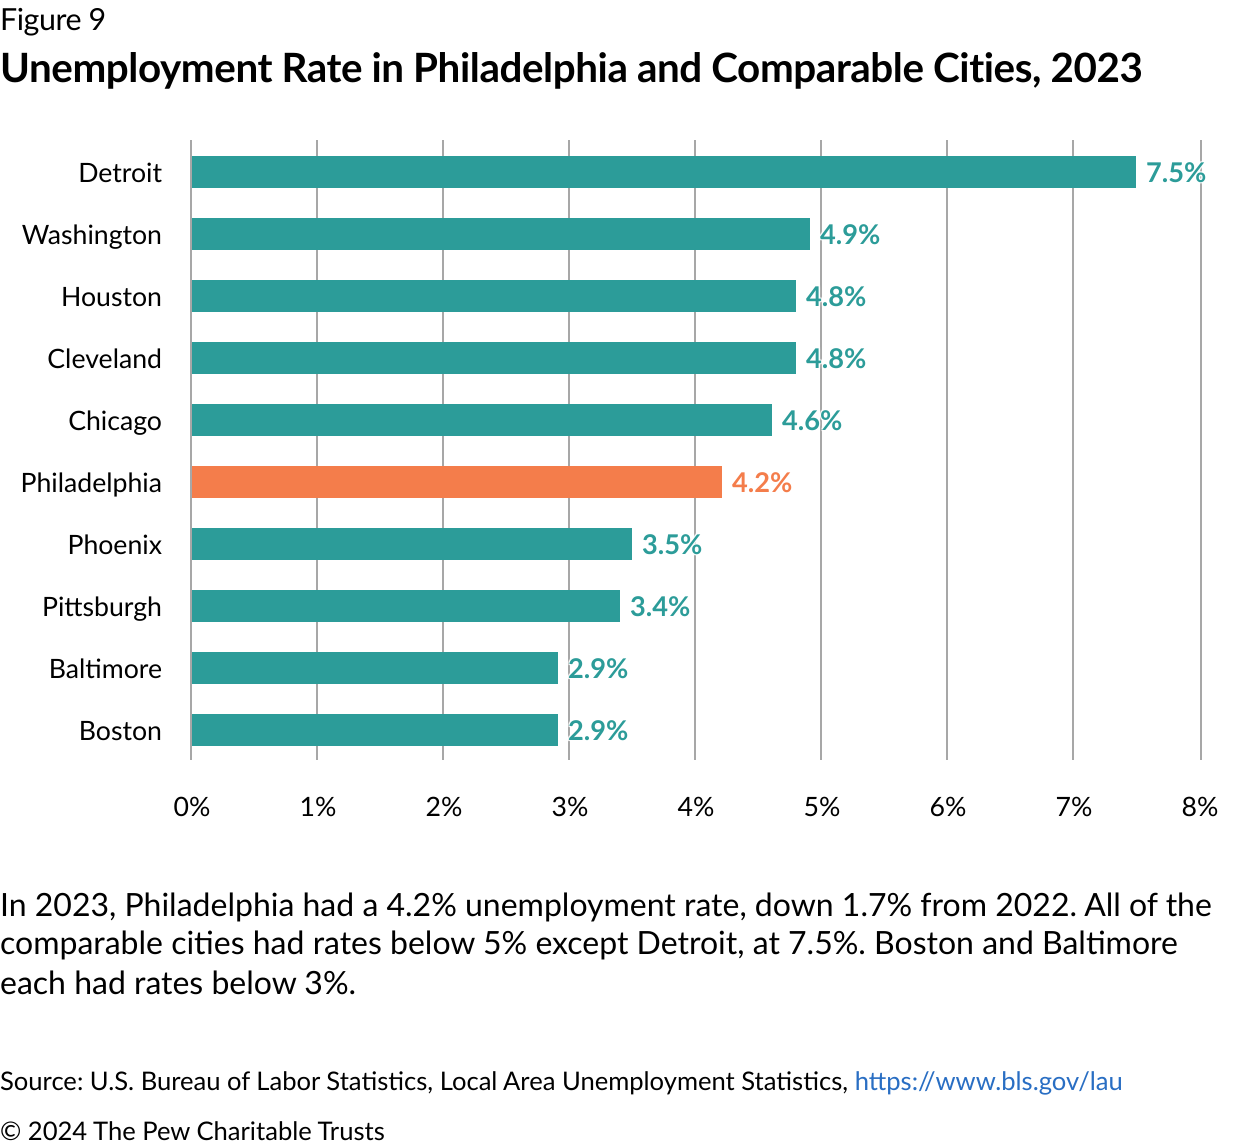
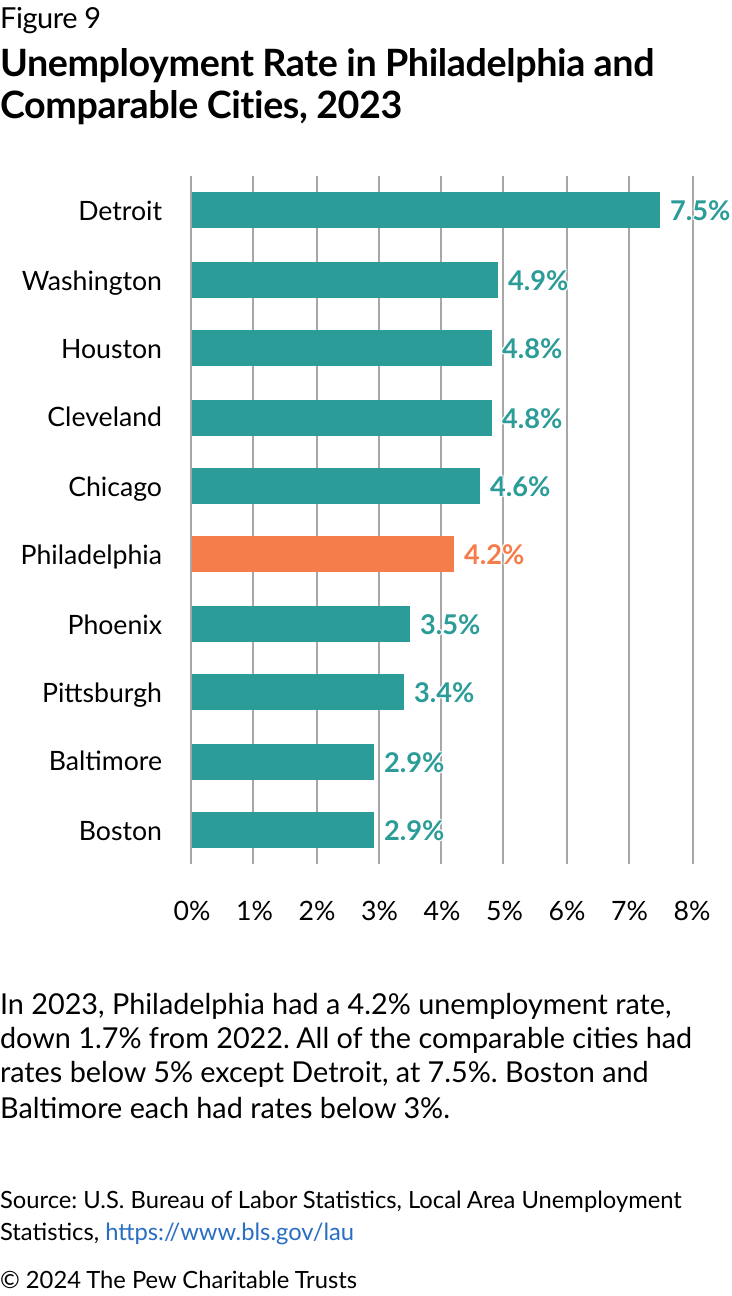
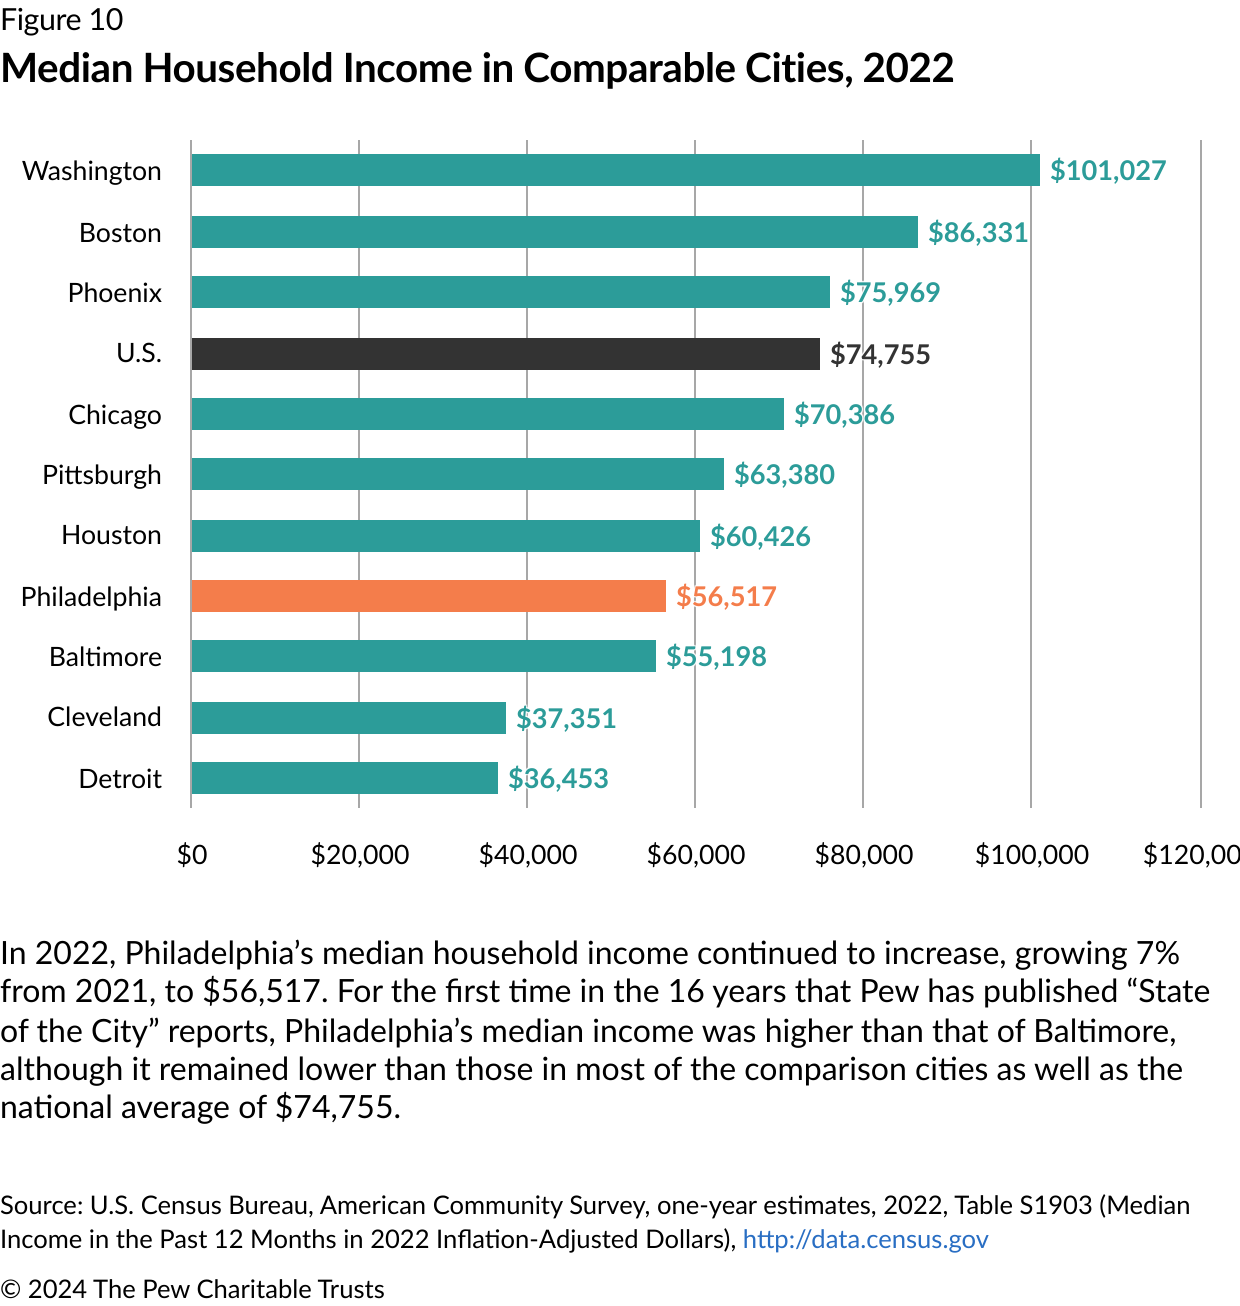
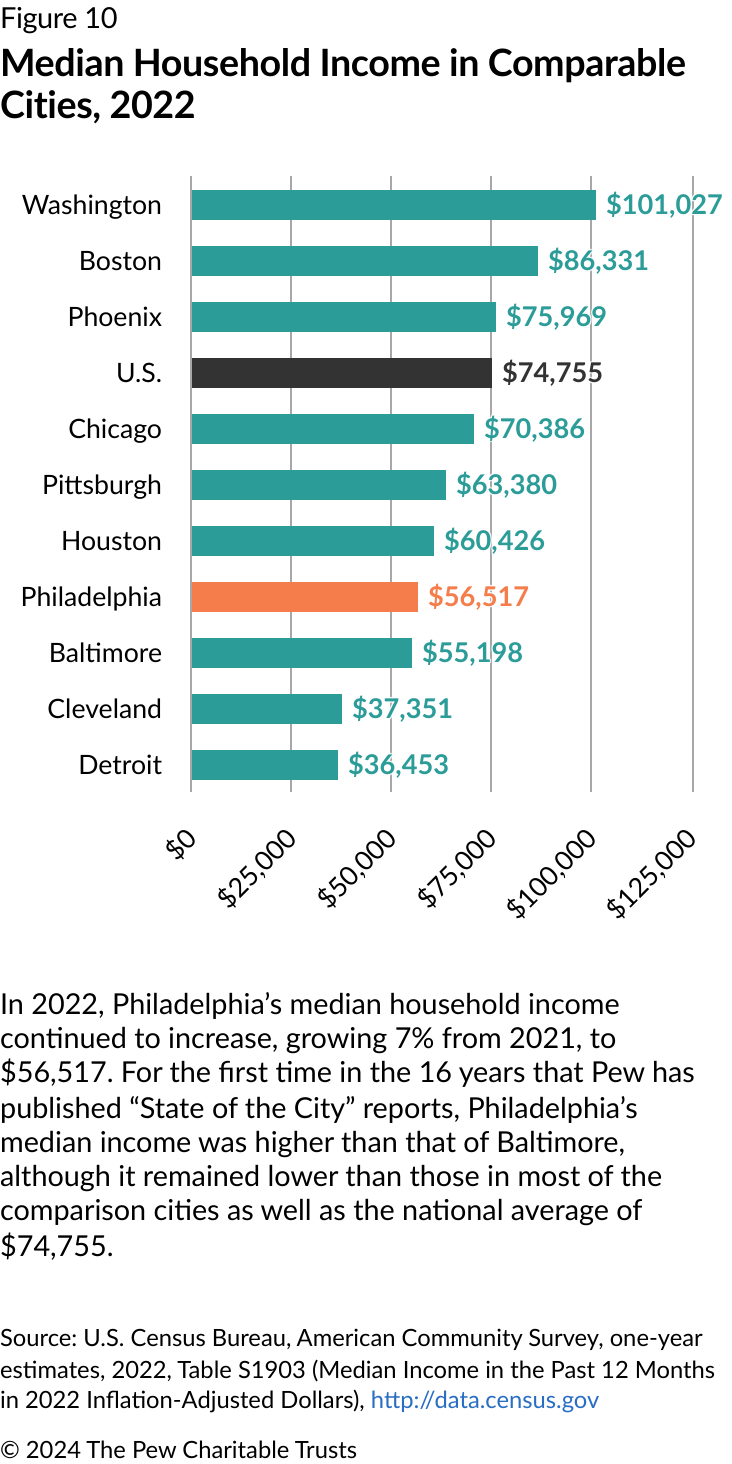
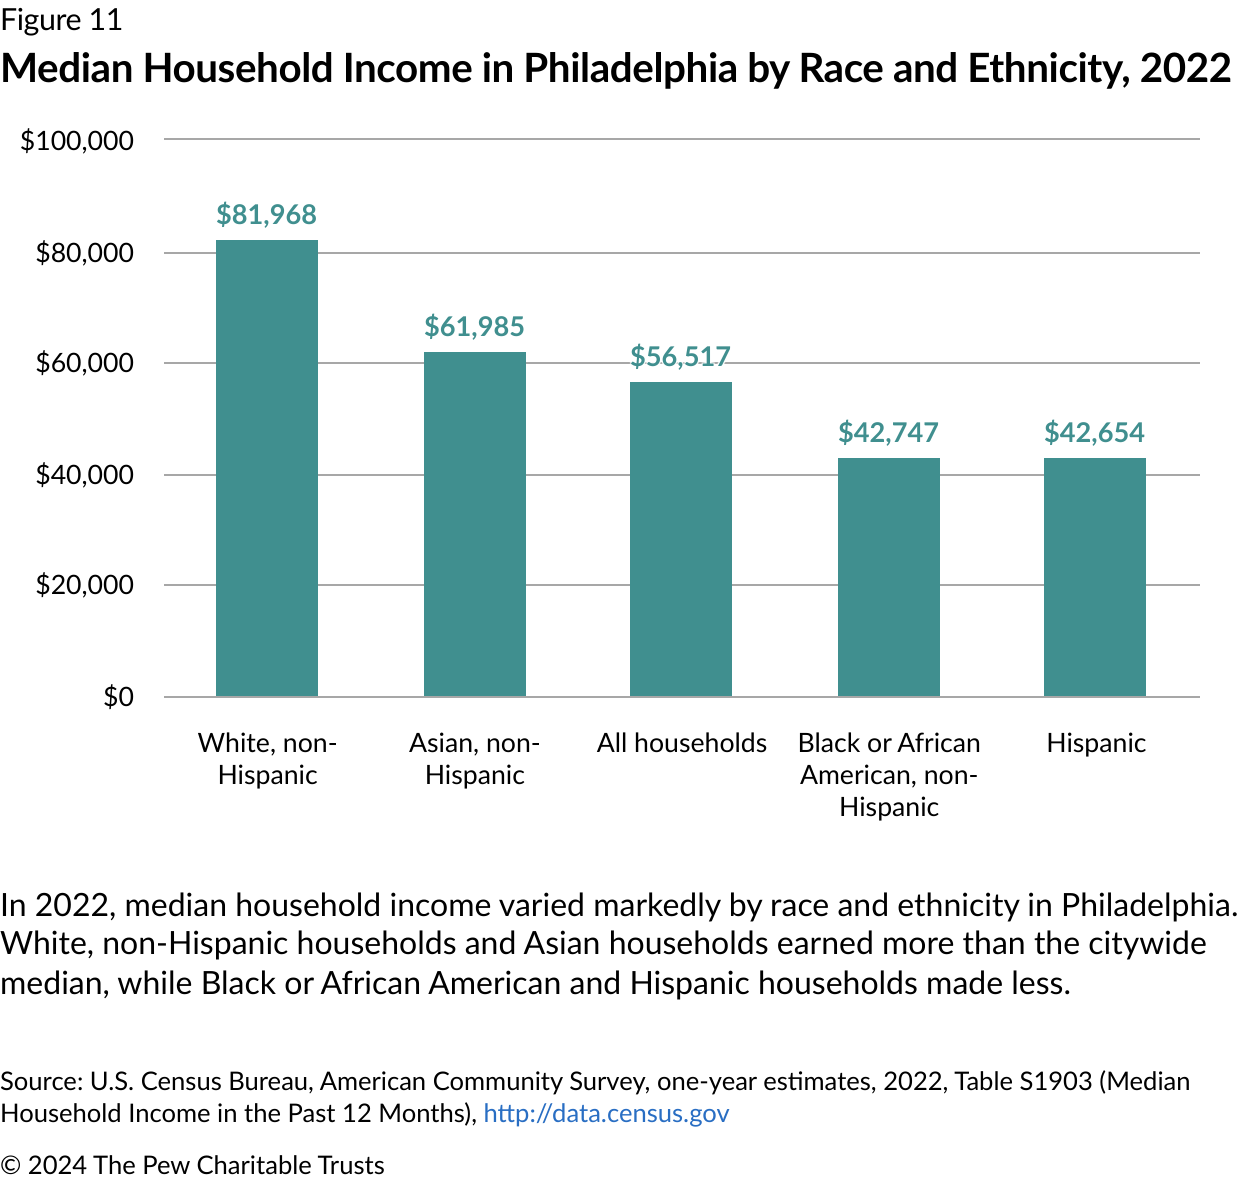
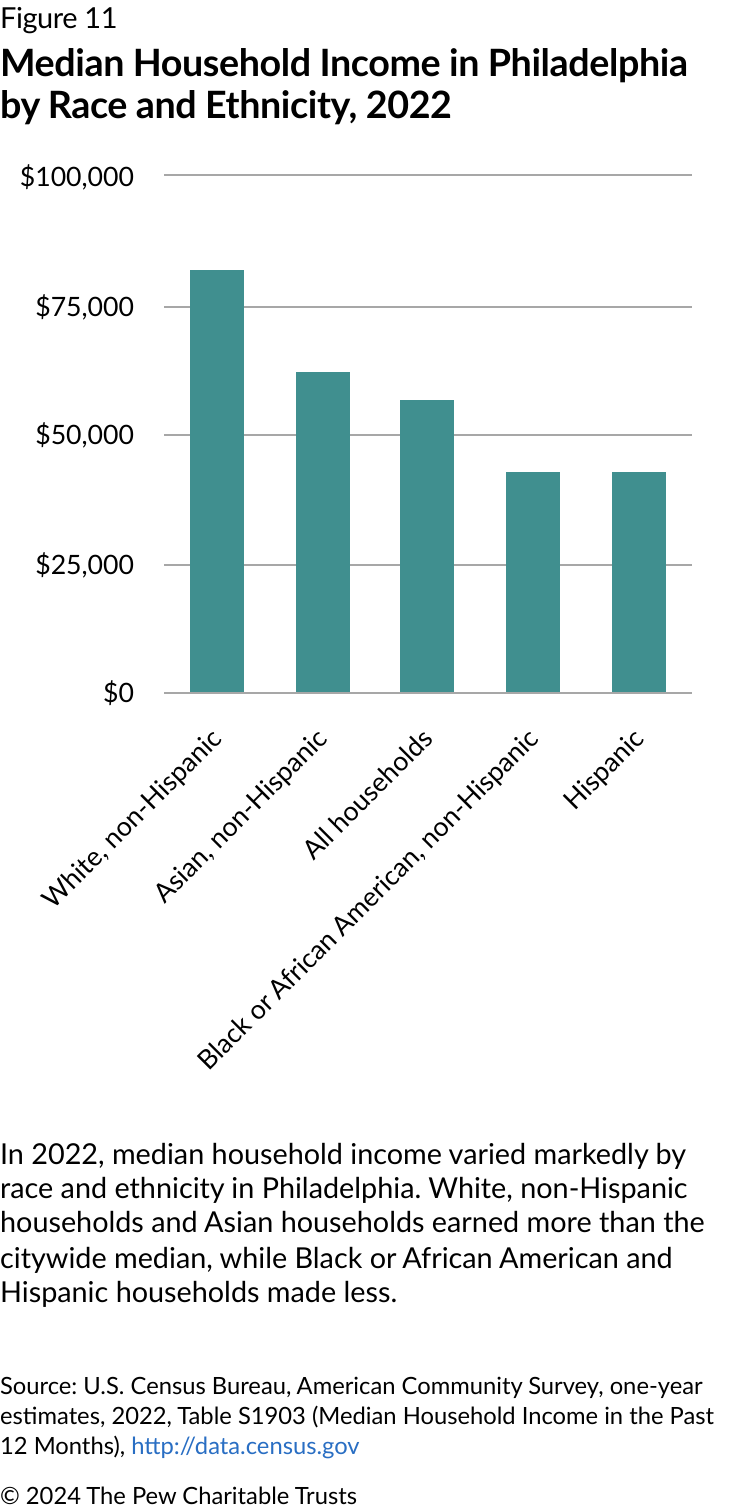
At least by historical standards, Philadelphia’s economy entered the year in relatively good condition. In 2023, the city’s unemployment rate was 4.2% on average, the lowest in more than 30 years, while the number of jobs in the city—an average of 765,400—was the highest in 40 years. Those factors have contributed to rising incomes for city residents: The median household income in 2022, the latest year for which data was available, was $56,517; since 2019, the figure has risen by a healthy 19%, although it remains well below the national average. Yet substantial disparities remain among the city’s racial and ethnic groups, with White, non-Hispanic households earning nearly $40,000 more per year, on average, than Black or Hispanic households.
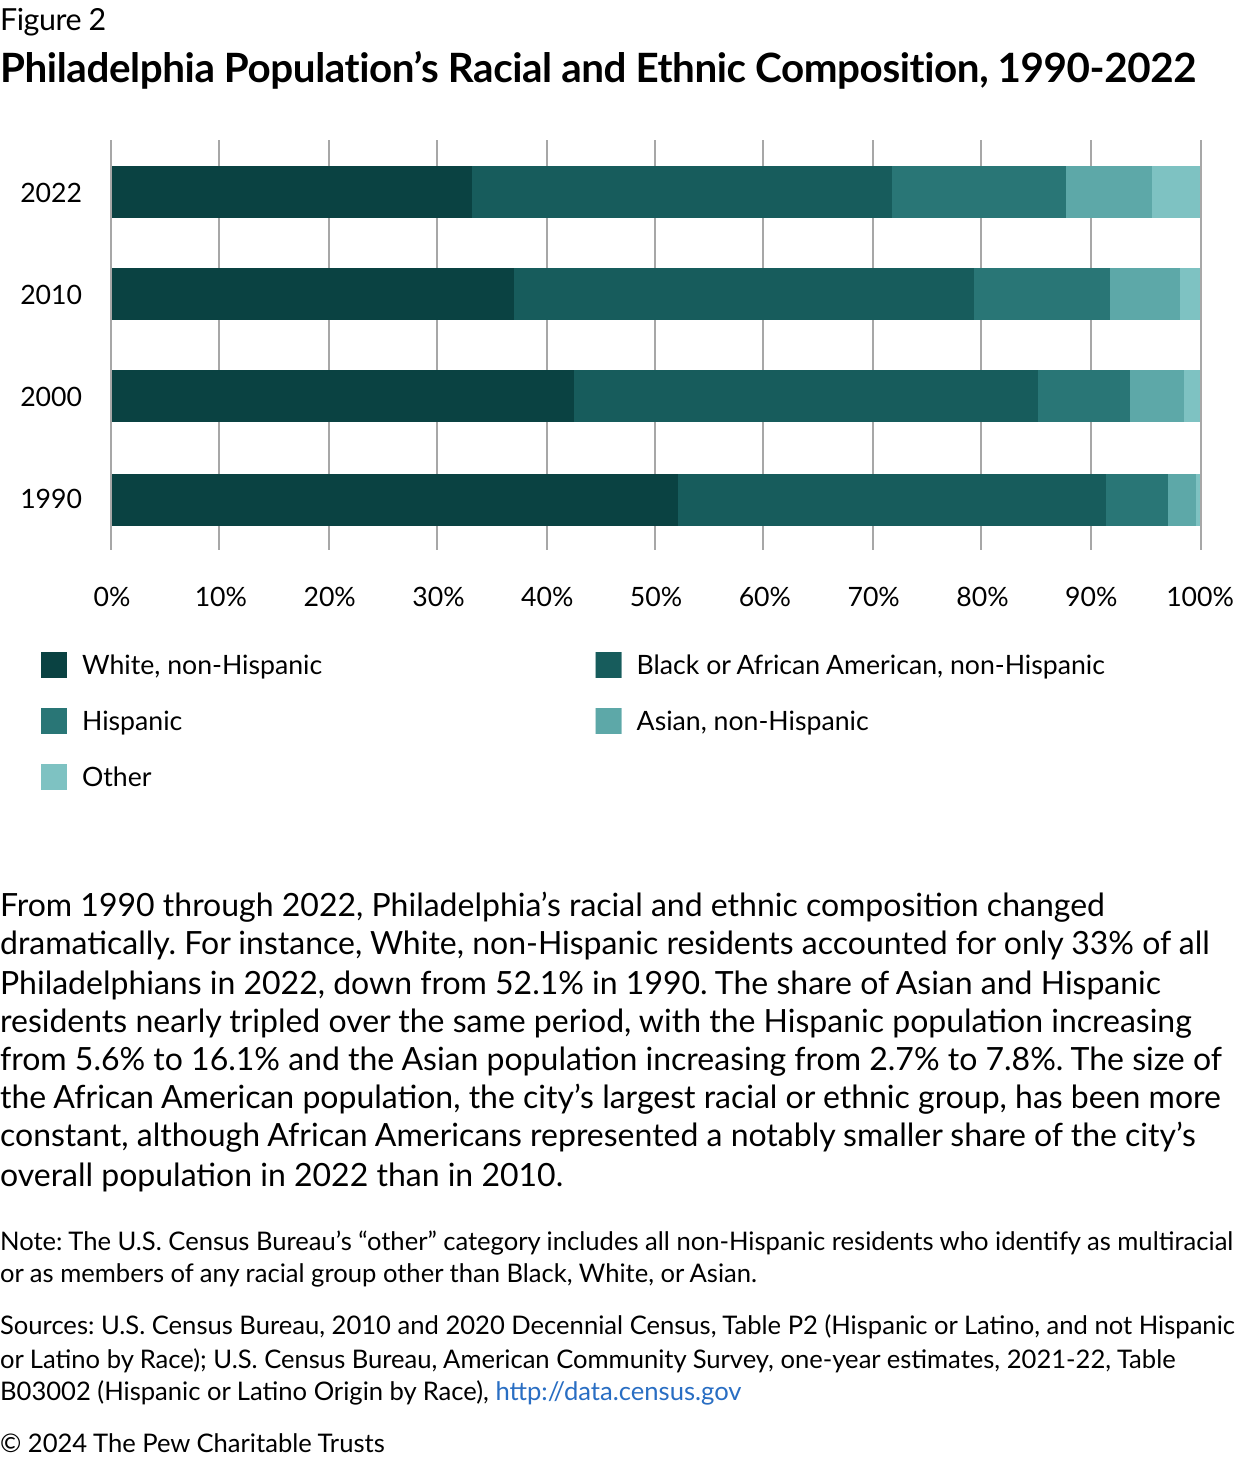
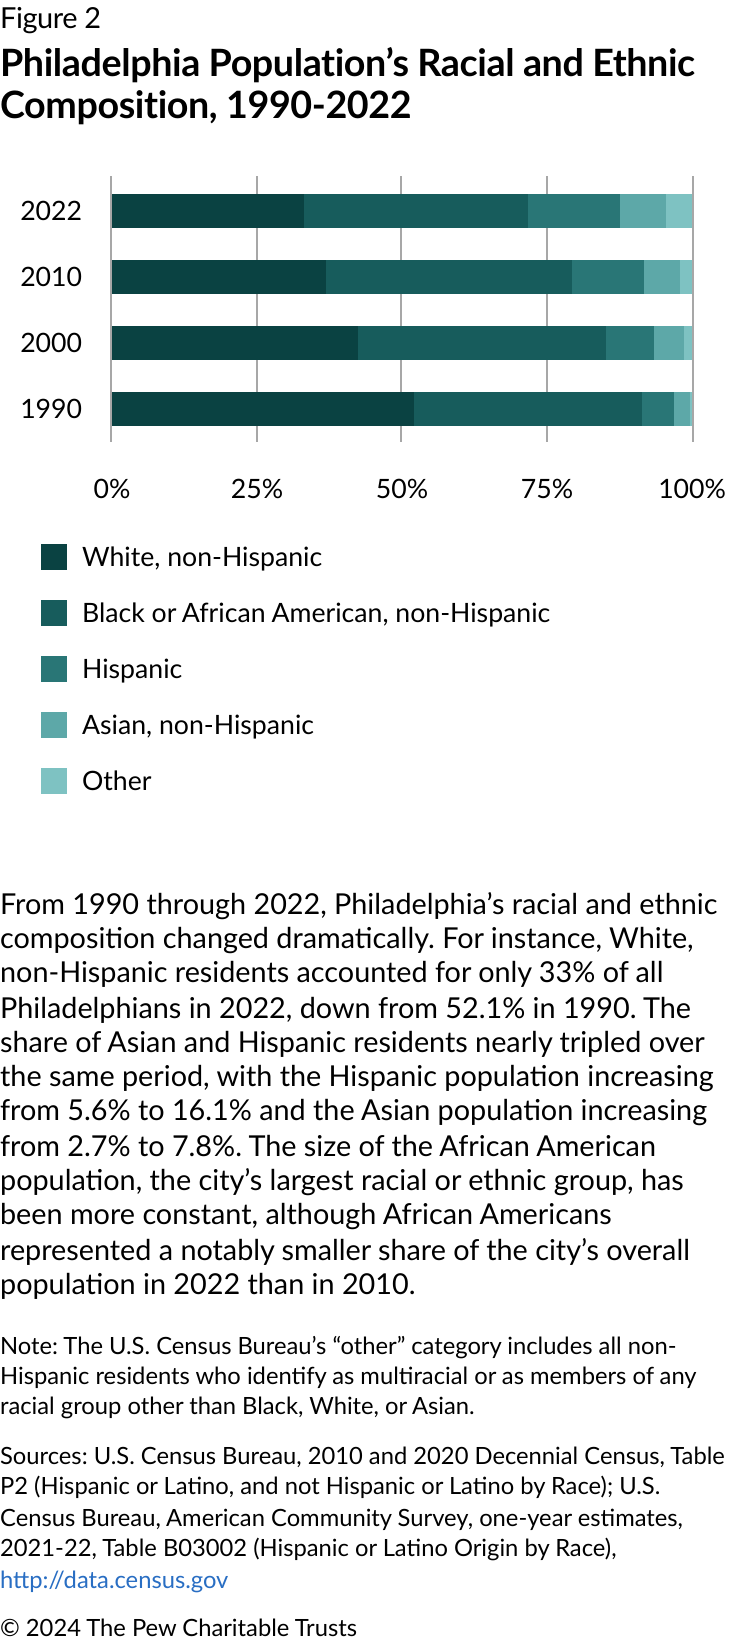
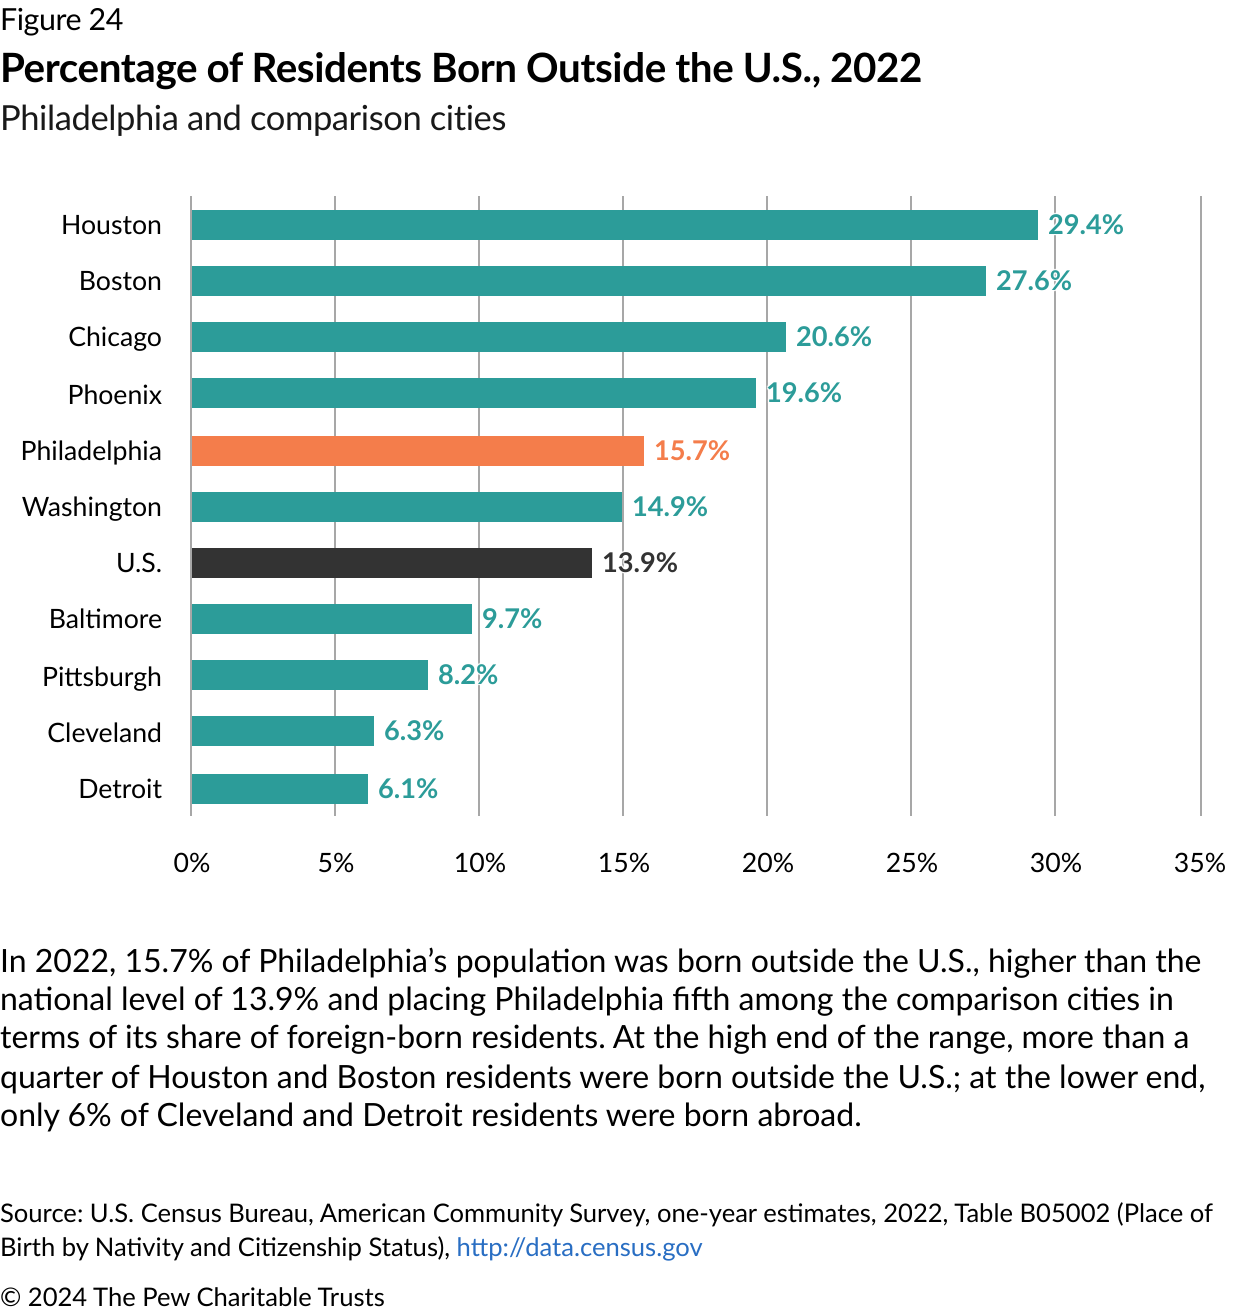
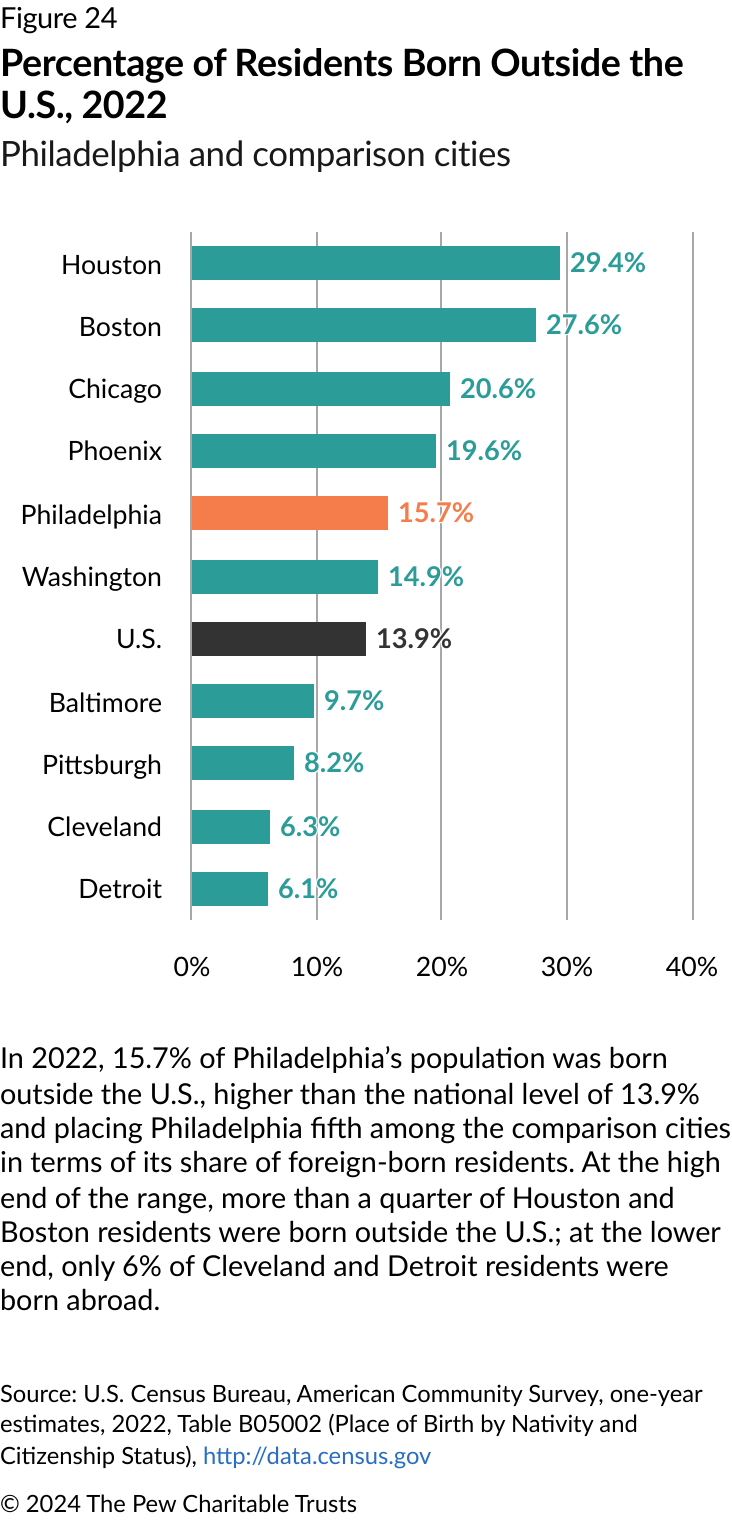
As for the makeup of its population, Philadelphia is becoming an ever more diverse city, with Hispanic residents now representing more than 16% of the city’s population and Asian residents—whose population is up by about a third since 2000—representing 8%. Much of Philadelphia’s increasing diversity stems from the rising number of immigrants, many of whom were born in Asia or the Caribbean. Currently, 15.7% of the city’s residents report being born outside the United States, the highest share since the 1940s.
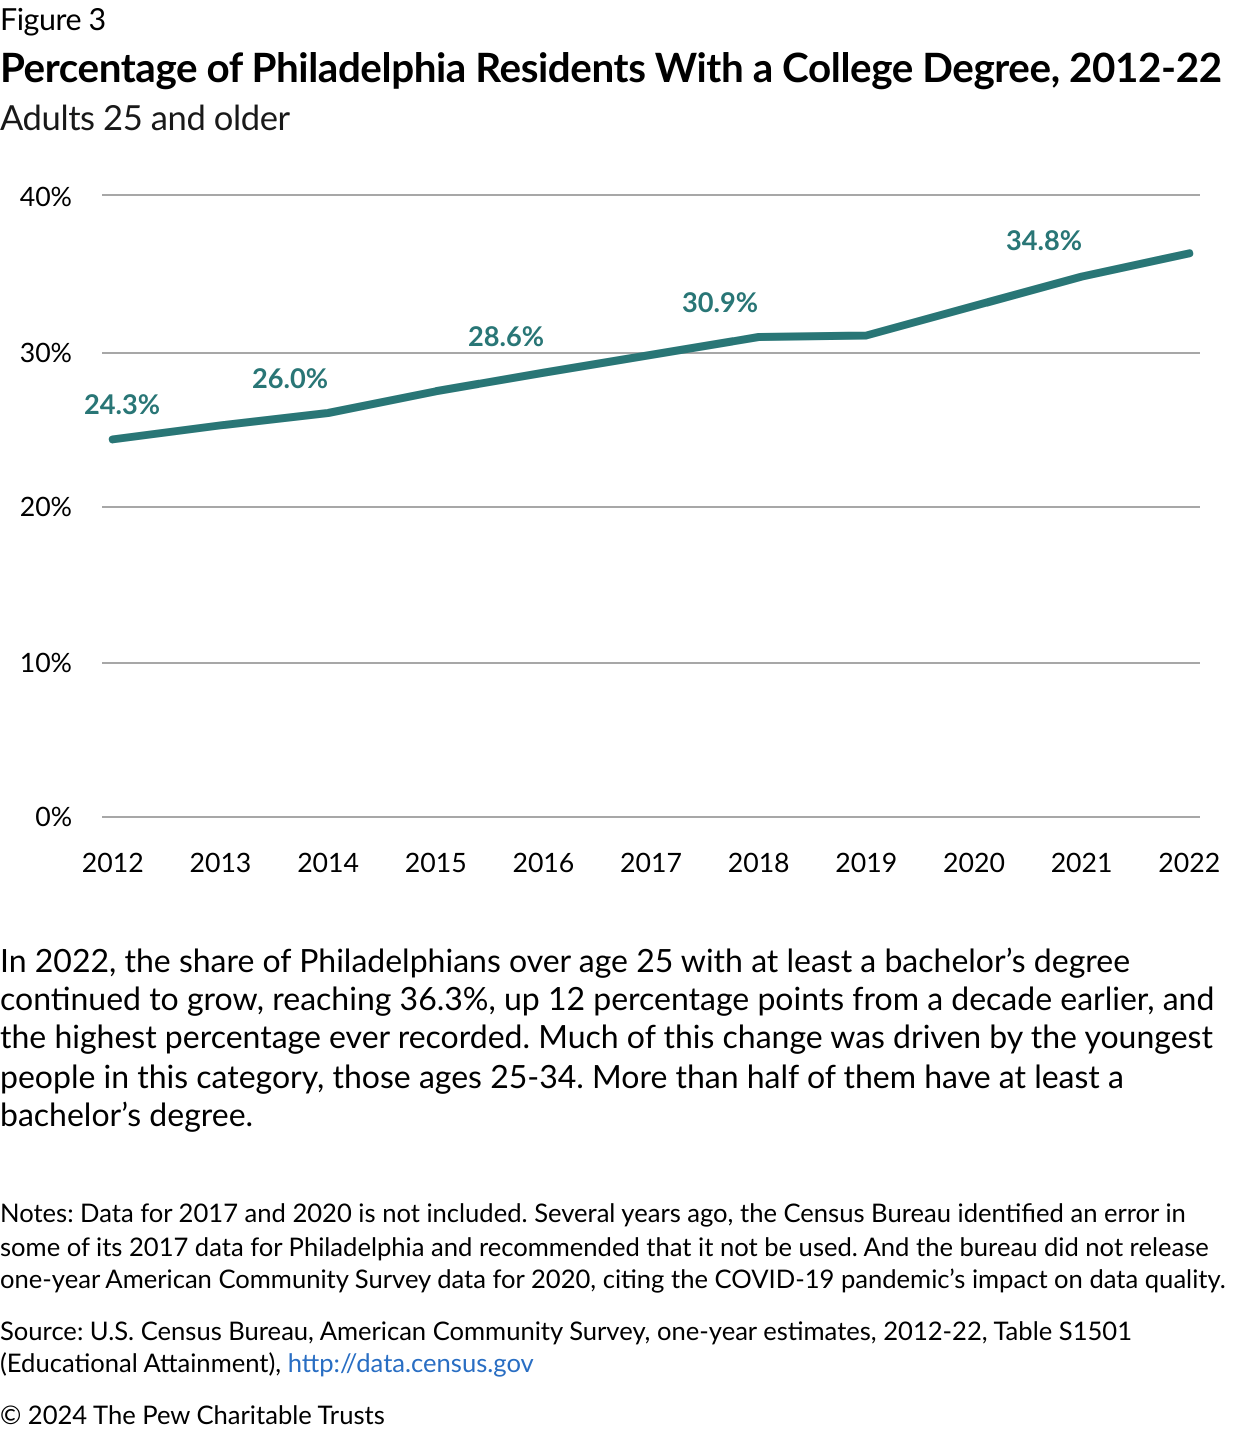
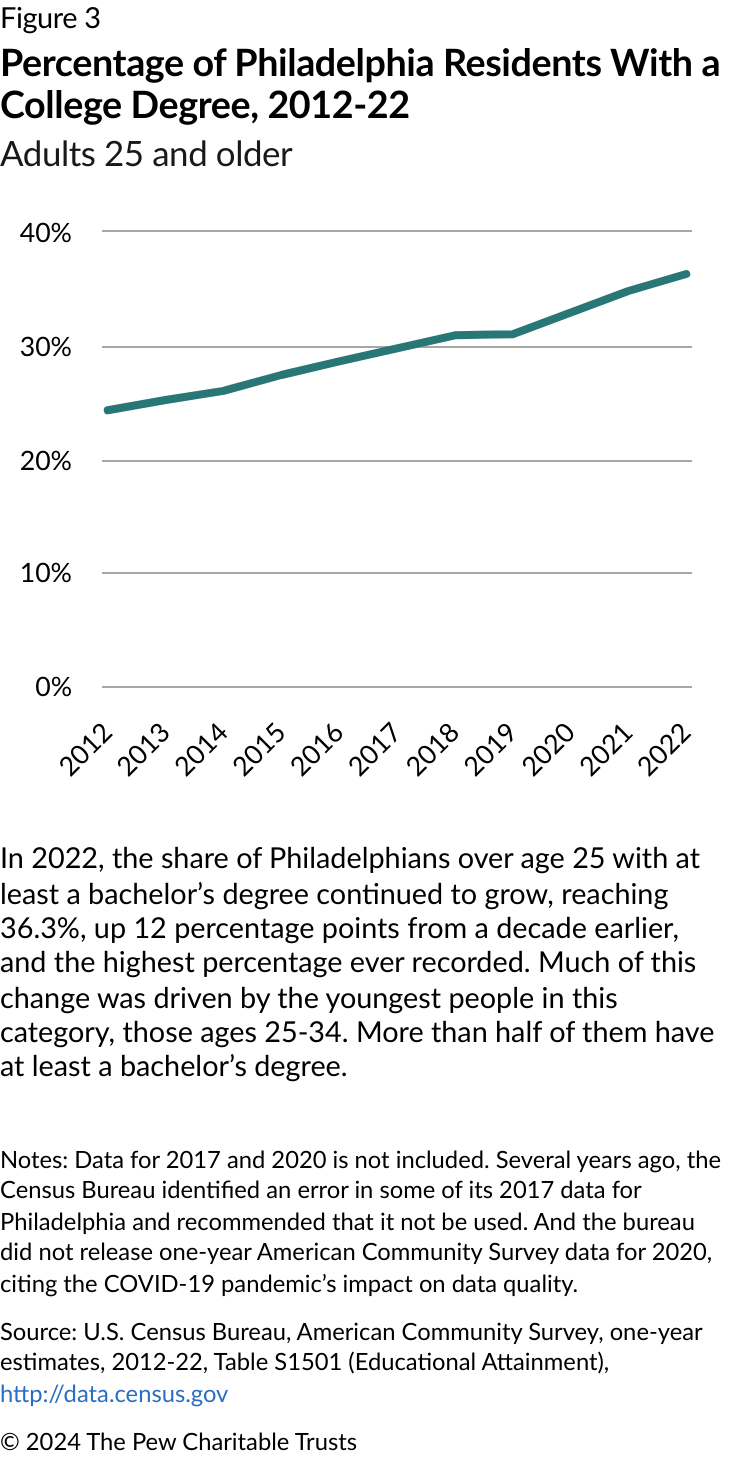
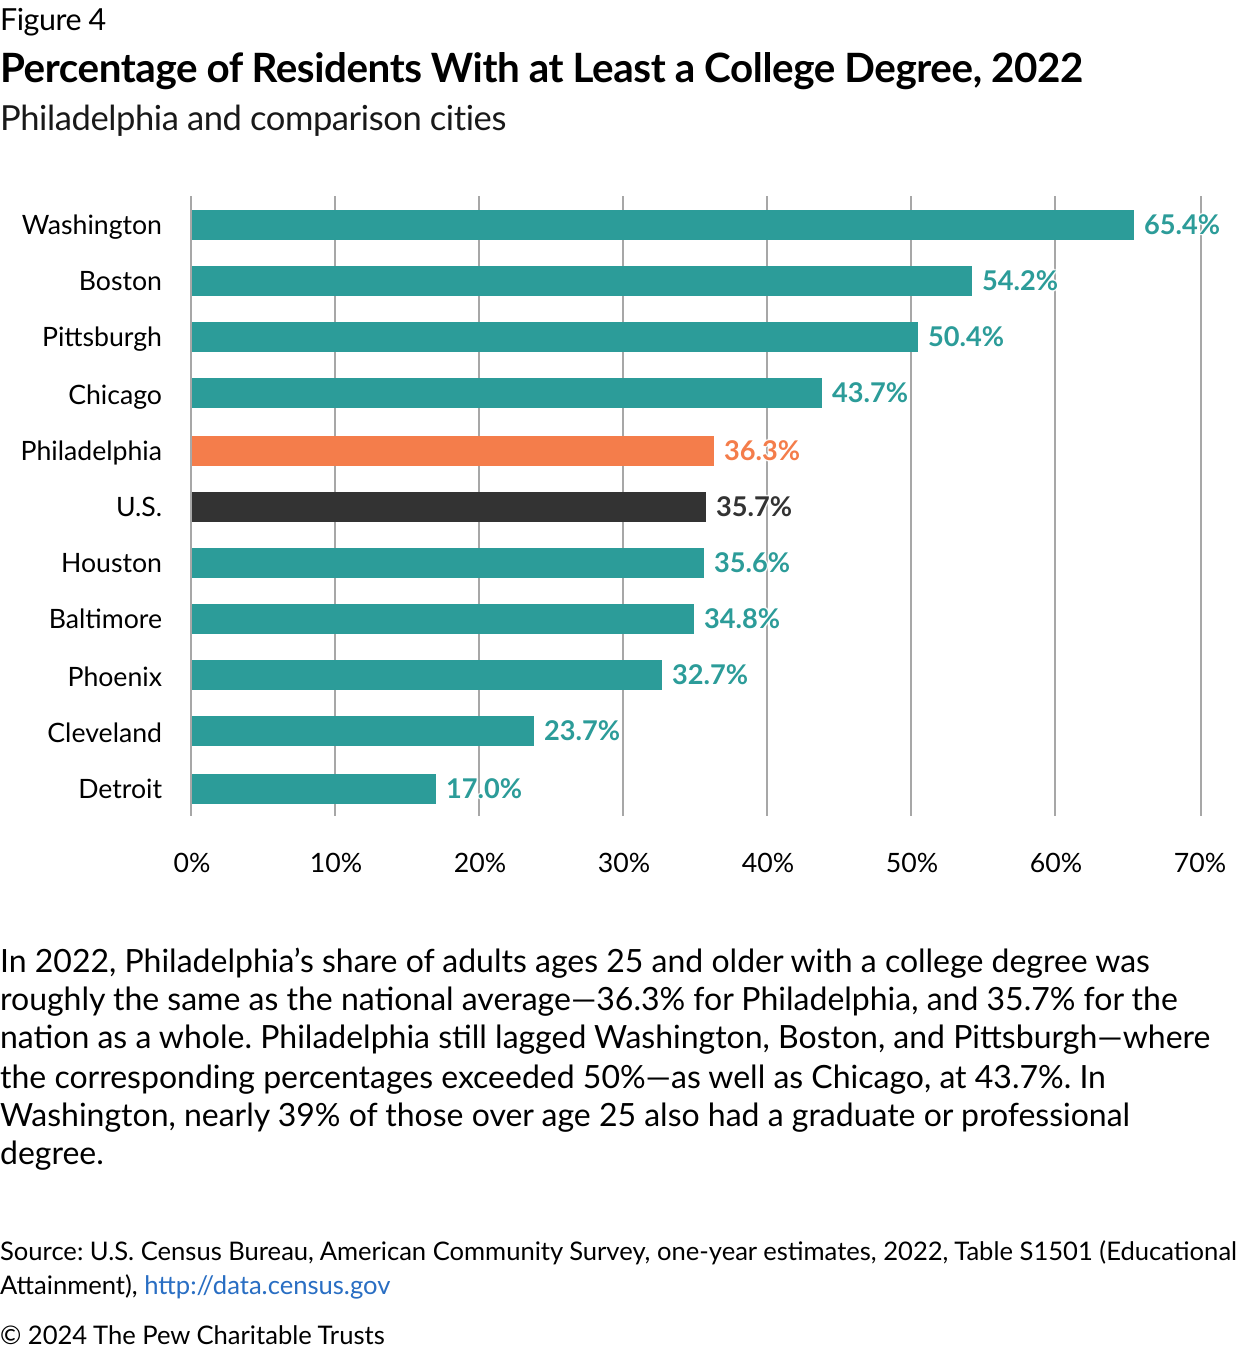
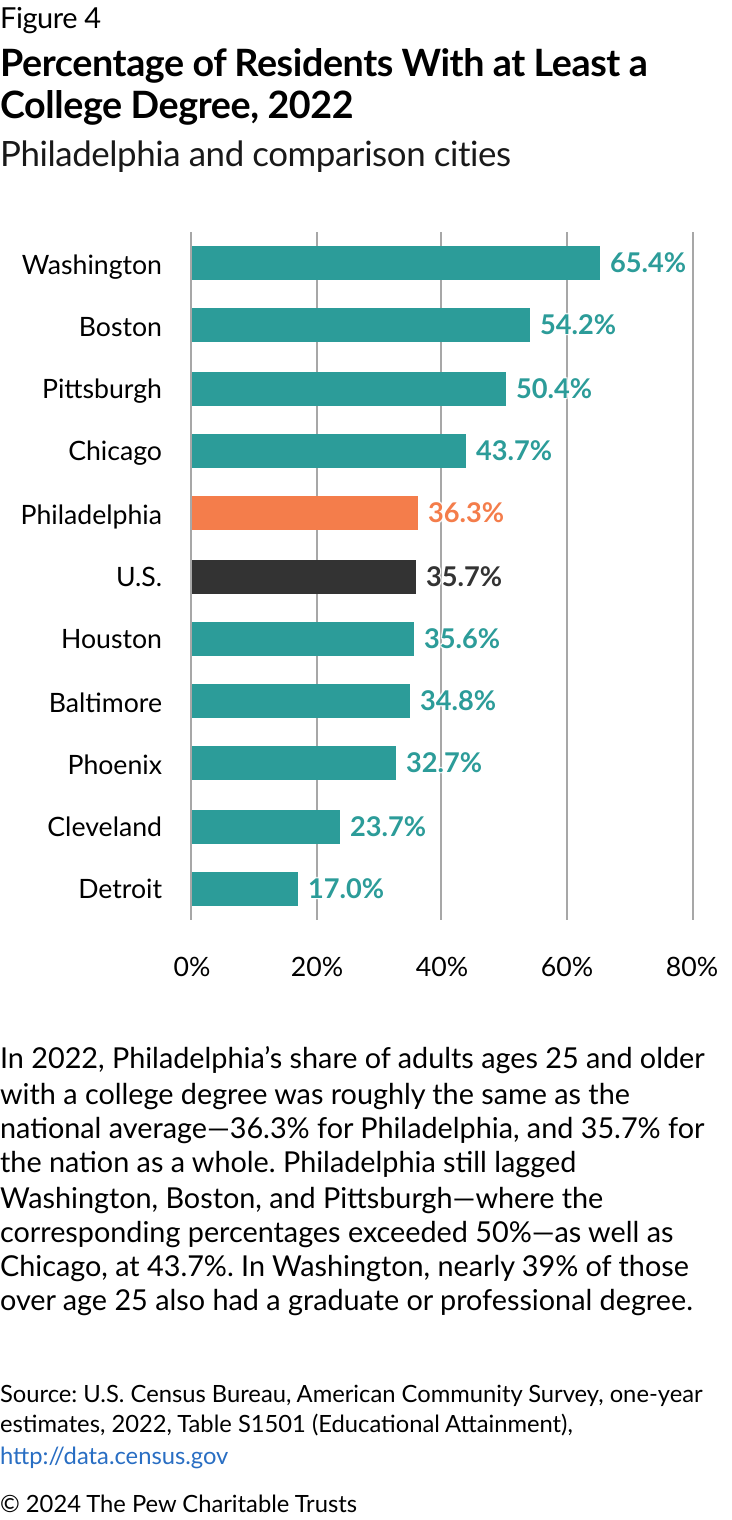
In addition, Philadelphians are better educated than ever, with 36% of residents, including more than half of all younger adults ages 25-34, having at least a four-year degree.
The city government’s fiscal health is relatively strong as well, even though the city will be using the last round of its federal pandemic-era relief dollars this year. City revenue has continued to increase since 2020, thanks in part to higher-than-expected wage tax earnings.
Despite these largely positive indicators, huge challenges remain for Philadelphia.
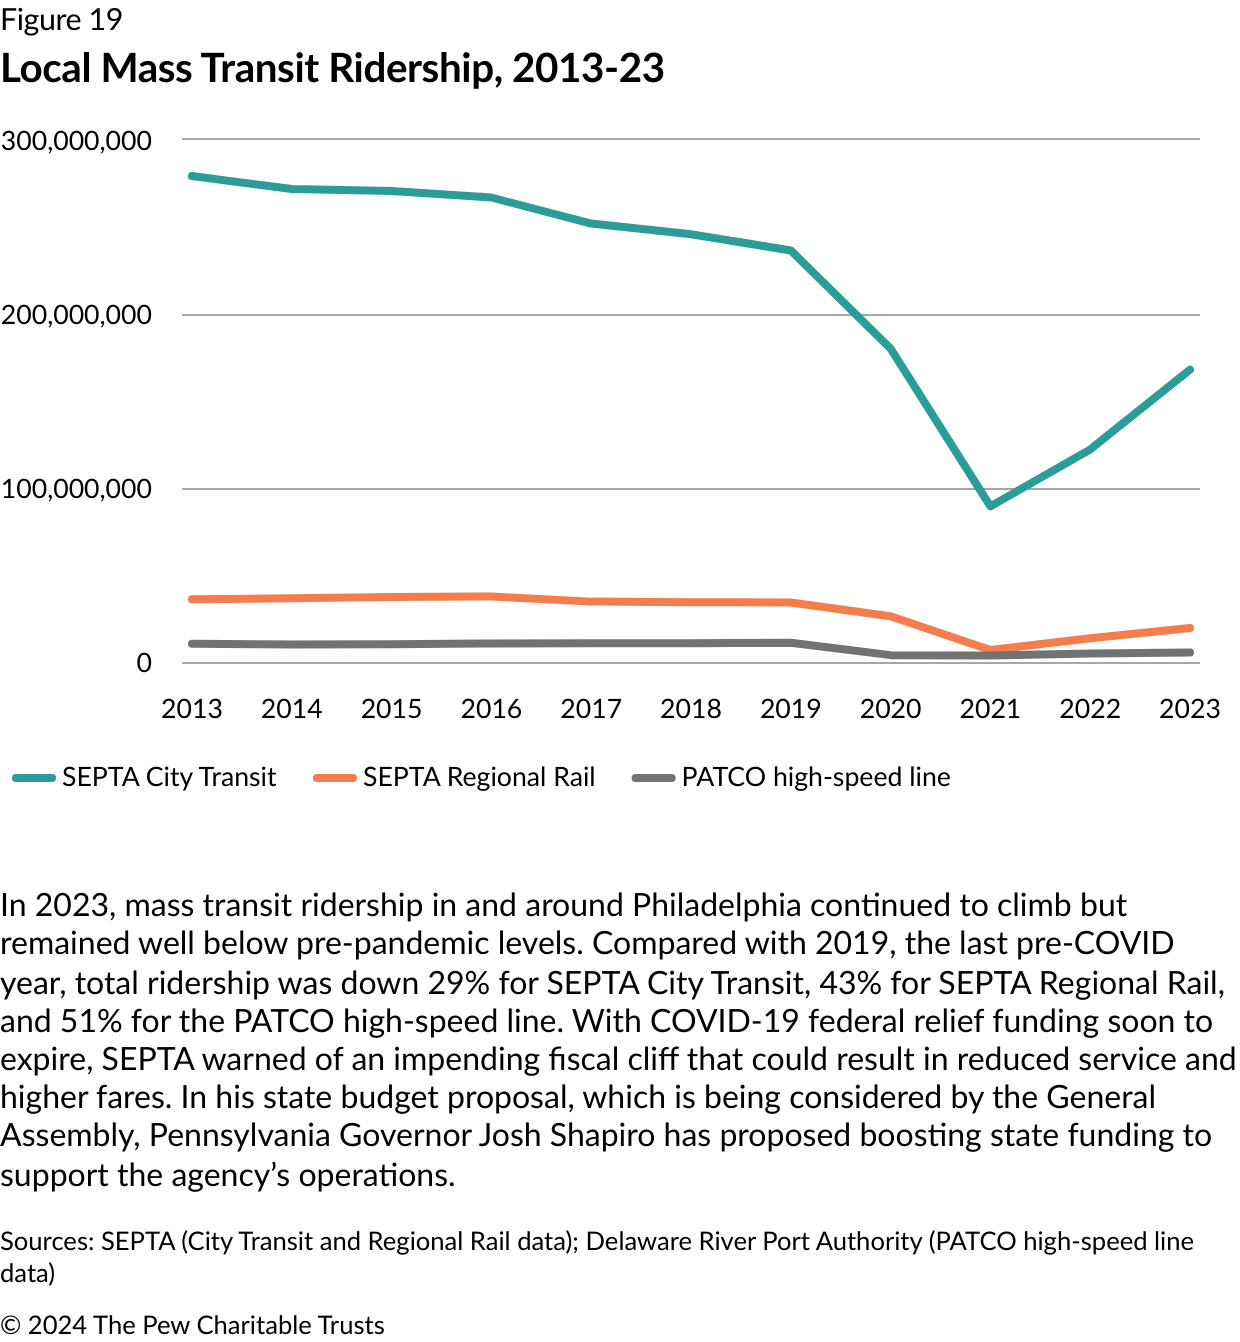
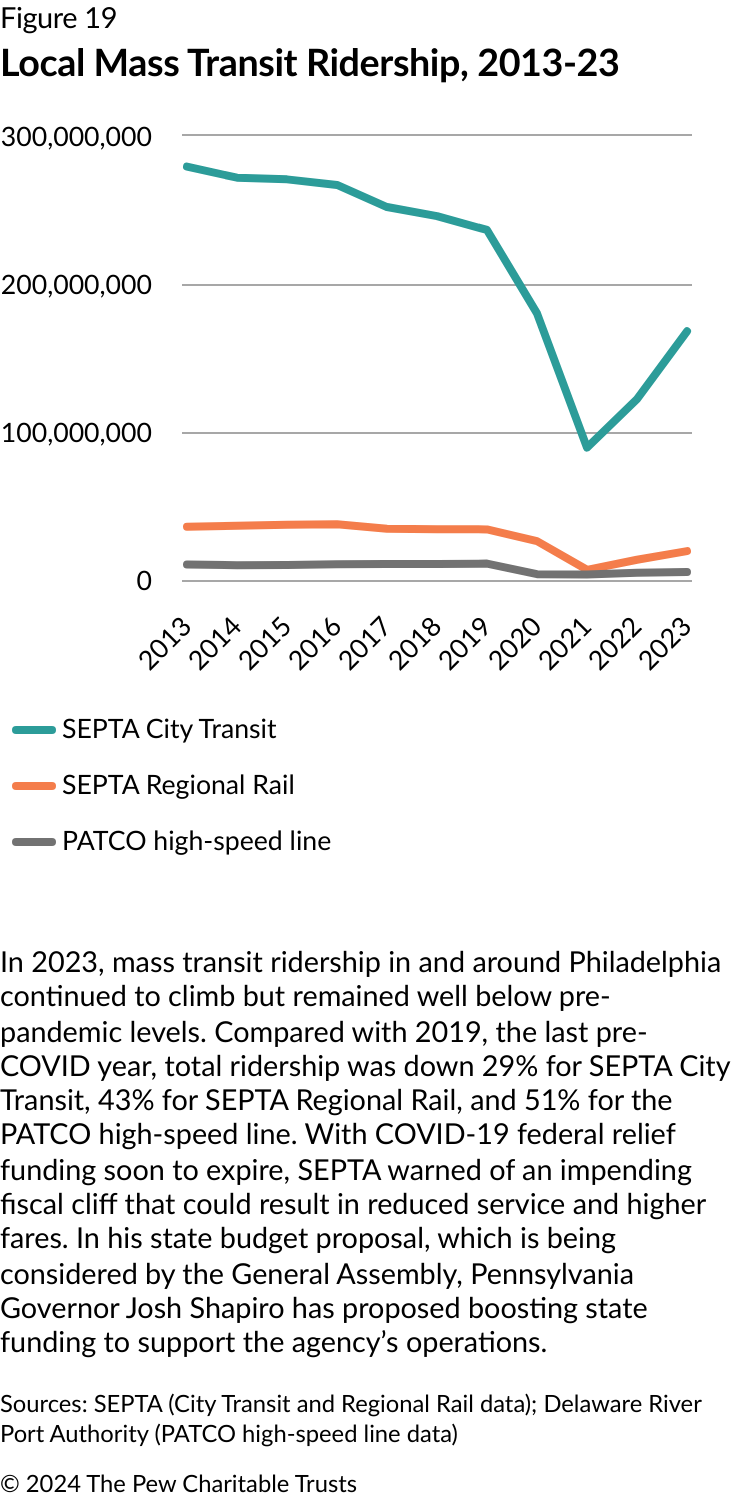
The fiscal prospects of two of the city’s leading public institutions—the Southeastern Pennsylvania Transportation Authority (SEPTA) and the School District of Philadelphia, both of which also received substantial federal help to weather the pandemic and its aftermath—are not so rosy. To fend off service cuts and fare hikes, SEPTA has called for expanded state funding; the system’s ridership, which has gradually increased in the past several years, is still far below pre-pandemic levels, with the City Transit division off 29% from 2019 and Regional Rail down 43%. Similarly, the school district is projecting a major deficit that could result in service cuts in schools after its federal relief aid expires at the end of the year
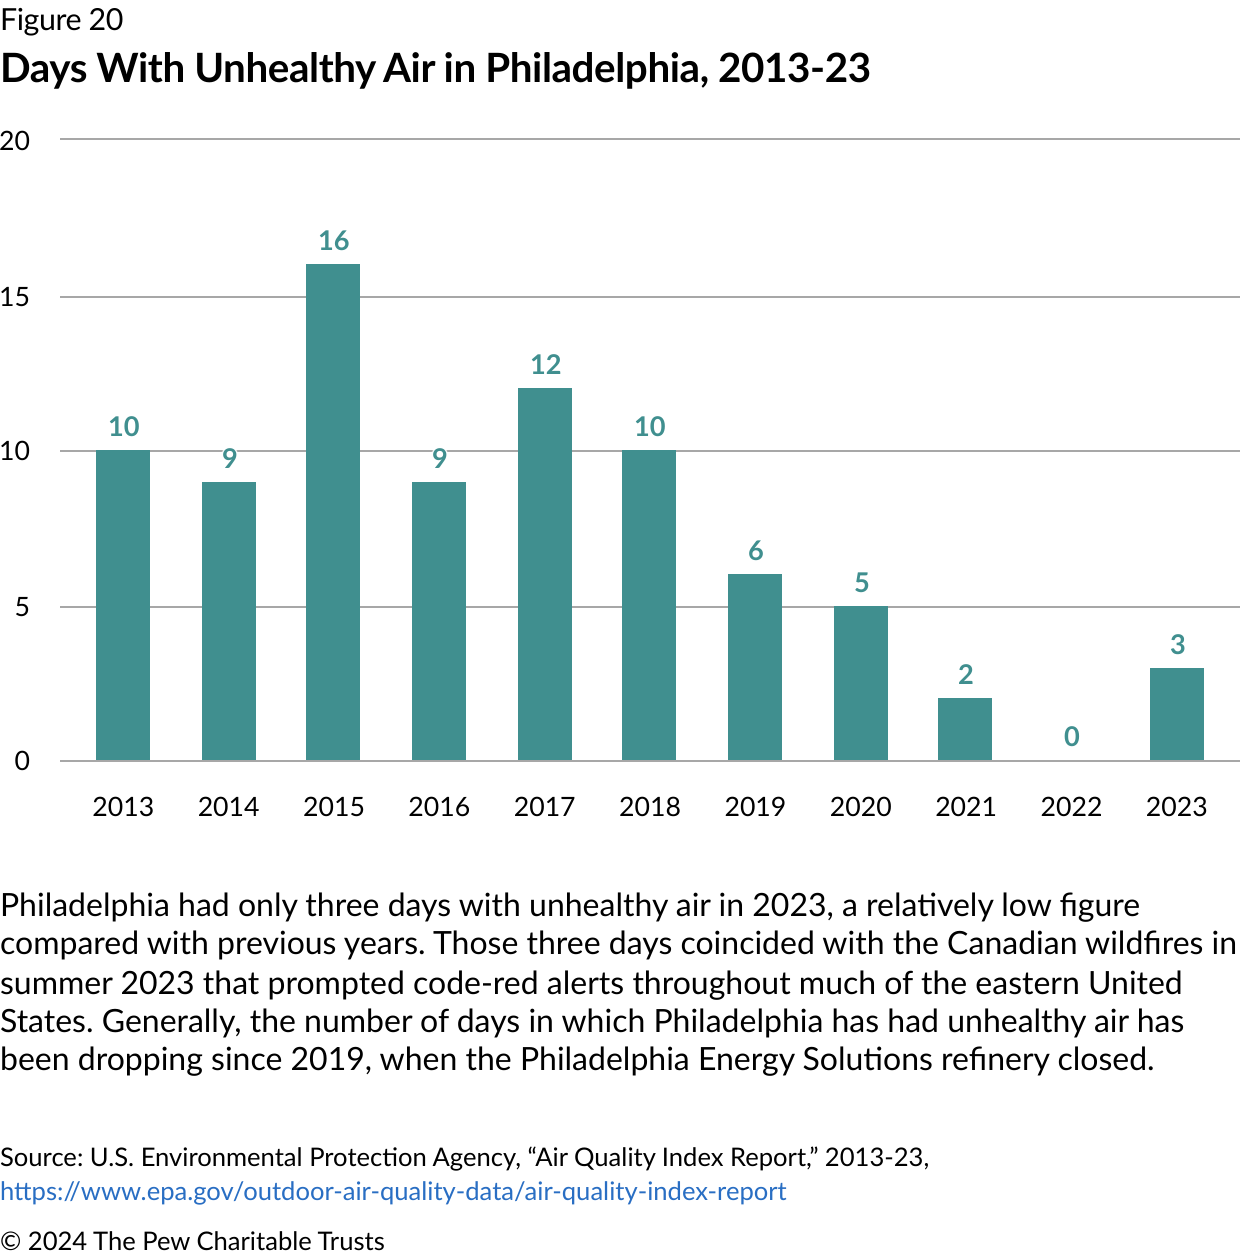
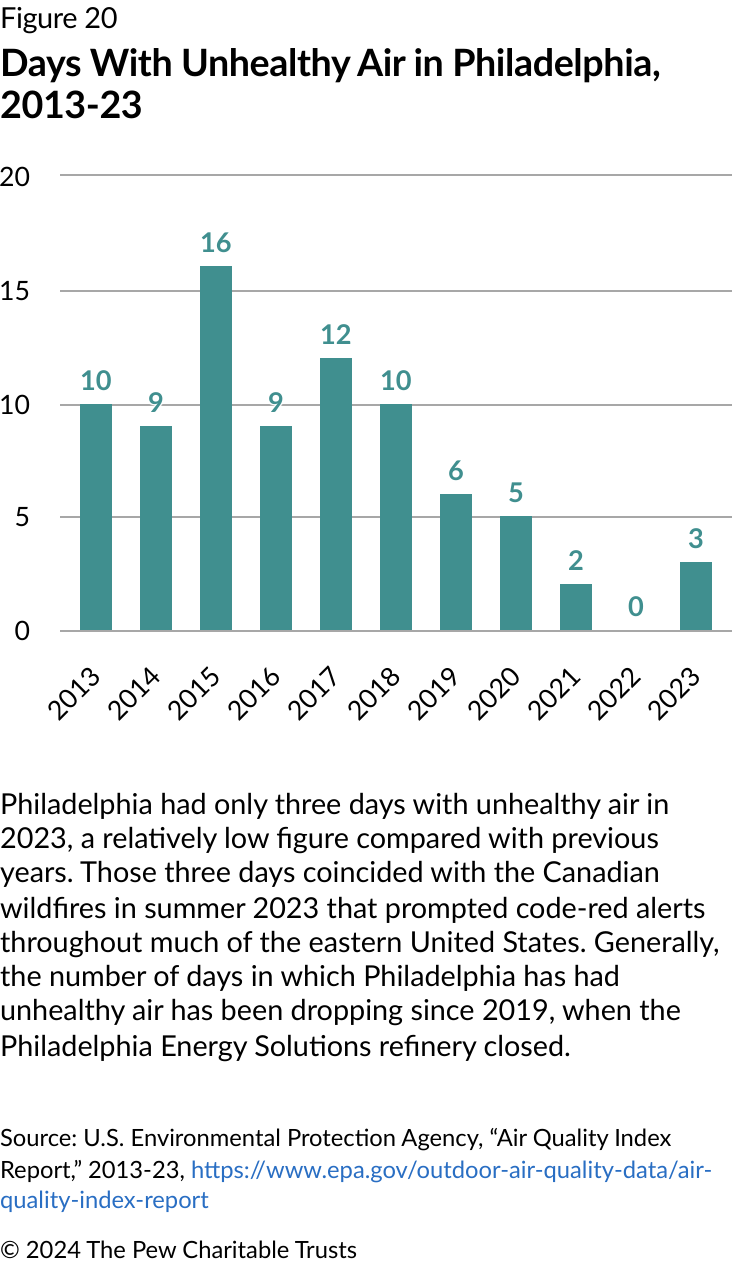
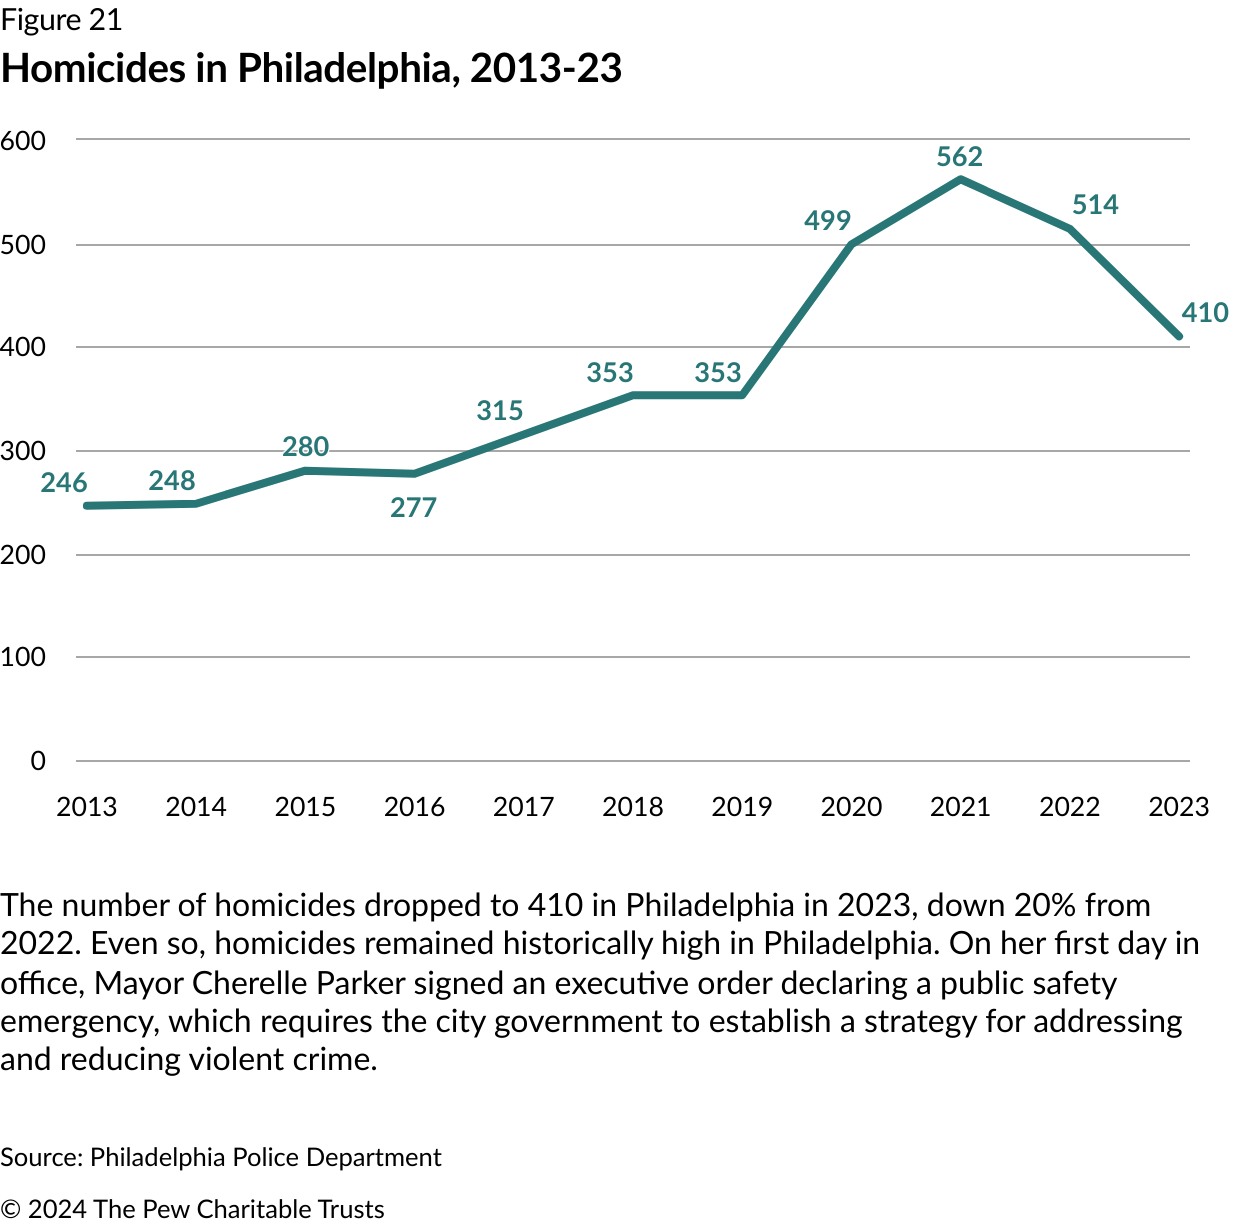
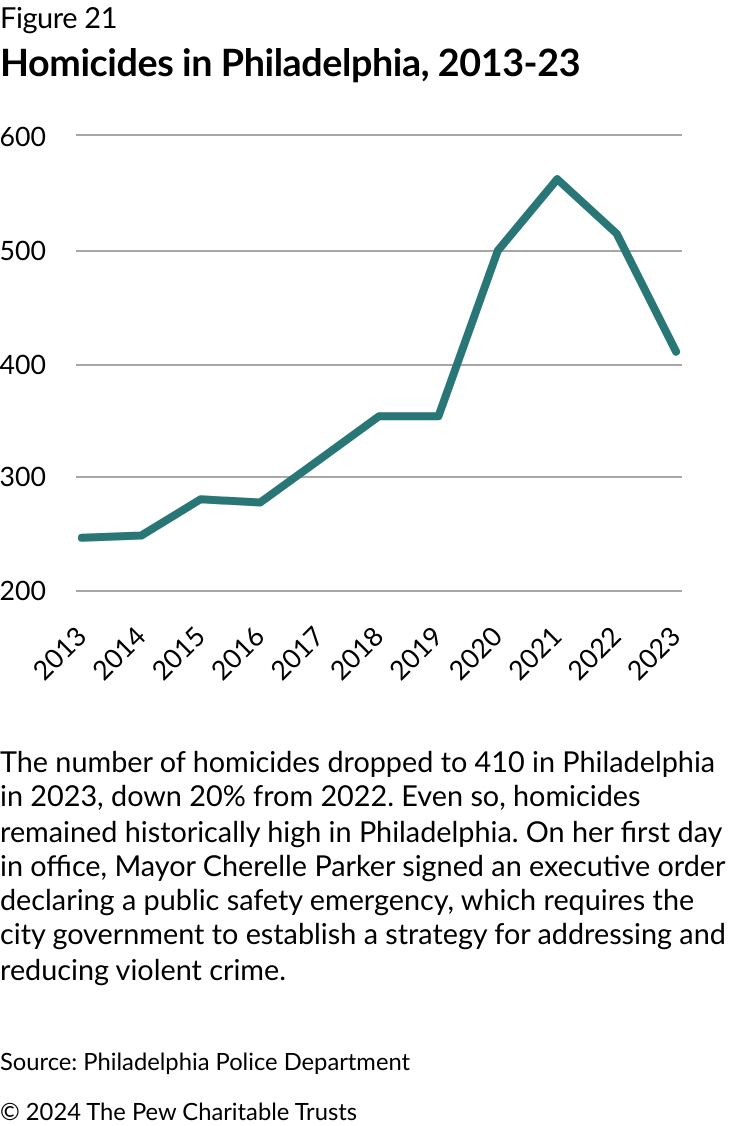
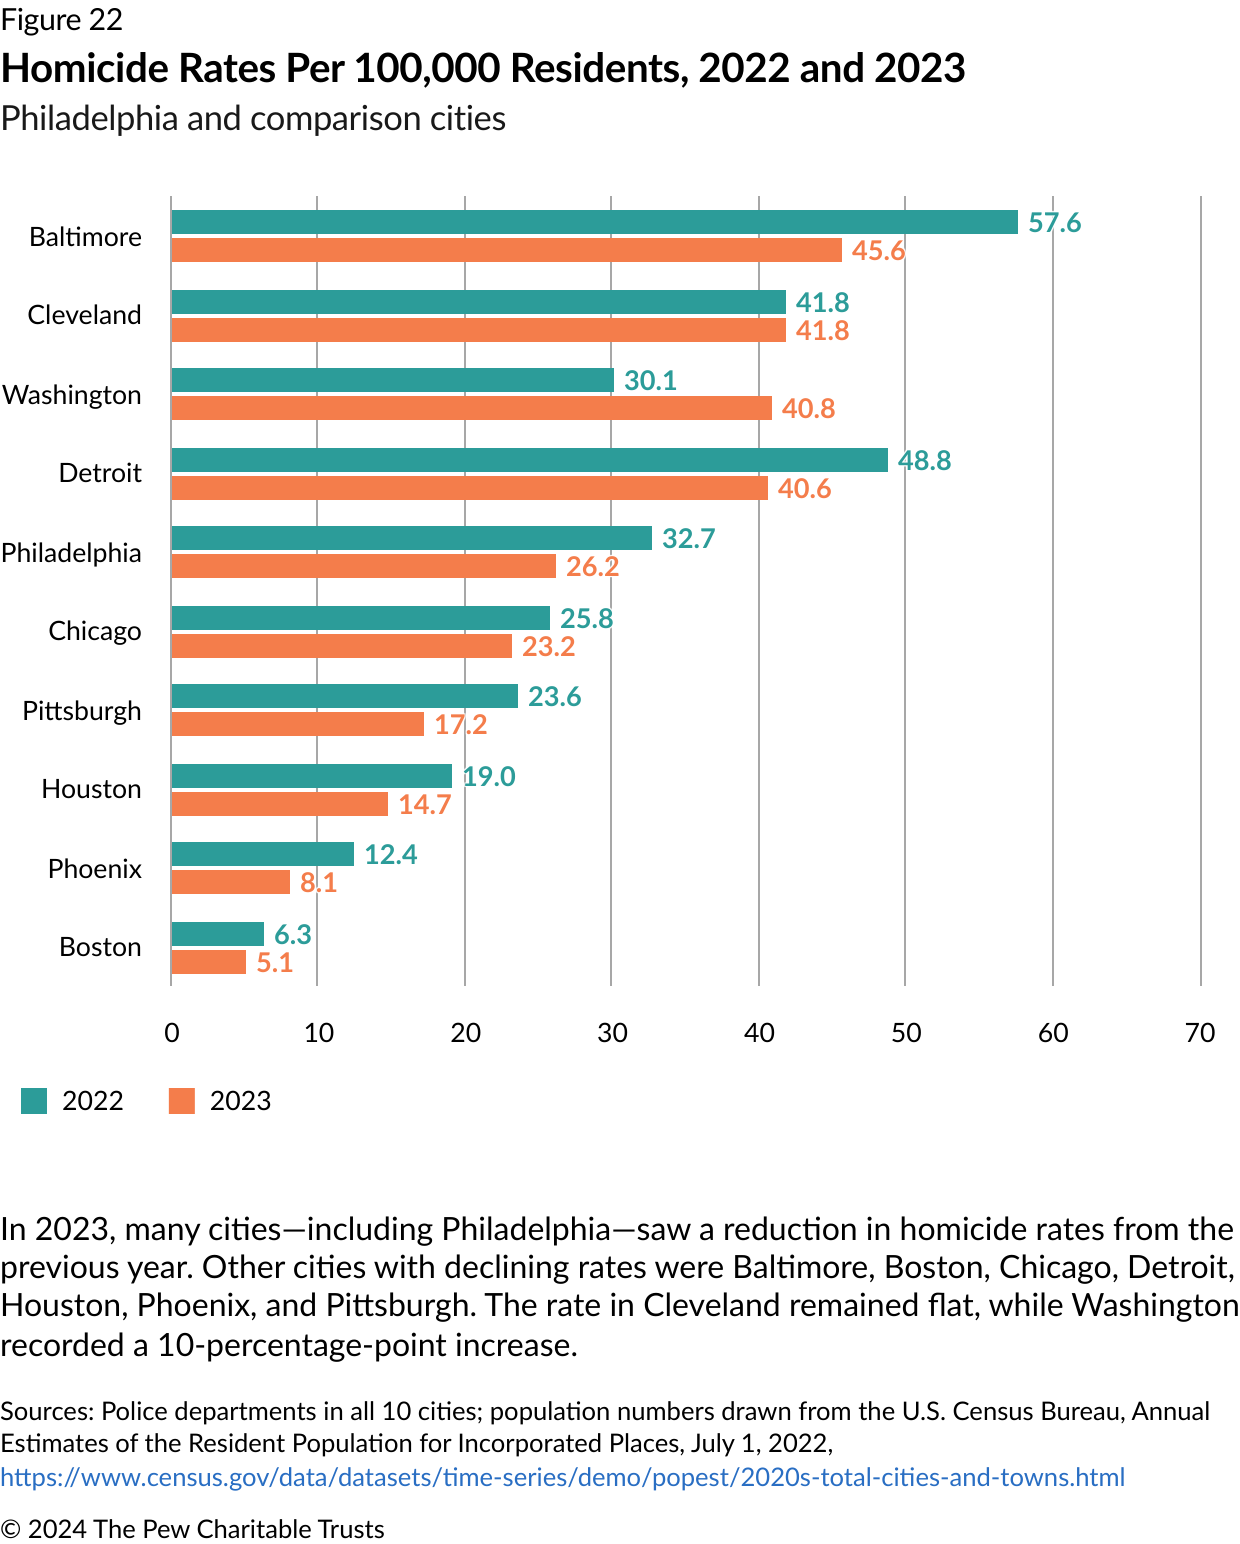
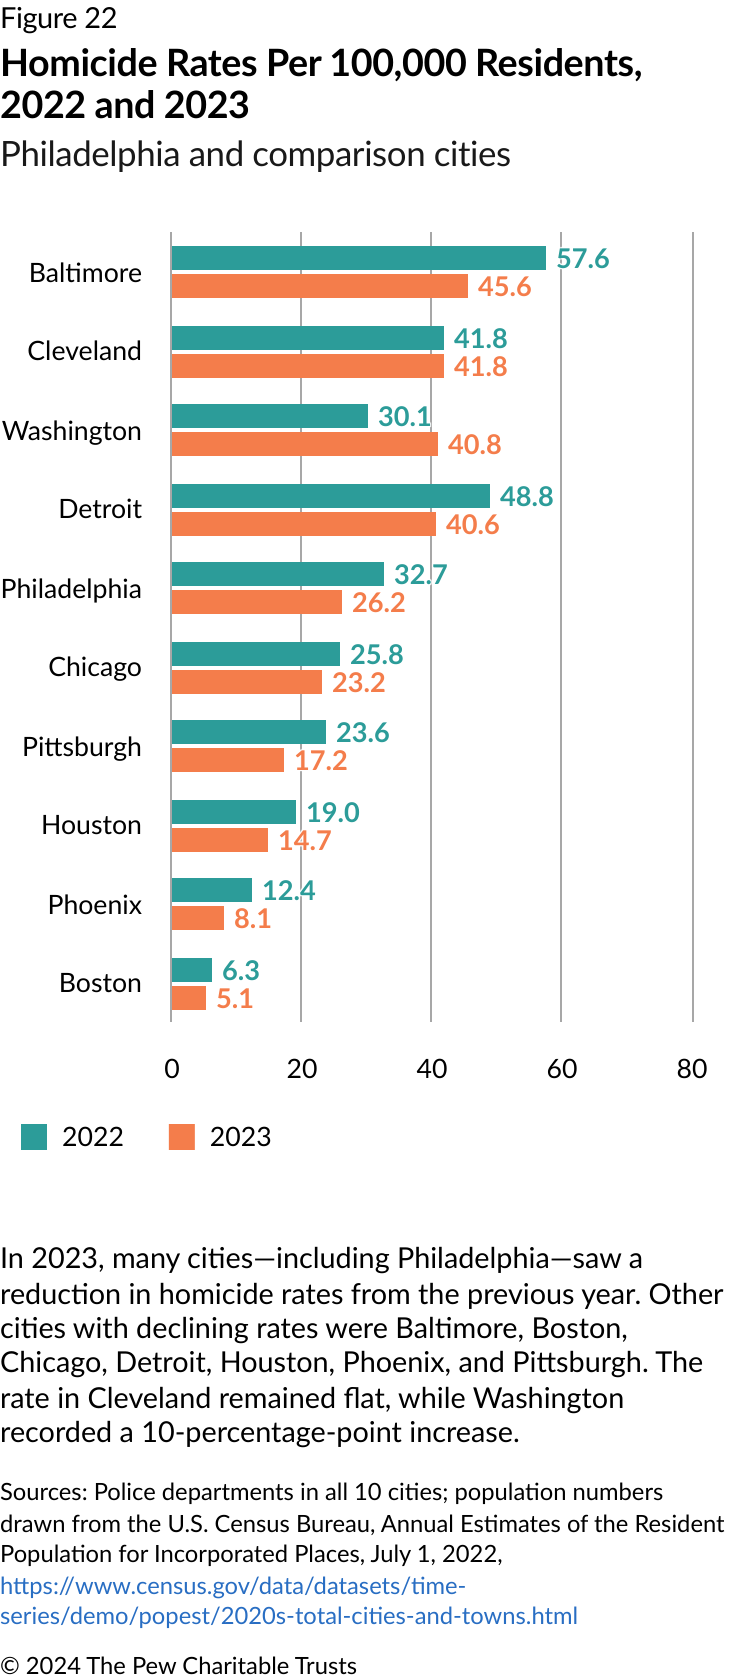
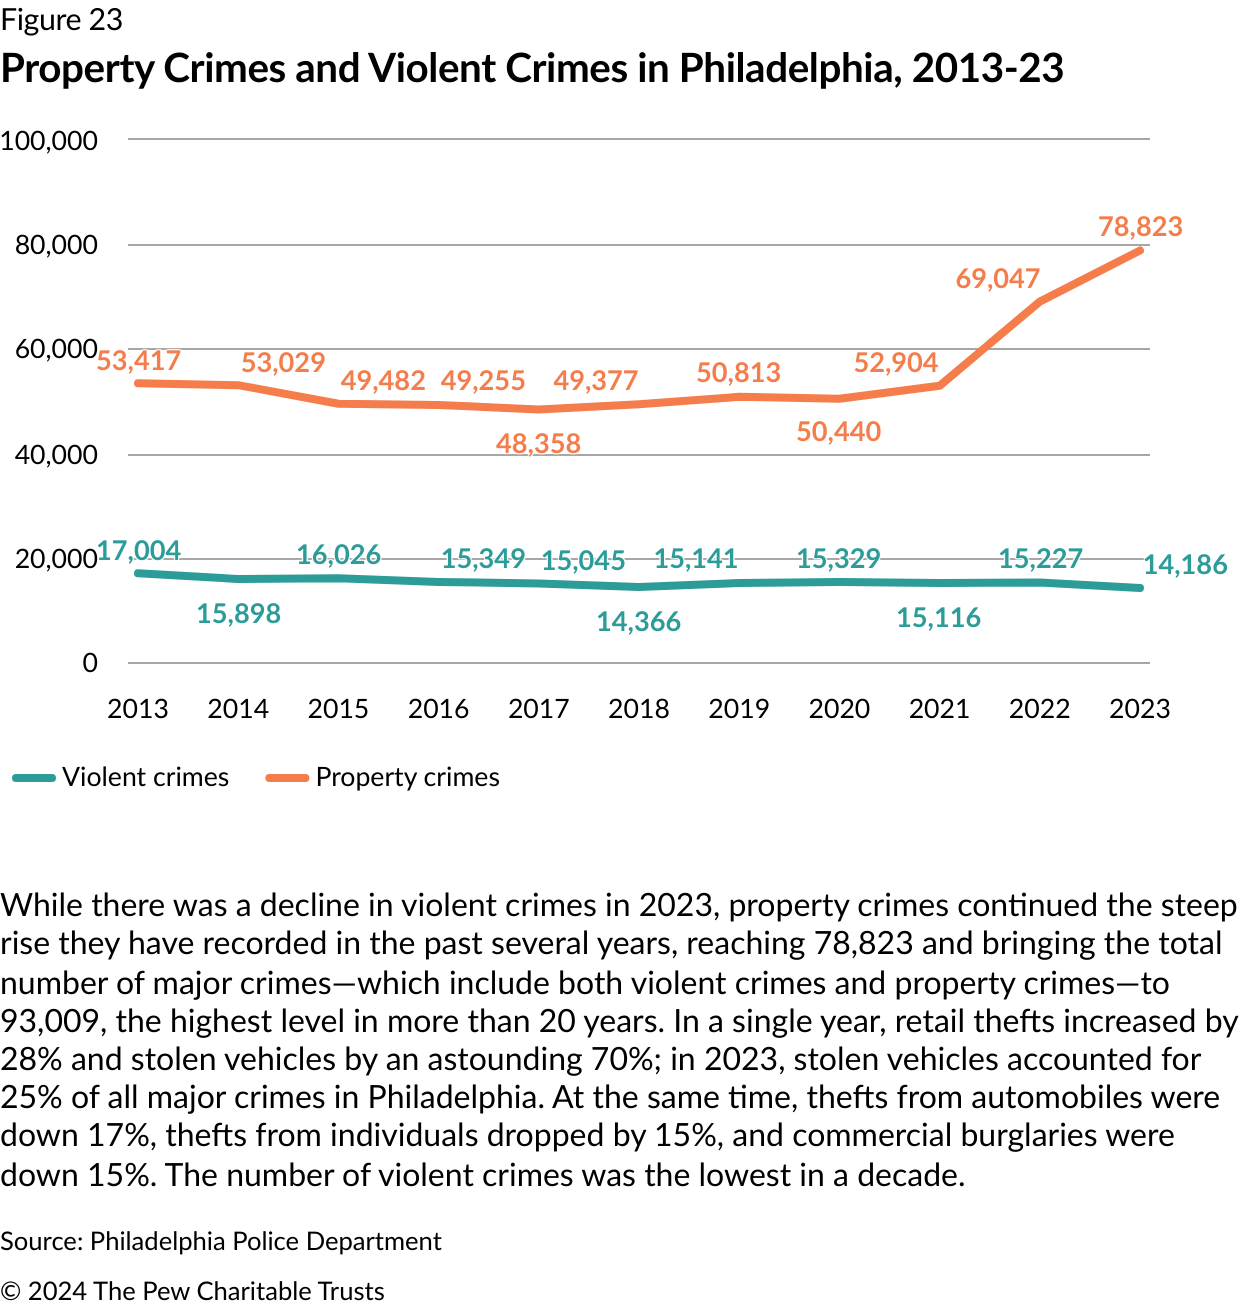
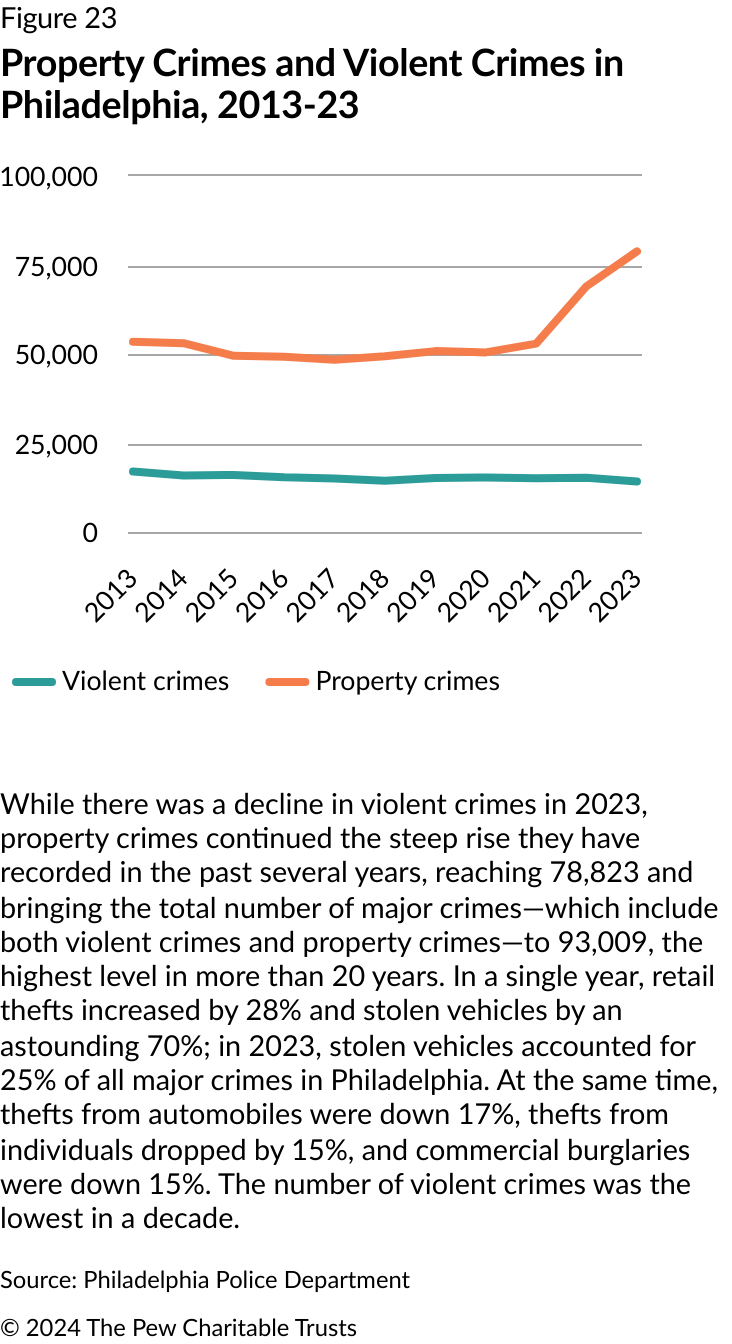
Public safety—which Mayor Parker made her top priority when taking office, declaring a public safety emergency on day one—is another major concern. Crime had already been on a multiyear climb before spiking during the pandemic; even though the overall level of violent crime in Philadelphia is the lowest it has been in more than 20 years, the number of homicides topped 500 in both 2021 and 2022. Although this total declined to 410 in 2023, the number was still high by historical standards, and property crimes kept rising as well. Car thefts increased 70% from 2022 to 2023, accounting for a quarter of all major crimes in Philadelphia. The high number of homicides and property crimes has soured Philadelphians’ and suburbanites’ attitudes about the city, making them less willing to go to the office (if they can work from home) or to visit cultural institutions or go out shopping.
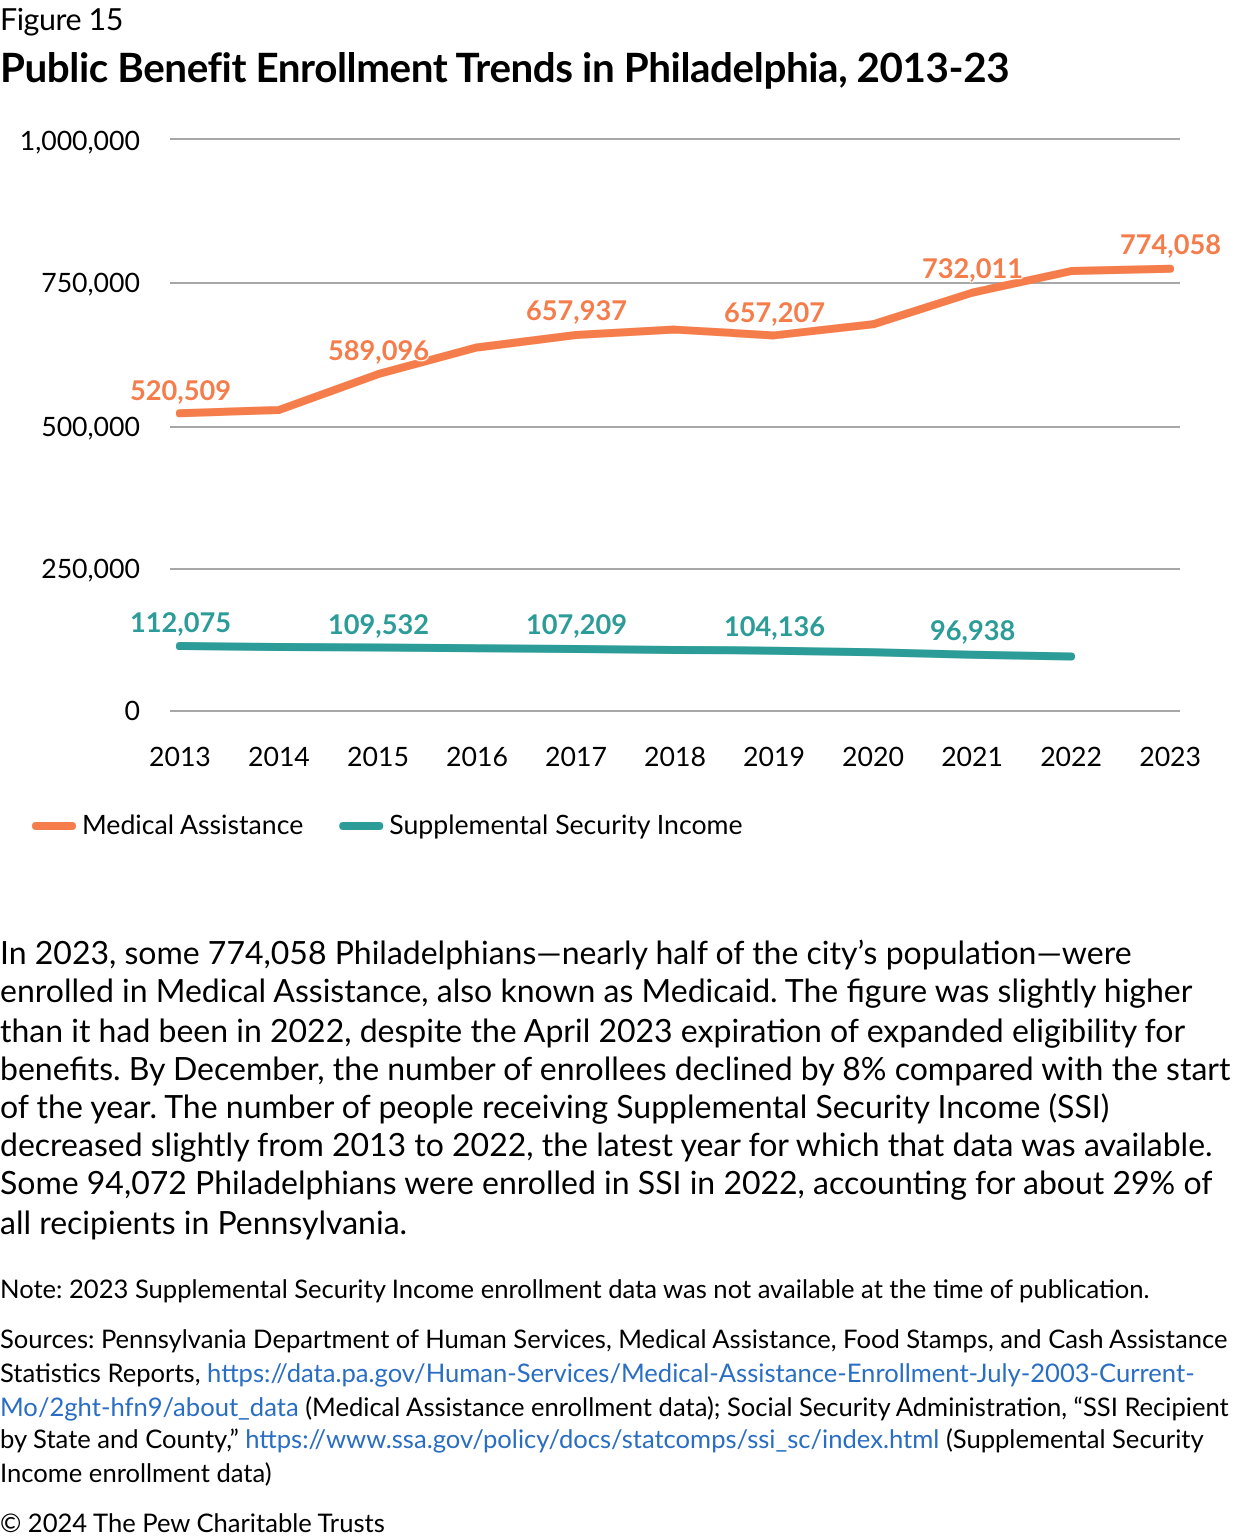
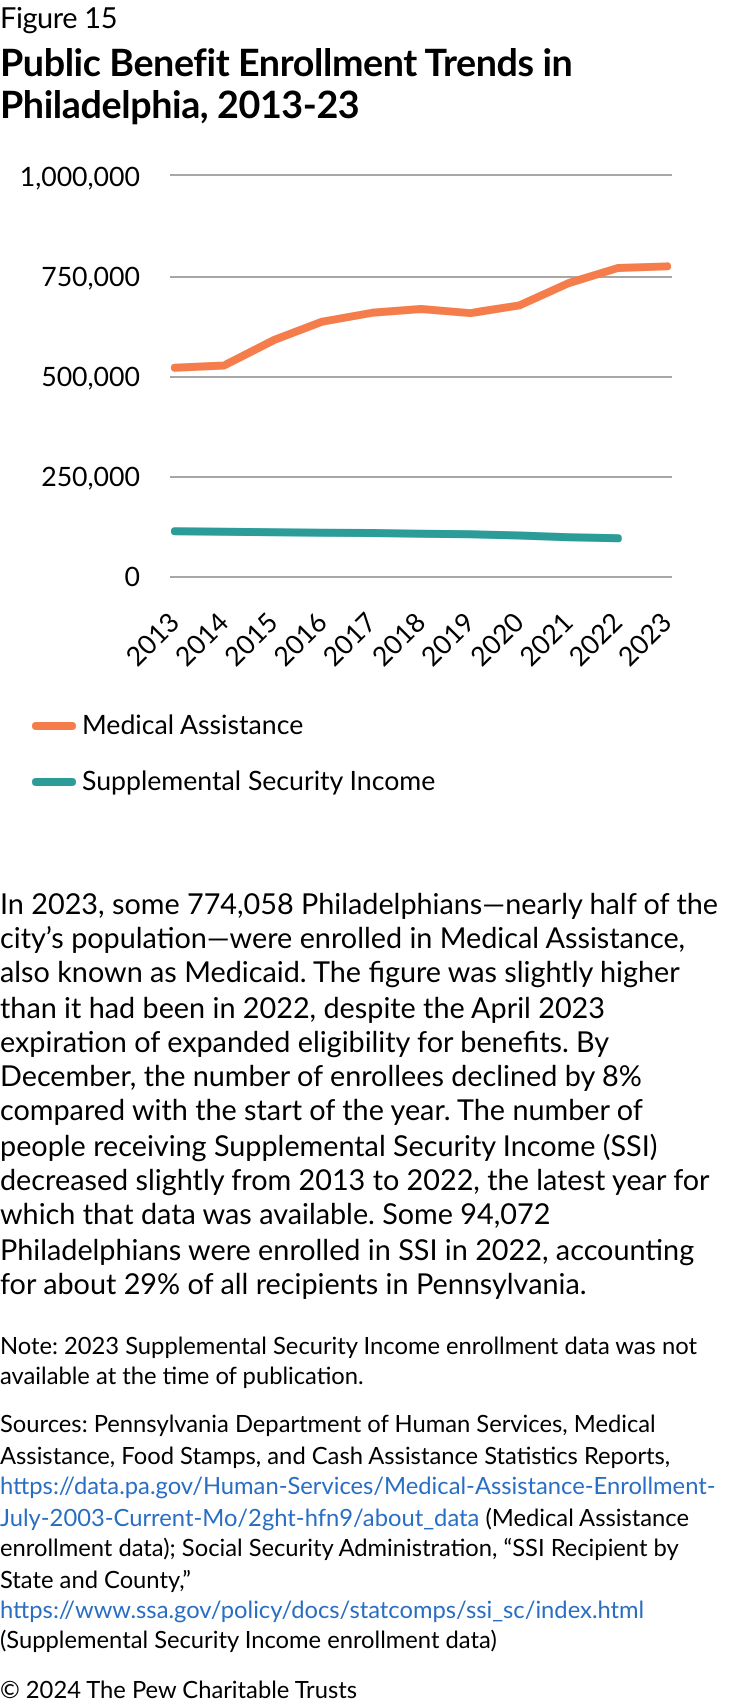
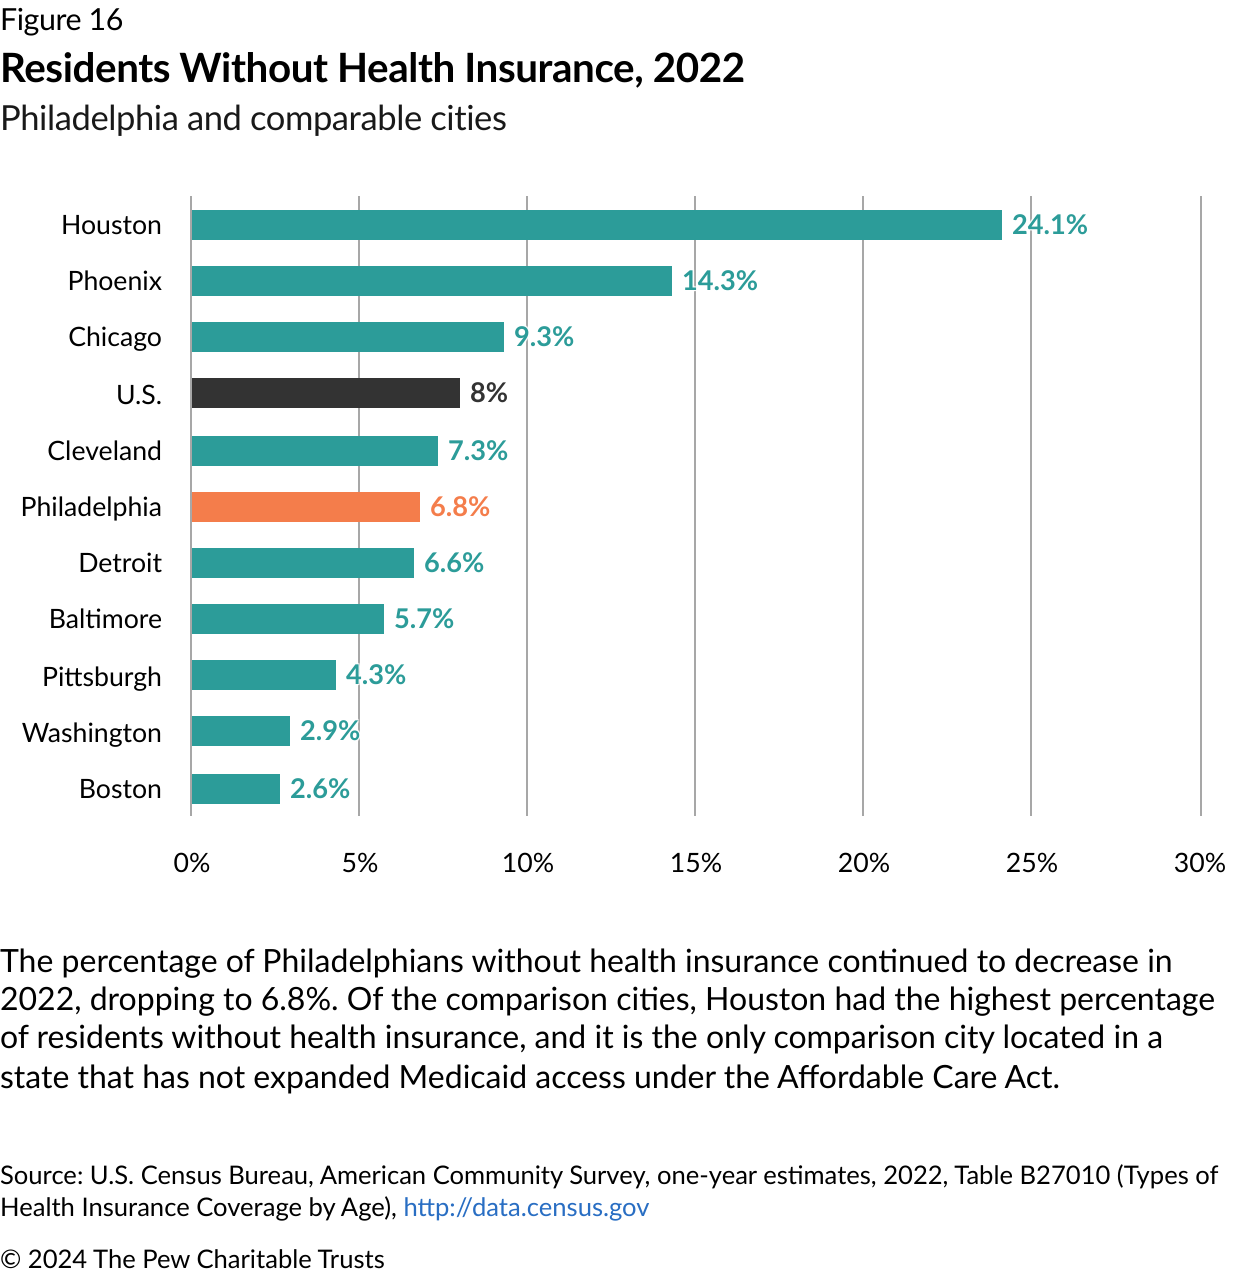
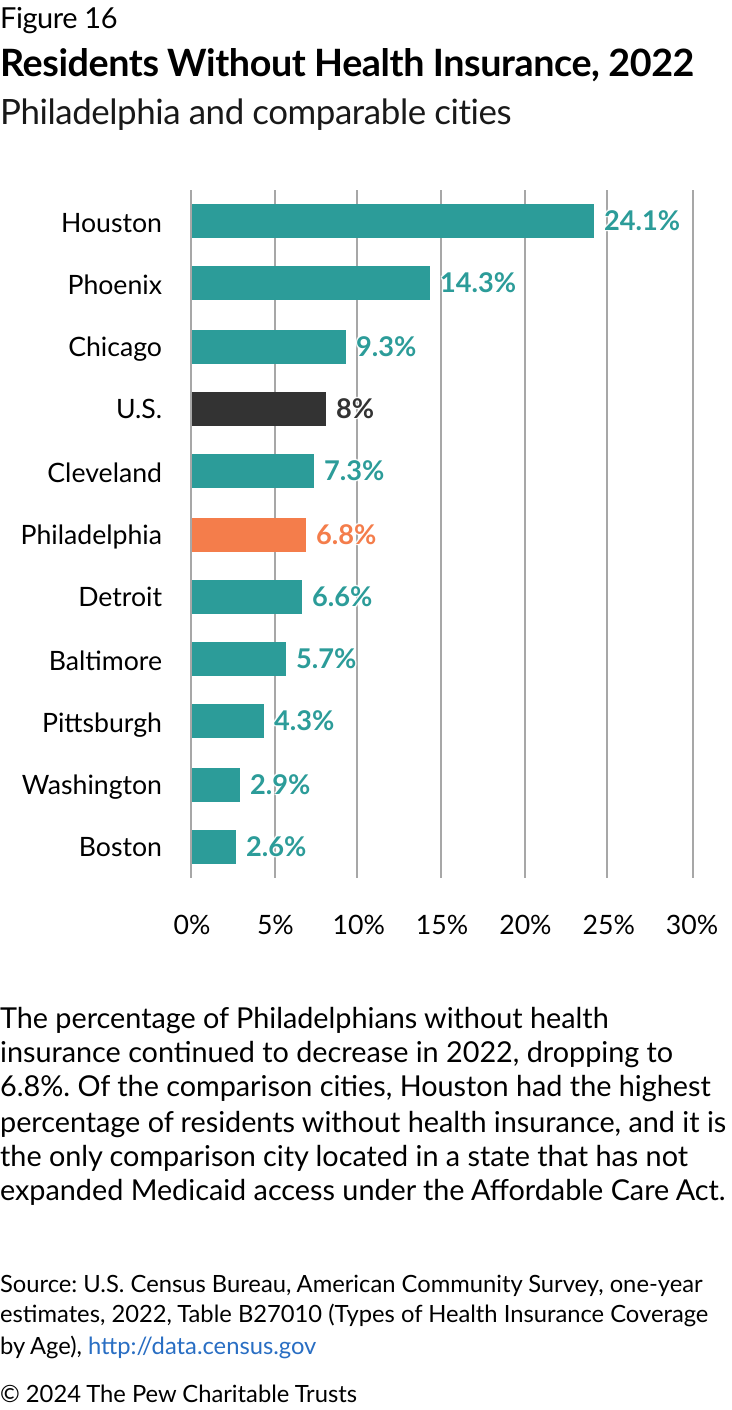
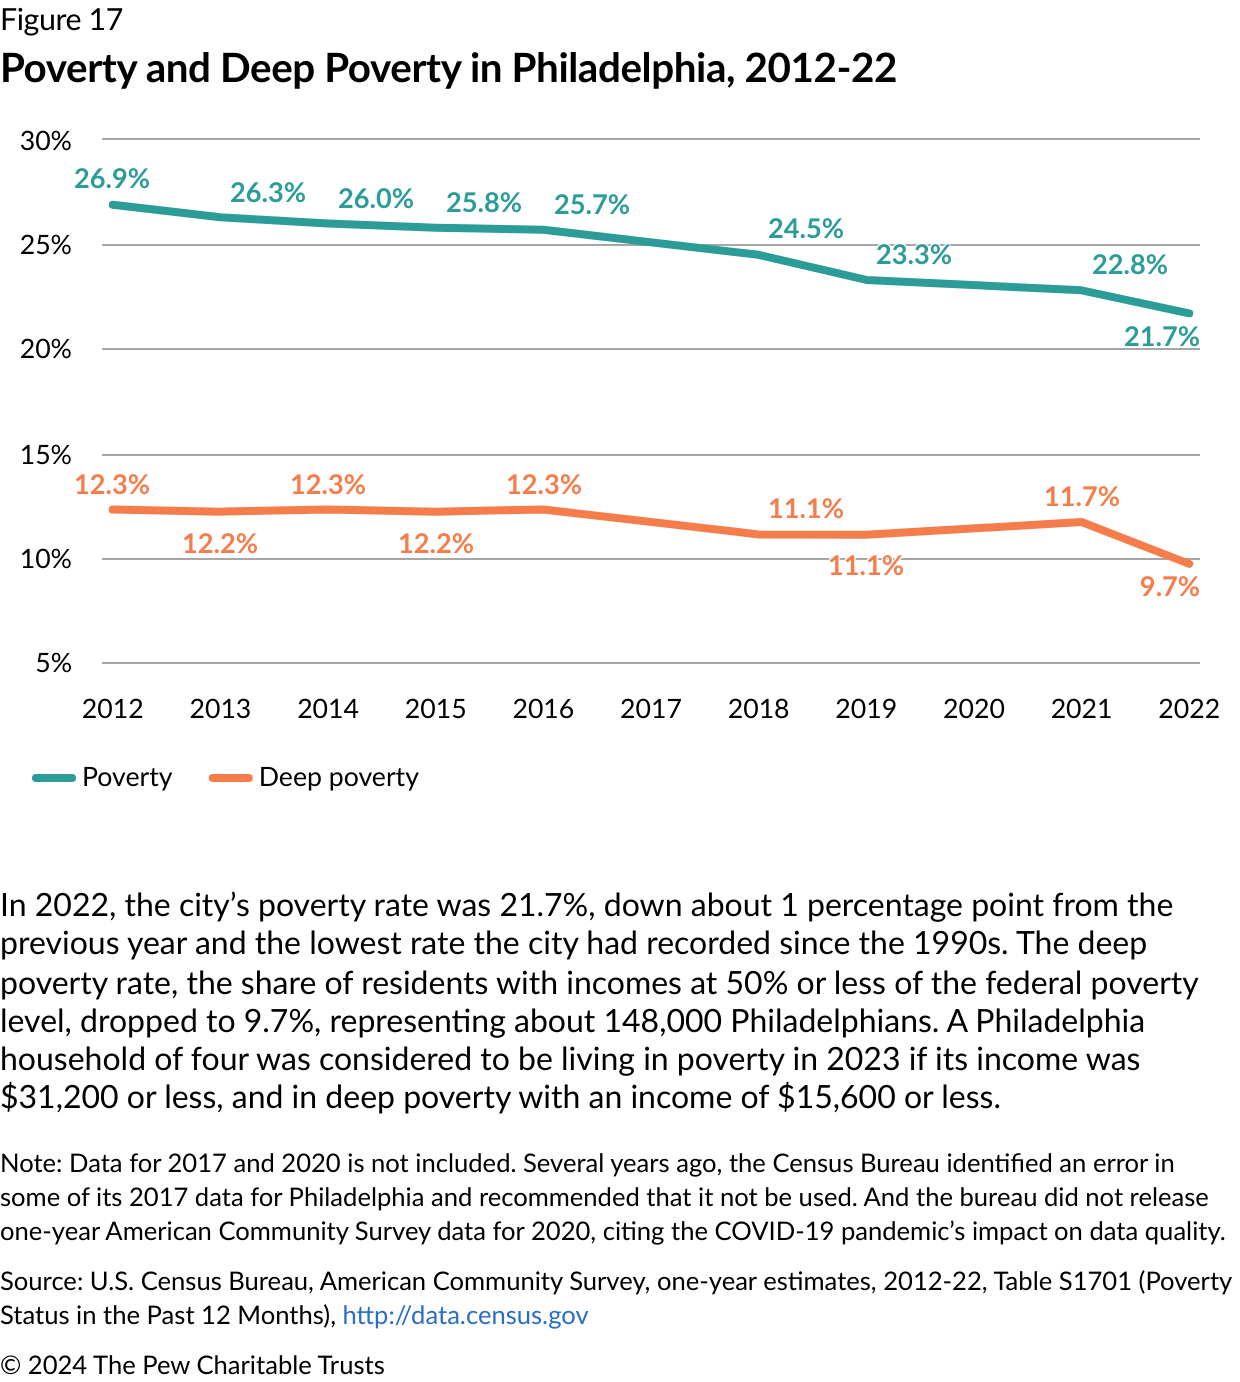
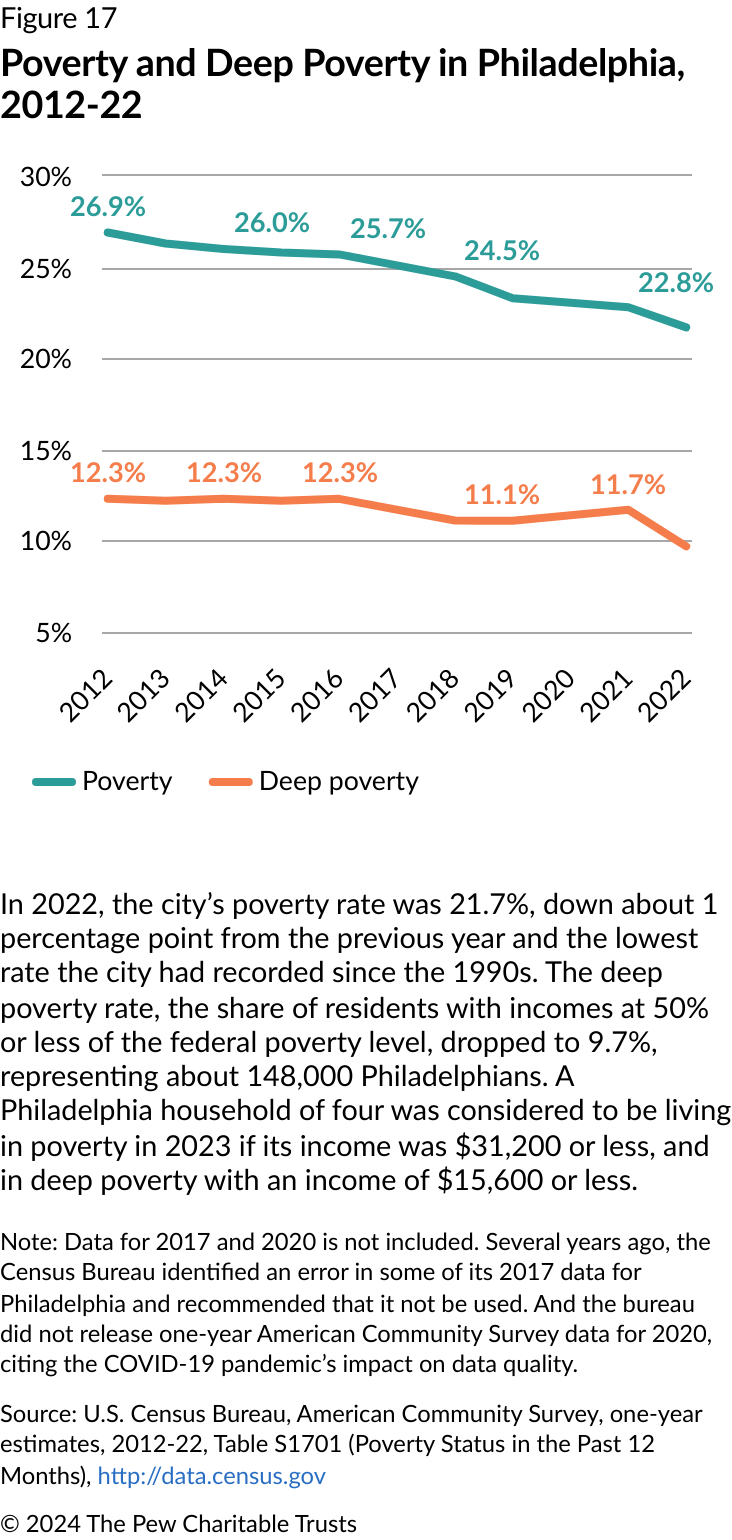
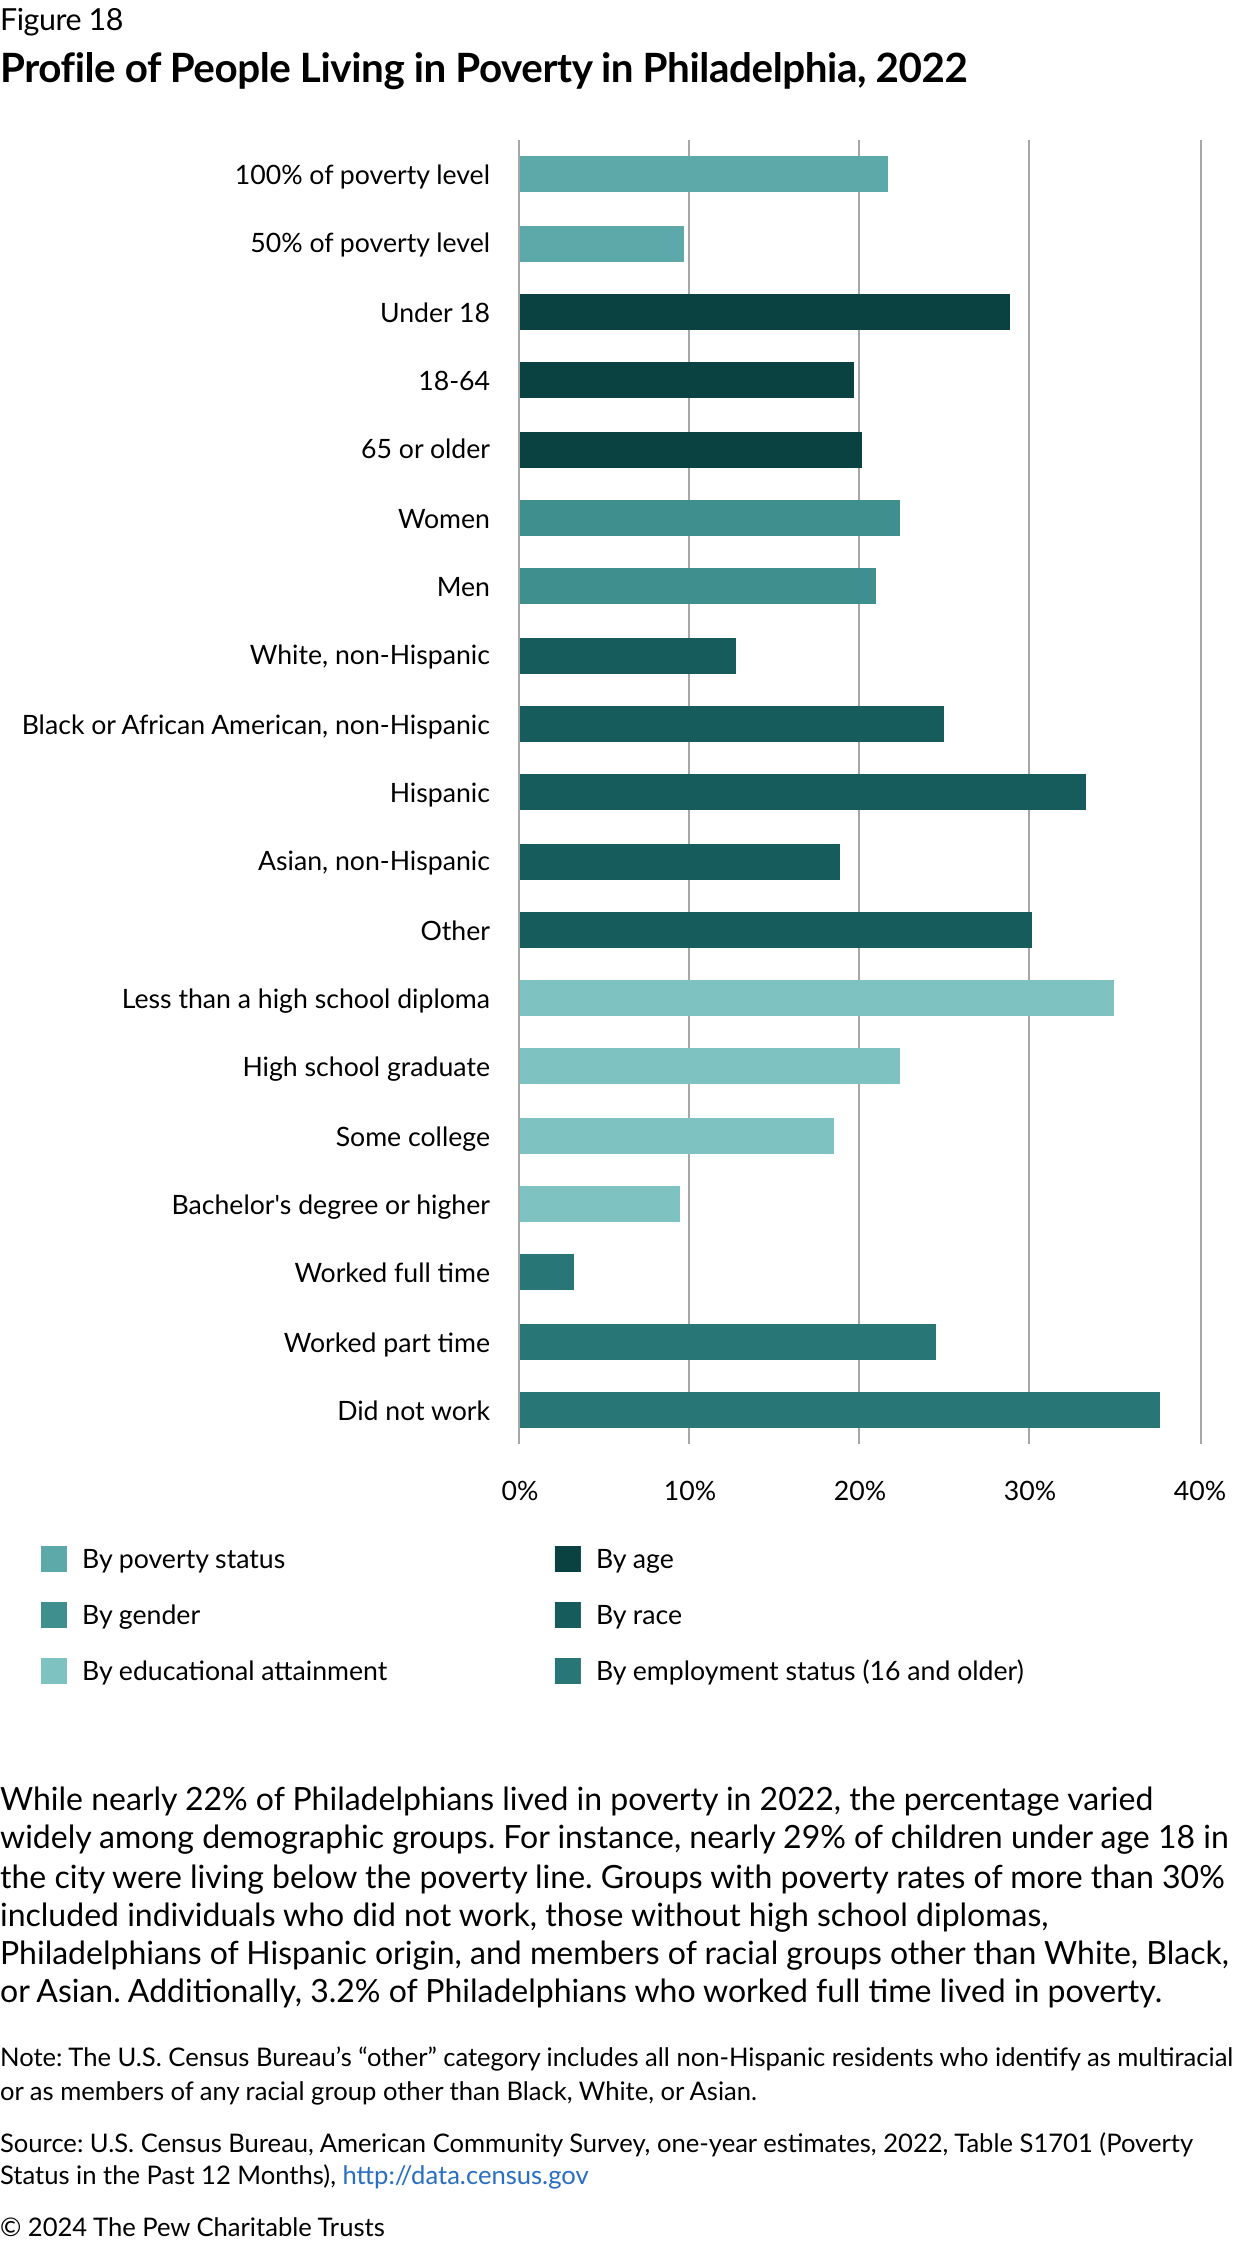
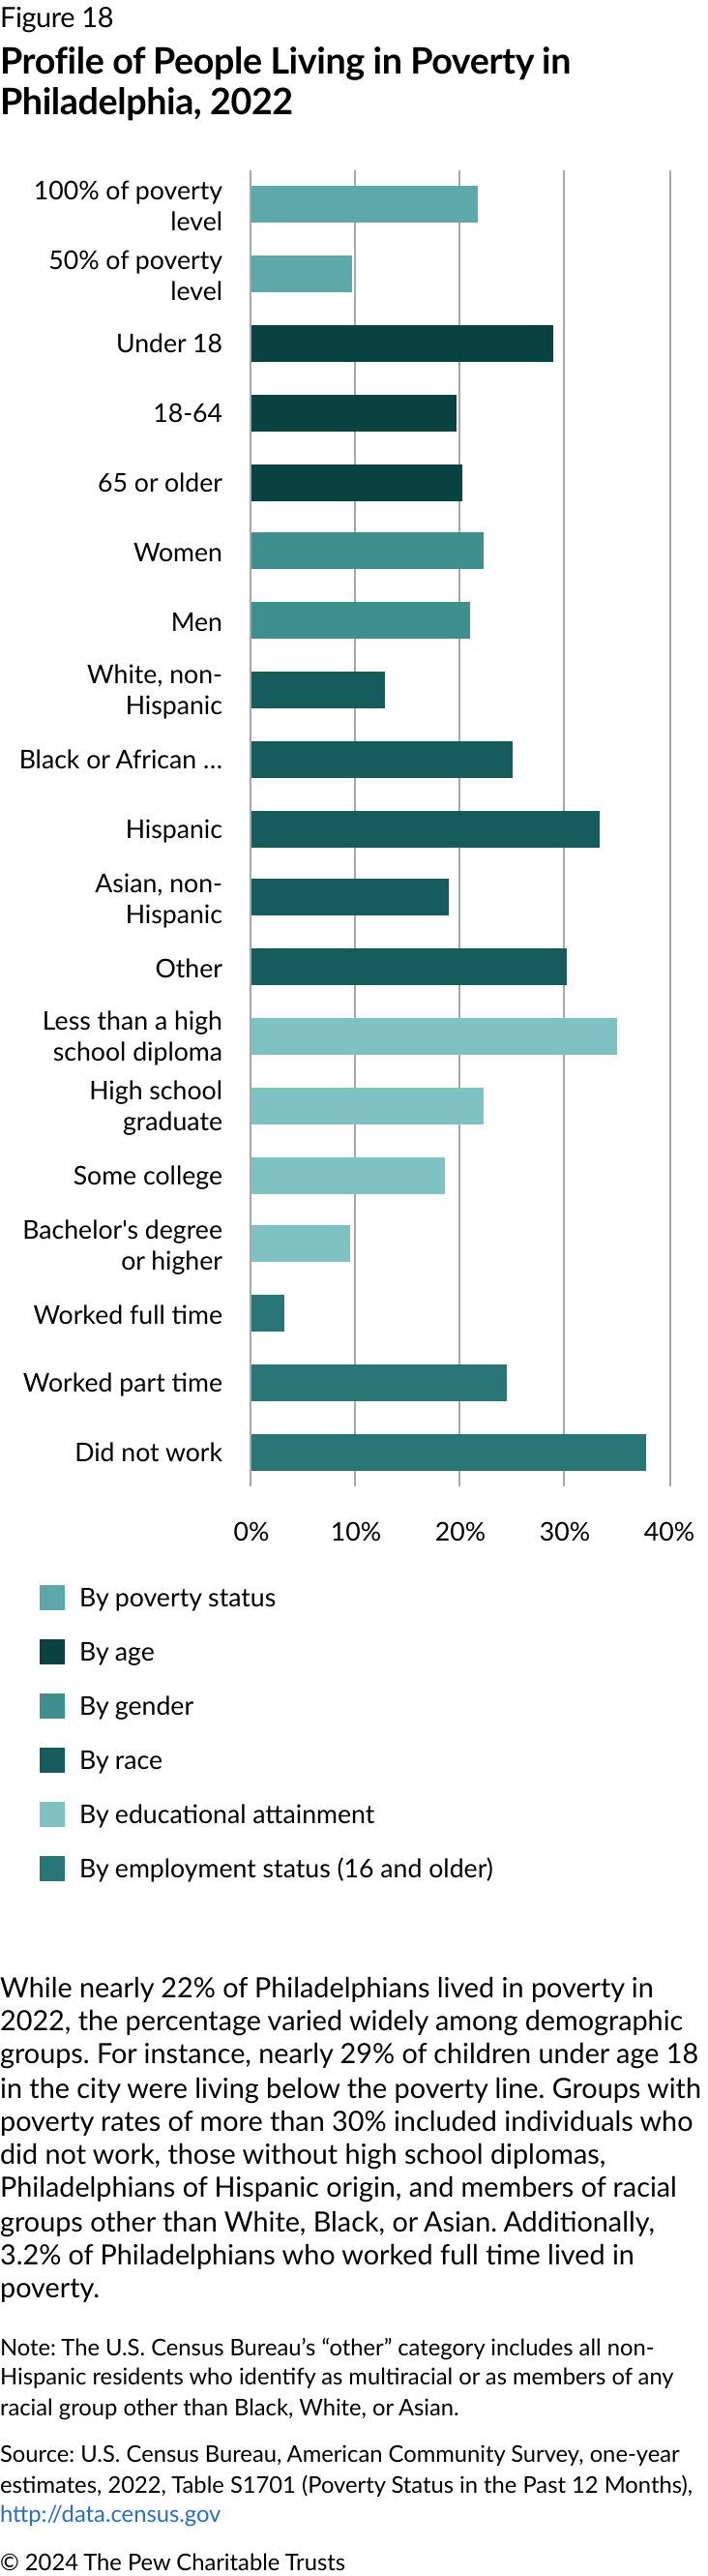
Philadelphia also continued to struggle with high poverty, although its poverty rate declined to 21.7%, its lowest level in more than 20 years, thanks in part to some federal assistance programs that emerged from the pandemic. Even with the overall rate down, 28.8% of children, 33.3% of Hispanic residents, and 35% of adults with less than a high school diploma were living in poverty in the city. Residents living in poverty continued to face significant obstacles to obtaining and maintaining employment, finding housing, and pursuing their education. They were also more likely to live in the communities most affected by violent crime. Moreover, many of them lost their health insurance when the pandemic-era guidance allowing automatic re-enrollment in Medicaid expired in April 2023.
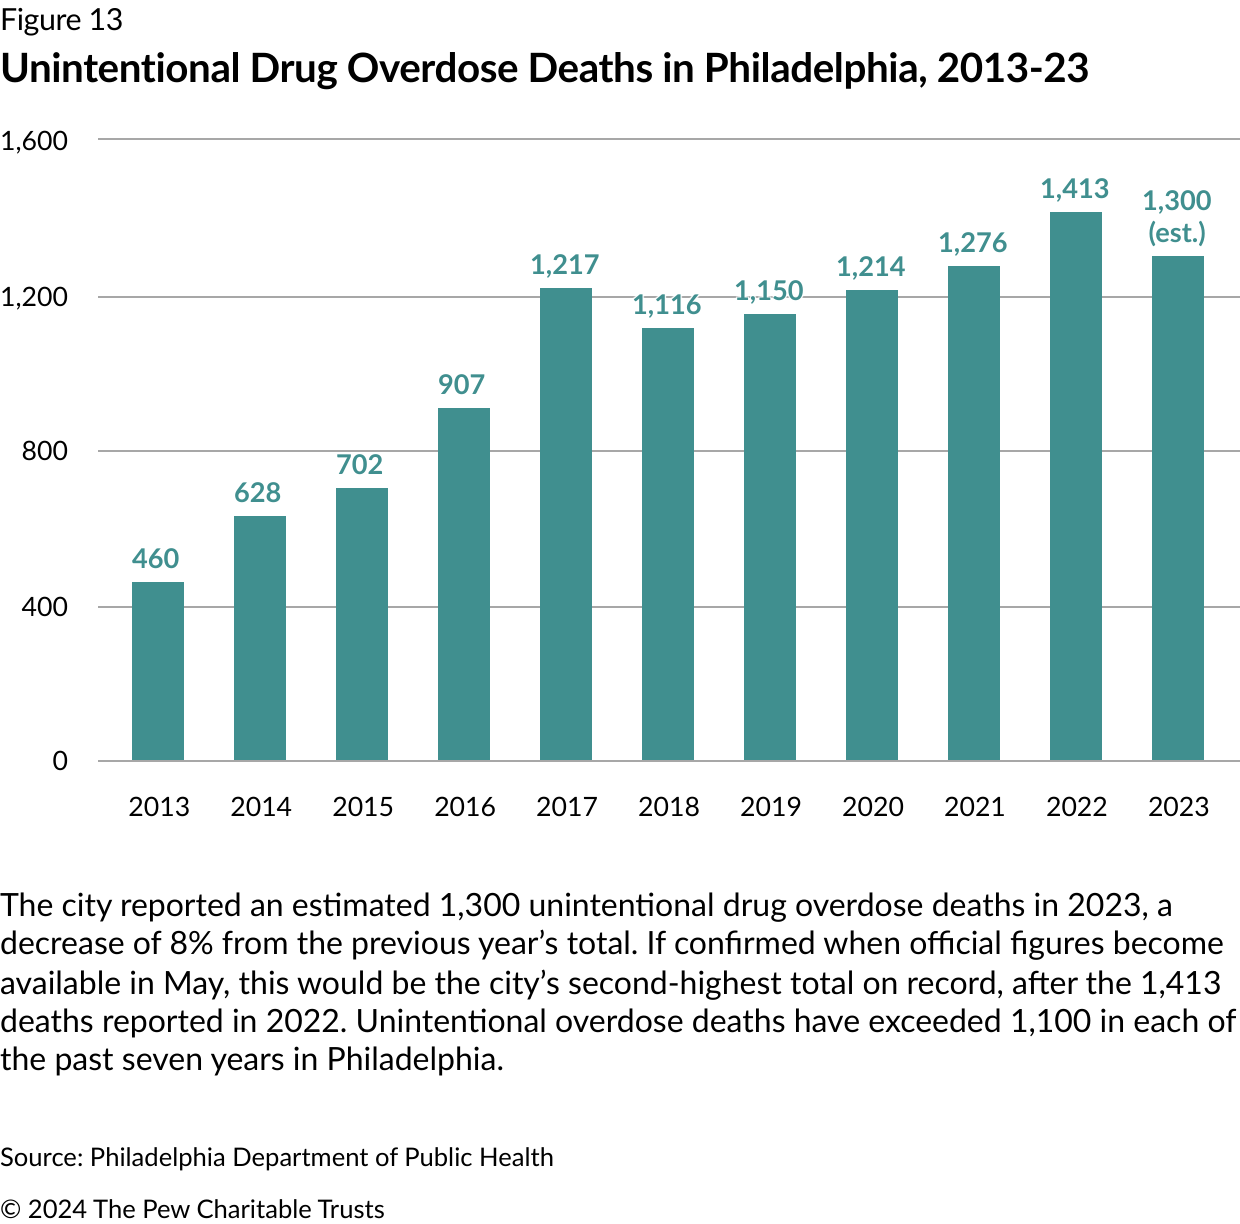
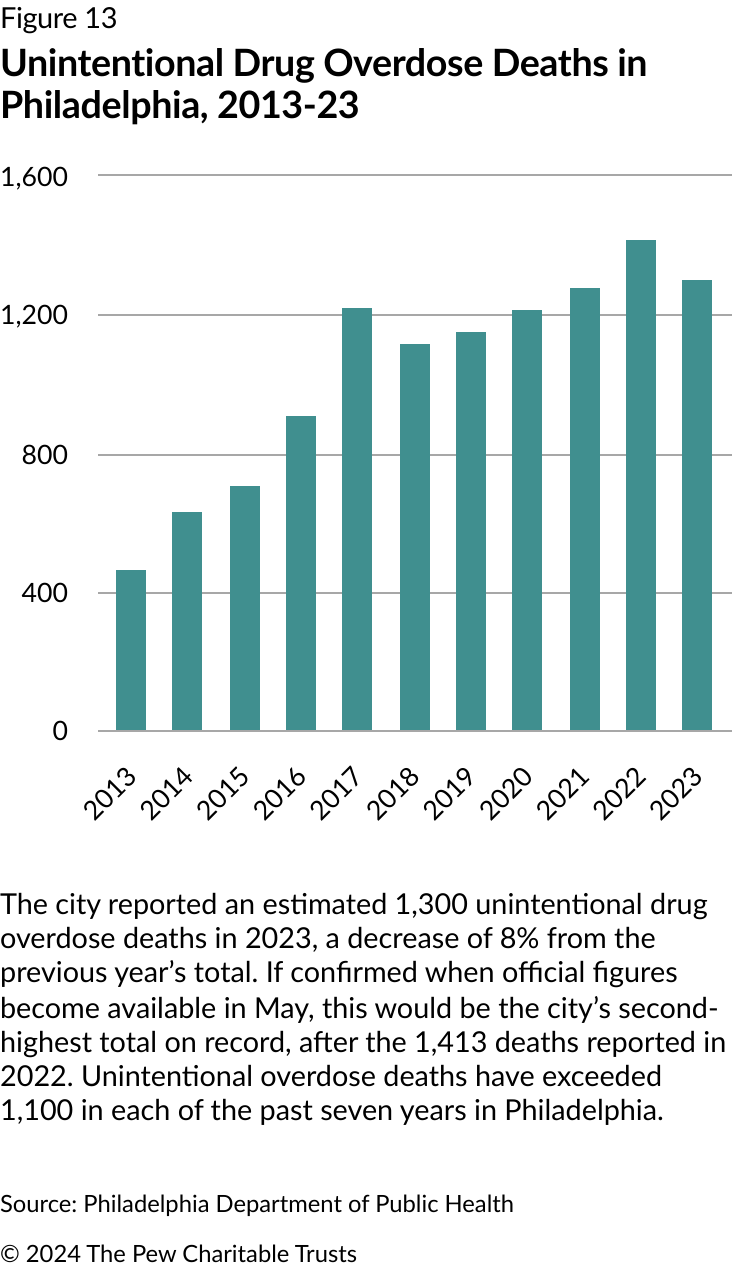
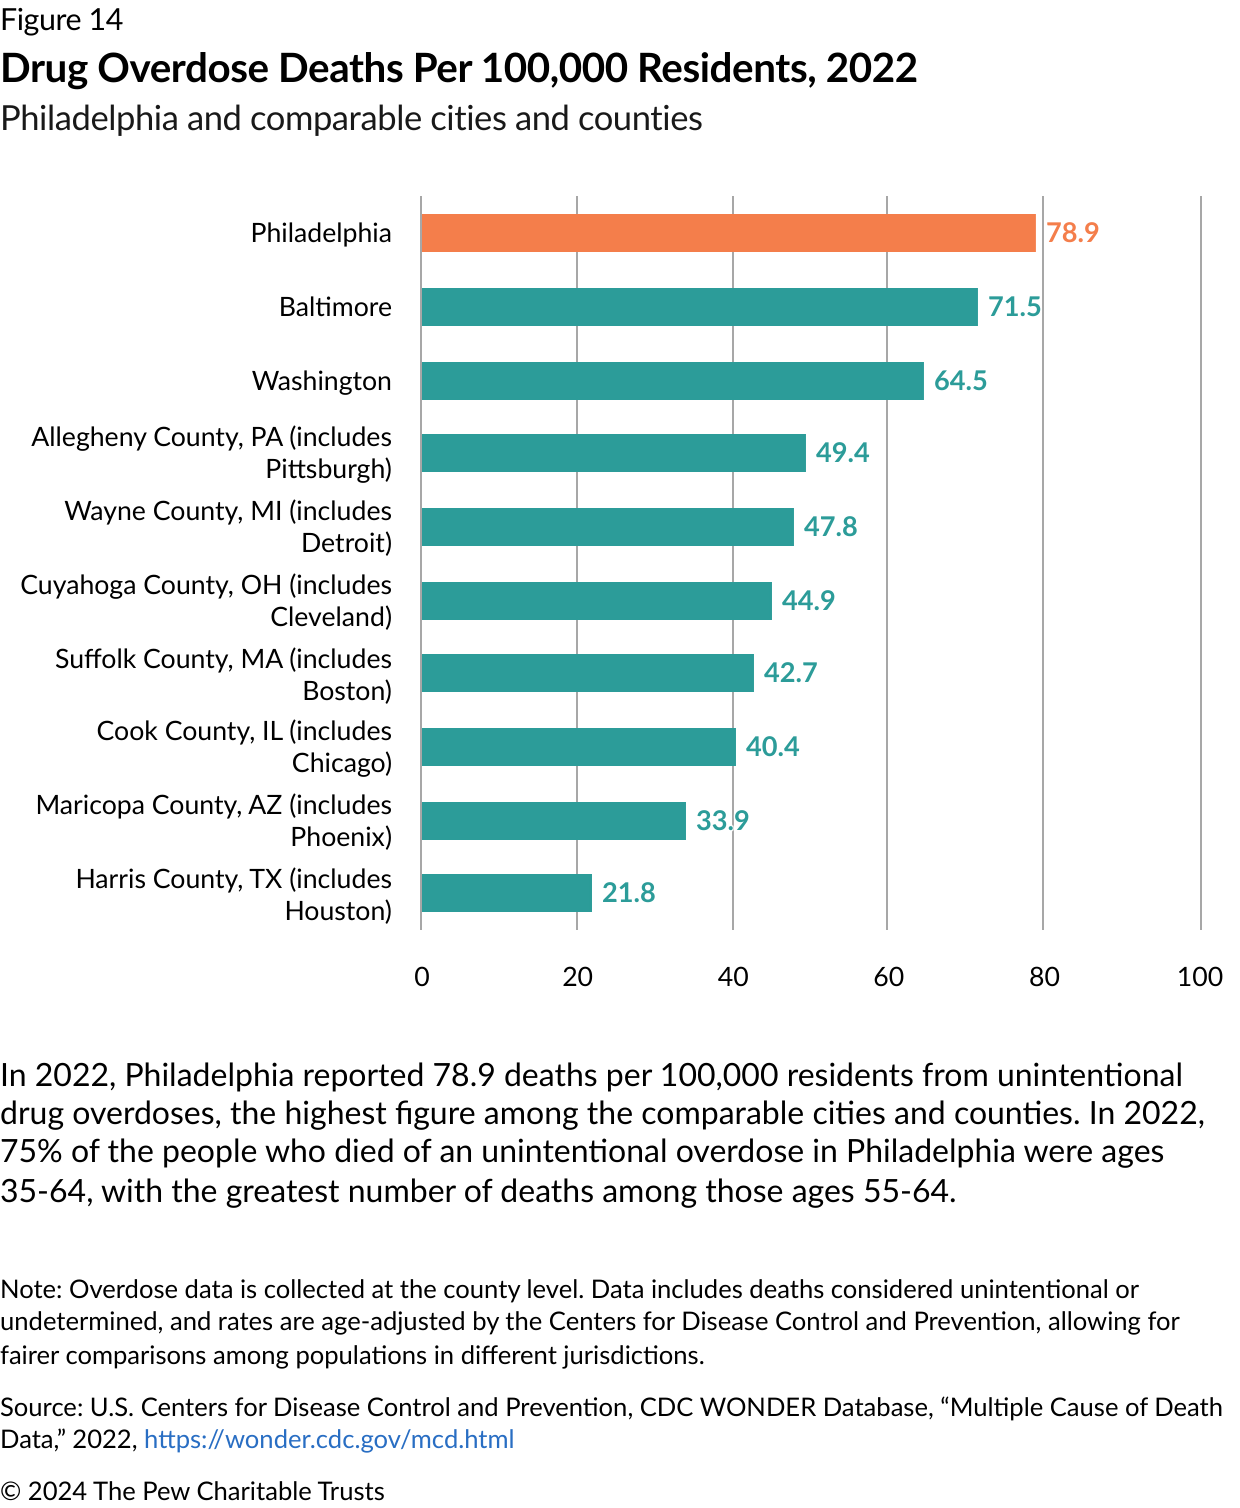
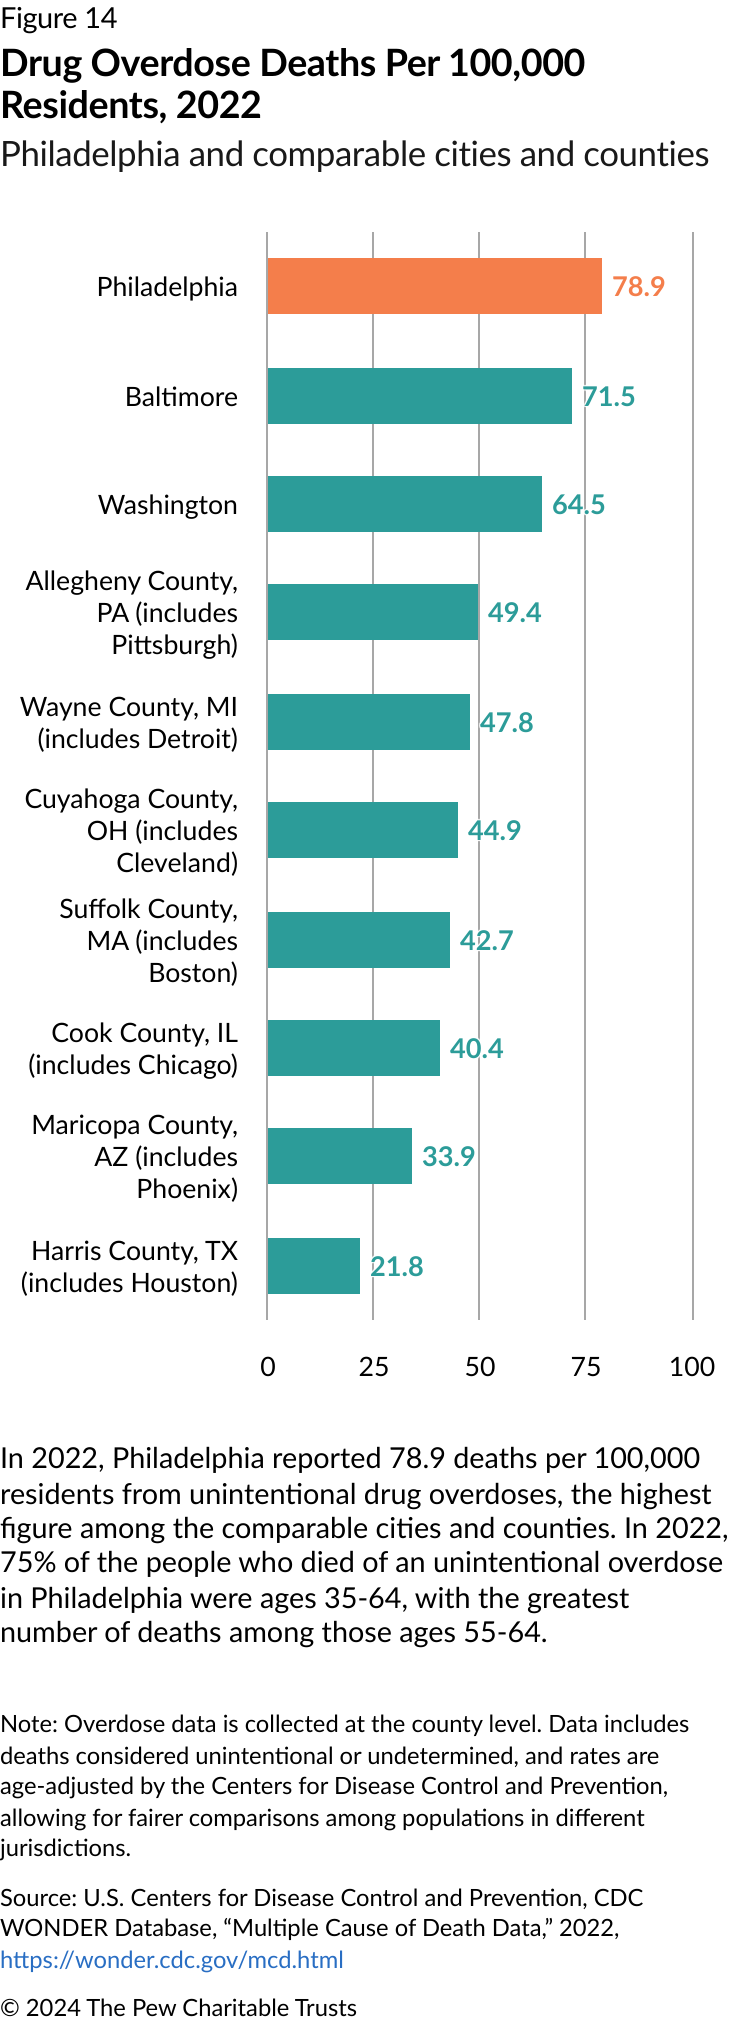
While there may be some glimmers of hope on crime and poverty, there was less promise regarding the city’s opioid epidemic, which continued to devastate communities. The city recorded an estimated 1,300 unintentional drug overdose deaths in 2023, the seventh straight year with more than 1,100 such deaths reported. Among the nine cities that The Pew Charitable Trusts has long used for comparison in its “State of the City” reports, Philadelphia had the highest rate of drug overdose deaths: 78.9 for every 100,000 residents. During her inauguration, Mayor Parker declared a focus on Kensington, the epicenter of the crisis, increasing enforcement of quality-of-life statutes and arrests of drug users and sellers. It remains to be seen how effective these efforts will be.
In this year of transition, the challenge is clear for Philadelphia and its new leaders: They must nurture and strengthen the positive trends while making progress on a set of deep-seated problems that can sometimes seem intractable. That mission won’t be easy. But its success is essential for the future of the city and its people.
Vacant Land or Buildings in Philadelphia by ZIP Code, 2024
A map of Philadelphia using four shades of green shows the percentage of vacant properties, land, or buildings by ZIP code, with the ZIP codes labeled and ZIP code boundaries outlined in white. In the areas with the lightest shades, less than 5% of parcels are vacant. The second-lightest shade represents areas with 5% to 15% of parcels vacant, the third-lightest shade more than 15% to 25%, and the darkest shade over 25%. The map shows that the 19121, 19132, and 19133 ZIP codes in North Philadelphia have the highest concentration of vacancies, while less than 5% of parcels in Center City, Northeast, Northwest, and South Philadelphia are vacant.
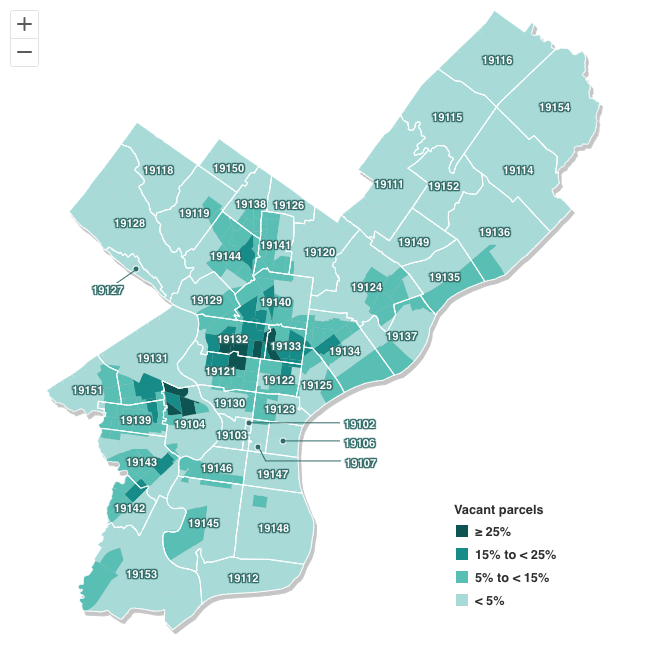
The city of Philadelphia tracks vacancy of both land and buildings by measuring administrative and geographic data such as code violations or water use in order to better understand where parcels are either temporarily unused or vacant over a long period of time. As of this year, approximately 5% of parcels in Philadelphia sit vacant. But the distribution varies dramatically by neighborhood. Parts of North and West Philadelphia have the highest concentration of vacancies, and sections of Center City, the far Northeast, South, and Northwest Philadelphia have the lowest share.
Note: The city of Philadelphia created an aggregated vacancy indicator by combining information from the Department of Licenses and Inspections, Office of Property Assessment, Philadelphia Land Bank, and Philadelphia Water Department. The indicator models land and building vacancy status by 20 different indicators. Parcels that meet at least eight of these criteria are considered vacant.
Source: City of Philadelphia, OpenDataPhilly, January 2024, https://metadata.phila.gov/#home
© 2024 The Pew Charitable Trusts View image View image
Commuting To and From Philadelphia for Work, 2021
A map of Philadelphia and the surrounding counties of Bucks, Burlington, Camden, Chester, Delaware, Gloucester, Montgomery, and New Castle. Each county has two numbers, one on top of the other. The top number represents commuters from Philadelphia; the bottom represents commuters to Philadelphia. Montgomery County accounts for 47% of Philadelphians commuting into neighboring counties, and it accounts for 27% of commuters from neighboring counties coming into the city.
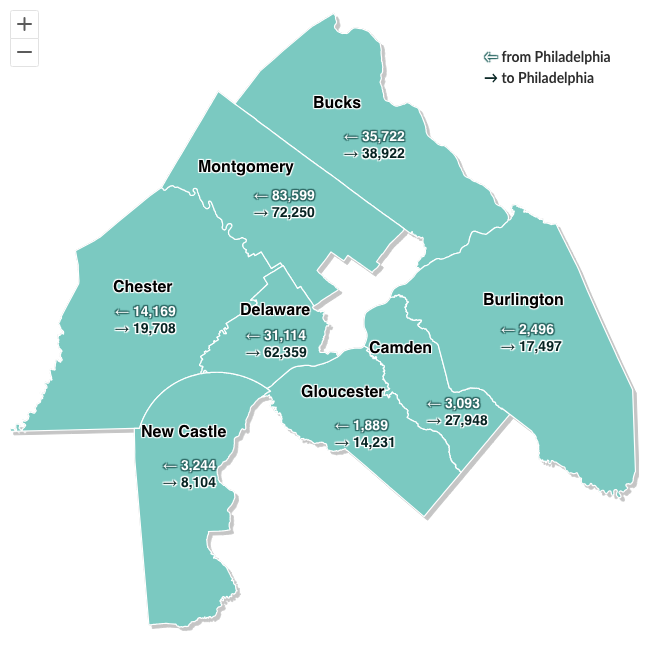
This figure indicates the average number of people commuting to and from Philadelphia daily for work. Montgomery County, which has a long border with the city, had the greatest number of commuters traveling both to the city (72,250) and from the city (83,599)—accounting for nearly half of all Philadelphians going to the suburbs for work and more than a quarter of suburbanites heading to the city. More than a third of working Philadelphians commute to jobs in the suburbs, primarily in Montgomery, Bucks, and Delaware counties.
Note: The 2021 commuting data is the most recent available.
Source: U.S. Census Bureau, 2021, Longitudinal Employer-Household Dynamics Origin-Destination Employment Statistics, https://lehd.ces.census.gov/data/
© 2024 The Pew Charitable Trusts View image View image


Philadelphia 2025: The State of The City

Philadelphia 2023: State of the City


10 Ways Philadelphia Has Changed in 75 Years


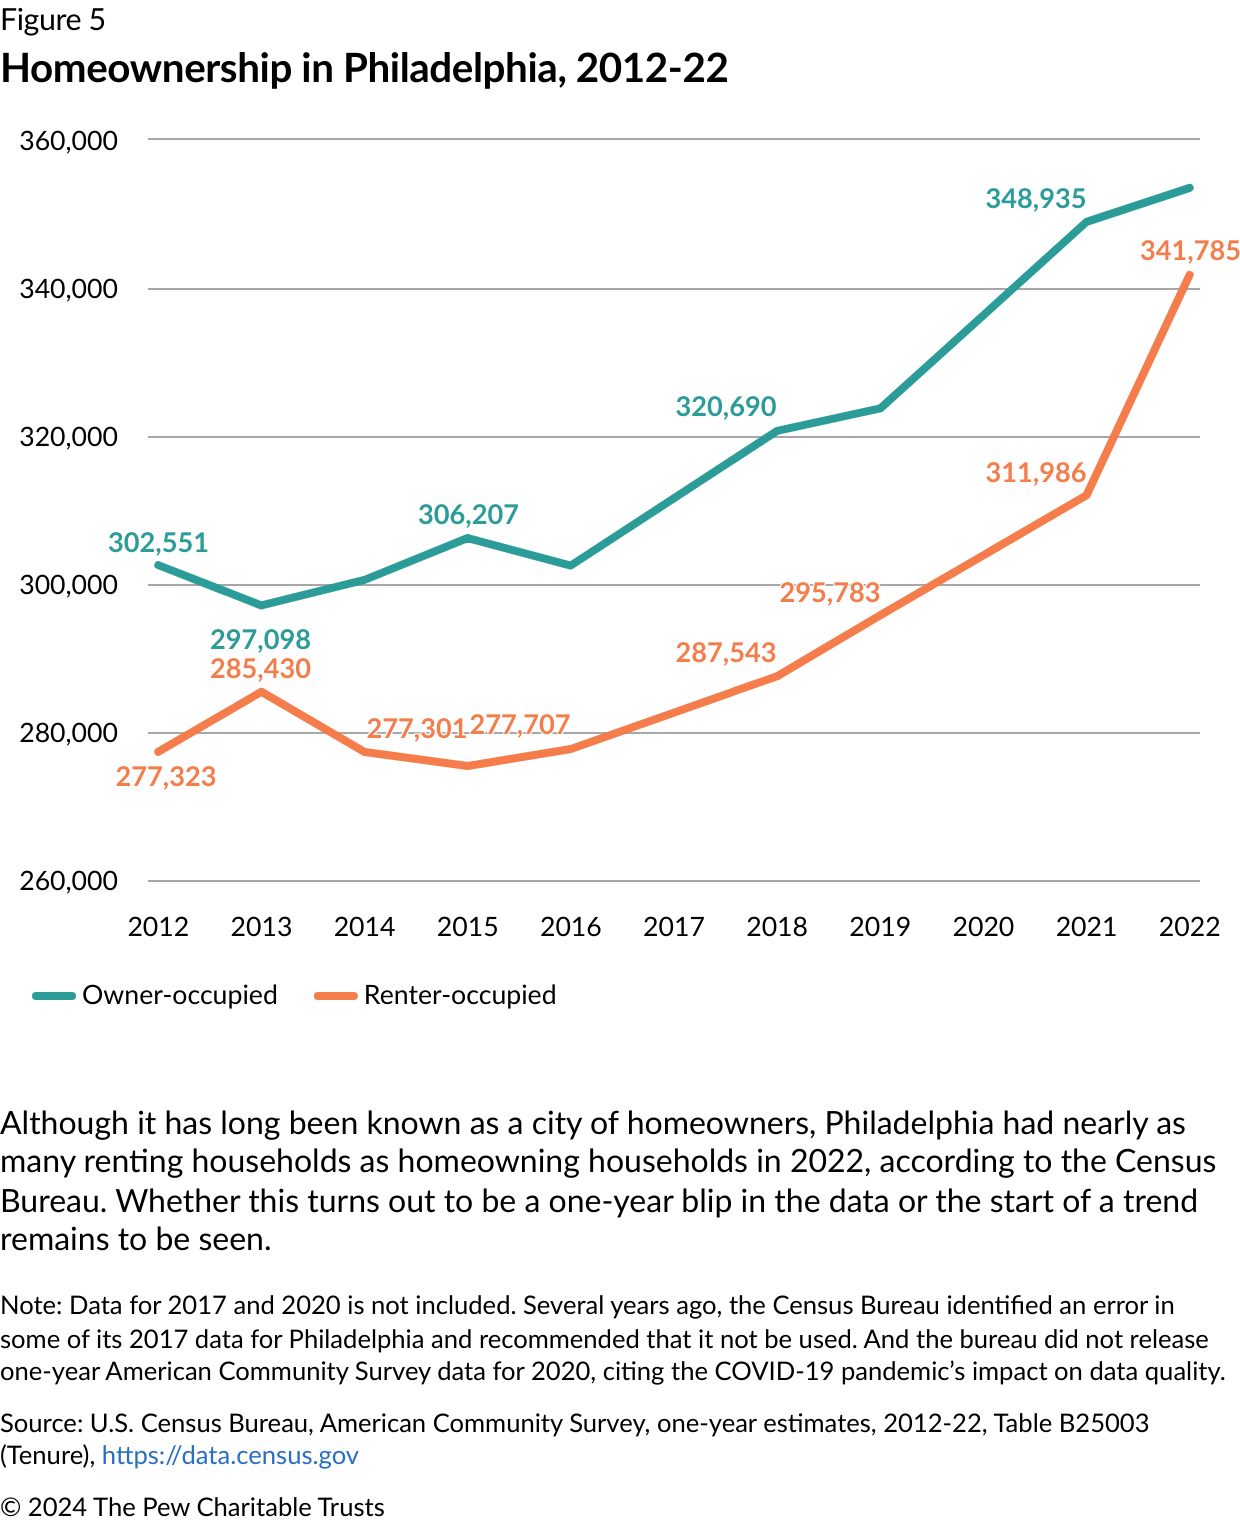
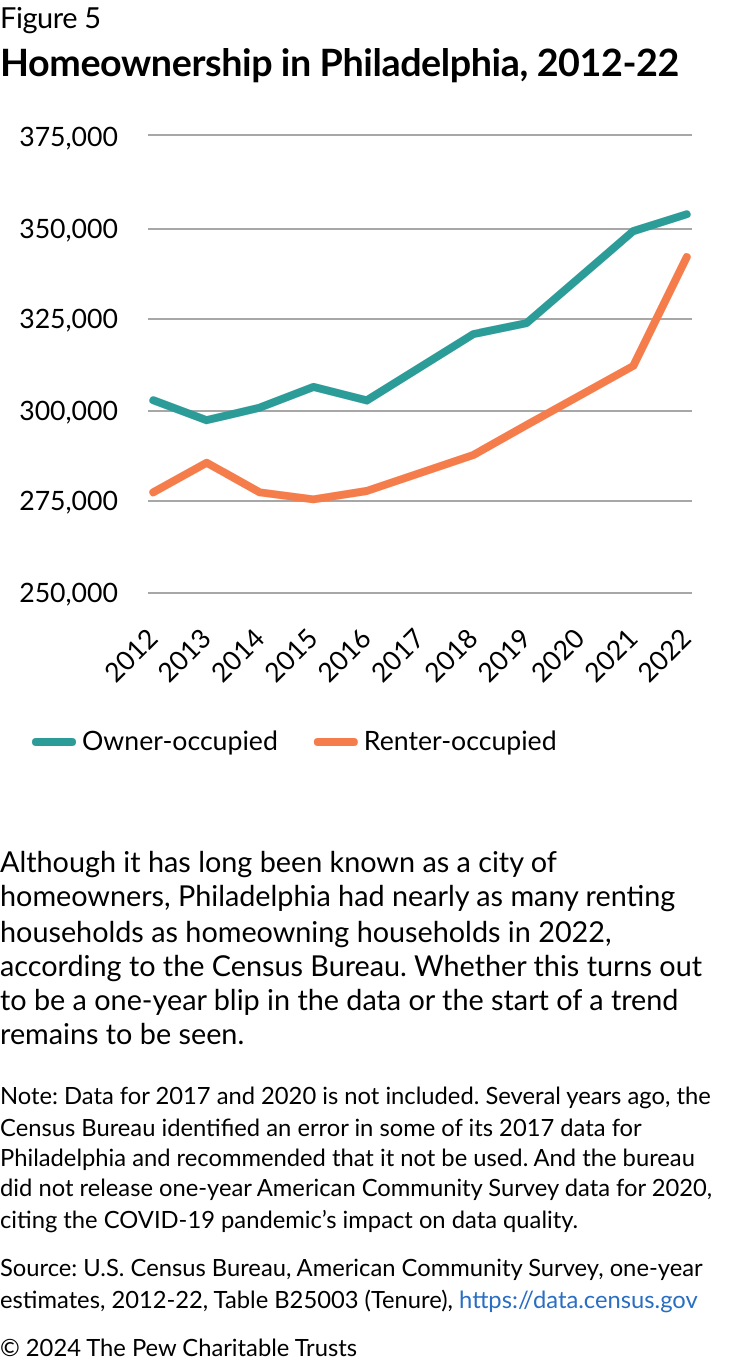
Renters Are Cost-Burdened in Philadelphia Neighborhoods
ADDITIONAL RESOURCES

Article


