States Should Measure Opioid Use Disorder Treatment to Improve Outcomes
Information on diagnosis, treatment, and recovery can boost care and save lives

Overview
The most effective treatments for opioid use disorder (OUD) are medications: methadone, buprenorphine, and naltrexone.1 However, there are substantial gaps between the number of people who need these medications and those who receive them,2 and the United States continues to experience a devastating number of lives lost to the opioid epidemic.
To close these gaps, improve treatment overall, and save lives, states need a set of core metrics to track relevant data and provide a comprehensive picture of care for OUD—from diagnosis through recovery. Such metrics would allow policymakers to measure successes, identify areas for improvement, and take appropriate actions.
At present, many states have dashboards that track overdose deaths. But far too few track a full range of metrics, including how many people are diagnosed with OUD, the number of providers available to treat them, use of FDA-approved medications, or treatment retention and outcomes. In fact, just a third of states publicly report any type of metric related to OUD treatment.3
Faced with a lack of consensus among state health officials and policymakers on which metrics should be used to assess care for OUD, The Pew Charitable Trusts convened an expert panel in September 2021 comprising state and federal officials, people with lived experience, advocates, treatment providers, and experts in health measurement and analytics. (See Appendix for a full list of panelists.) The panel worked to identify core OUD treatment measures using a method known as the “cascade of care,” which examines key measurements in the life cycle of a chronic disease, cascading from the initial diagnosis to the final outcome.
This method has been applied successfully worldwide to manage hepatitis C, HIV, diabetes, and other chronic diseases. In the United Kingdom, for example, health authorities adopted the United Nations Joint Programme on HIV/AIDS’ goals of increasing the rates of each stage of the HIV care cascade (diagnosis, initiation of treatment, and viral suppression) to 90%.4 They reached these goals in 2017 and, based on this success, set a new goal of zero HIV transmission by 2030.5
Pew’s expert panel agreed on the following core measures for tracking opioid use disorder. The measures cascade from the initial diagnosis of OUD through treatment, retention in treatment, and recovery, and are explained in detail in this brief.
- OUD diagnosis: Percentage of people who had a documented OUD diagnosis (e.g., on an insurance claim).
- Percentage of people assessed using a standardized screening tool: Rate of assessment using a tool such as the Drug Abuse Screening Test (DAST) or the Tobacco, Alcohol, Prescription Medication, and Other Substance Use (TAPS) tool.
- Use of pharmacotherapy for OUD: Percentage of people diagnosed with an OUD who received medication to treat it.
- OUD provider availability: Number of providers and treatment programs that can provide medication for opioid use disorder (MOUD).
- Continuity of pharmacotherapy for OUD: Percentage of people receiving MOUD who use it for at least six months.
- Initiation of OUD treatment and engagement in OUD treatment: Percentage of people who initiate treatment within two weeks of diagnosis; percentage of people with two or more services within the first month after initiating treatment.
- Follow-up after an emergency department visit for substance use: Percentage of people who receive follow-up care for substance use disorder or an overdose within seven days, and 30 days after visiting an emergency department for a substance use disorder (SUD)-related issue.
- One or more patient-reported outcome measures to be determined by each state: Percentage of individuals who achieve an improved level of functioning or quality of life.
The panel recommended that all states implement these core measures to give state health departments, Medicaid directors, policymakers, and other stakeholders better information in order to improve practices and target scarce resources where they will do the most good—whether that means increased screening, increased access to proven medications, improved transitions of care from the hospital to the community, or other data-driven interventions.
Further, Pew recommends that states develop action plans to review the data, make it public, and adjust policies over time. Specifically, states should:
- Create a data-use plan that includes:
- Reporting data publicly to create accountability on the effectiveness of the state’s efforts to address the opioid crisis.
- Reviewing and acting on the data regularly.
- Working with people with OUD and treatment providers to understand the numbers and develop quality improvement initiatives.
- Disaggregate the data by race/ethnicity, age, gender, and other demographic categories to uncover and address health inequities.
Applying the Cascade of Care to OUD
The cascade of care model was first developed to assess the HIV epidemic and has since been successfully applied worldwide to improve the treatment of chronic diseases such as hepatitis C, hepatitis B, diabetes, and tuberculosis.6
In 2017, researchers funded by the National Institute on Drug Abuse (NIDA) made a general recommendation that the cascade of care framework be applied to the opioid epidemic.7 Several states, localities, and Tribal nations have since used the method to establish metrics for their individual programs, but no nationwide consensus on the appropriate set of measurements emerged.8
To formulate its recommendations, Pew’s panel applied the framework and defined the stages of the cascade as follows:
- OUD identification or diagnosis: Having a formal diagnosis of OUD in a medical record or claim.
- Initiation of OUD treatment: Receiving OUD treatment services.
- Retention in OUD treatment: Staying engaged in OUD treatment for at least six months.
- Recovery: Reaching a state defined by the Substance Abuse and Mental Health Services Administration (SAMHSA) as “a process of change through which individuals improve their health and wellness, live self-directed lives, and strive to reach their full potential.”9
Using these stages, the panel laid out the core treatment measures in Table 1.
Table 1
The Core OUD Treatment Measures


| Cascade stage | Measure | Description |
|---|---|---|
| OUD identification and diagnosis | OUD diagnosis Percentage of people assessed using a standardized screening tool |
Percentage of individuals who had documented OUD diagnosis (e.g., on an insurance claim). Rate of assessment using a screening tool such as the Drug Abuse Screening Test (DAST) or the Tobacco, Alcohol, Prescription Medication, and Other Substance Use (TAPS) tool. |
| Initiation of OUD treatment | Use of pharmacotherapy for OUD OUD provider availability |
Percentage of people diagnosed with an OUD who received medication to treat it. Number of providers and treatment programs that can provide MOUD. |
| Retention in OUD treatment | Continuity of pharmacotherapy for OUD HEDIS® * Initiation of OUD treatment and engagement in OUD treatment HEDIS® Follow-up after an emergency department visit for substance use |
Percentage of people receiving MOUD who use it for at least six months. Percentage of people who initiate treatment within two weeks of diagnosis; percentage of people with two or more services within the first month after initiating treatment. Percentage of people who receive follow-up care for substance use disorder or an overdose within seven days, and 30 days after visiting an emergency department for an SUD-related issue. |
| Recovery | One or more patient-reported outcome measures to be determined by each state Percentage of people who achieve an improved level of functioning or quality of life. | Percentage of people who receive follow-up care for substance use disorder or an overdose within seven days, and 30 days after visiting an emergency department for an SUD-related issue. |
* The Healthcare Effectiveness Data and Information Set (HEDIS®) is a registered trademark of NCQA.
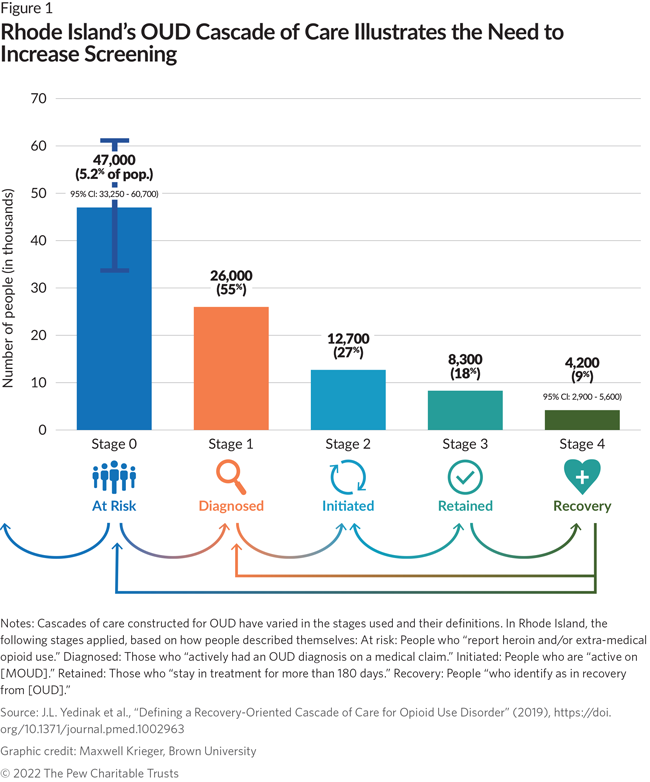
By applying these metrics, states can more readily see which aspects of their efforts to treat OUD are working well and which require greater attention and resources. Rhode Island, which has already used the cascade of care model, provides an example: The figure below illustrates that Rhode Island found a gap between the number of people at risk and the number of people actually screened for OUD. Based on this data, state officials determined that they needed to focus more on efforts to screen at-risk individuals for OUD and to support engagement with MOUD thereafter.10
A Toolkit for Adopting the Core OUD Treatment Measures
To help state policymakers and data analysts adopt the core metrics, Pew commissioned an implementation toolkit authored by Dr. Tami Mark, senior fellow at the nonprofit research institution RTI International, which:
- Provides a checklist of activities to implement and use the measures to improve OUD policies, programs, and practices.
- Provides detailed information about each metric, including data sources used to create the measure; the organization responsible for updating the measure; and links to additional technical details on how the measure is produced.
- Describes how the measures can be used to identify inequities in access and use of OUD treatment by race, ethnicity, geography, and other populations of interest.
Selection of the Core OUD Treatment Measures
To select the core metrics specific to OUD, Pew first created an inventory of those currently being used to measure substance use treatment (Appendix B outlines methods used to develop this inventory, as well as the full list of metrics). Next, Pew shared these metrics with the panel that—using criteria adapted from the National Quality Forum (NQF) to be specific to OUD treatment and with an emphasis on health equity—discussed and prioritized them.11 NQF is a nonprofit group that evaluates measures used by federal and state governments and private-sector health care organizations to rate the quality of care.12 The criteria are listed below in the order of importance as determined by panelists via their response to a pre-meeting survey.
- Usability and use: Extent to which potential audiences (e.g., consumers, purchasers, providers, policymakers) are using, or could use, the metrics to achieve high-quality, effective OUD treatment.
- Equity: Extent to which the measure allows for identification of disparities by stratifying the data (e.g., by race, ethnicity, age, insurance status, income, gender, region).
- Importance to measure and report: Extent to which the focus of the measure is important to improve opioid treatment, policy, programming, and outcomes.
- Feasibility: Extent to which the measure uses data that is readily available.
- Scientific acceptability of measure properties: Extent to which the measure produces consistent (reliable) and credible (valid) results about the quality of care, particularly the use of evidence-based OUD treatment such as medications.
- Related or competing measures: If more than one measure meets the above criteria and measures similar concepts, the best measure is selected.
After assessing each metric with these criteria, the panel selected the measures (in Table 2, below).
Table 2
Core OUD Treatment Measures for States

| Cascade Stage | Measure | Definition | Source |
|---|---|---|---|
| OUD identification/ diagnosis | 1a. OUD diagnosis 1b. Assessed for SUD using a standardized screening tool |
Percentage of individuals who had documented OUD diagnosis (e.g., on an insurance claim). Percentage of individuals who were screened/ assessed for SUD using a standardized screening tool. |
N/A Medicaid 1115 SUD waiver monitoring |
| Initiation of OUD treatment | 2a. Use of pharmacotherapy for OUD 2b. OUD provider availability |
Percentage of individuals with an OUD diagnosis who filled a prescription for or were administered or dispensed an MOUD, overall and by type of MOUD (methadone, buprenorphine, naltrexone). Number of providers who can prescribe buprenorphine, number of providers who do prescribe buprenorphine, number of opioid treatment programs that dispense methadone and/or buprenorphine. |
NQF* #3400 Medicaid 1115 SUD waiver monitoring |
| Retention in OUD treatment | 3a. Continuity of pharmacotherapy for OUD 3b. Initiation of OUD treatment and engagement in OUD treatment 3c. Follow-up after an emergency department visit for substance use |
Percentage of individuals who filled a prescription or were dispensed an MOUD who received the MOUD for at least six months, overall and by type of MOUD (methadone, buprenorphine, naltrexone). Percentage of individuals who initiate SUD treatment within 14 days of an OUD diagnosis. Percentage of individuals who had two or more additional SUD services within 30 days of the initiation SUD treatment encounter. Percentage of emergency department visits for individuals with a principal SUD or overdose diagnosis who had a follow-up visit for SUD within seven days of the visit and within 30 days of the visit (two rates are reported, one for each time period). |
NQF #3175 HEDIS® † Initiation and engagement of substance use treatment (NQF #0004), stratified for OUD.‡ HEDIS® Follow-up after emergency department visit for substance use (NQF #3488) |
| Recovery from OUD | 4. One or more patientreported outcome measures to be determined by each state | Percentage of individuals who achieve an improved level of functioning or quality of life. |
* This table provides National Quality Forum numbers for measures with current endorsements (an indication that they meet NQF standards for importance, reliability, validity, usability and relevance, and feasibility).
†The Healthcare Effectiveness Data and Information Set (HEDIS®) is a registered trademark of NCQA.
‡The NCQA HEDIS® measure specification has been adjusted pursuant to NCQA’s Rules for Allowable Adjustments of HEDIS. The adjusted measure specification may be used only for internal quality improvement purposes.

Additional detail on the core OUD treatment measures selected for each stage of care follows, including the expert panel’s rationale for selecting each measure and how the cascade and supporting measures work together.
1. OUD Identification and Diagnosis
Measures:
- Cascade measure:
- 1a. Diagnosed OUD
- Supporting measure:
- 1b. Percentage assessed for SUD using a standardized screening tool
1a. Diagnosed OUD
The starting point for evaluating care is measuring the population diagnosed with an OUD. Comparing diagnosis rates, such as those captured on claims data, to prevalence estimates from the state’s own data or SAMHSA’s National Survey on Drug Use and Health will provide policymakers a sense of how well their treatment systems are identifying people with OUD—the first step toward engaging them in care. For example, efforts to apply the cascade of care in Denver indicated that fewer than half of the estimated residents with OUD, opioid misuse, or opioid poisoning had been diagnosed with OUD in the Denver Health system, a safety net provider.13
1b. Percentage Assessed for SUD Using a Standardized Screening Tool
States should measure how widely they are screening for OUD in order to identify more people with the condition. The U.S. Preventive Services Task Force, authorized by Congress to make recommendations for preventive services in primary care settings, recommends that providers ask all adults if they partake in unhealthy drug use.14
However, research suggests that such widespread screening does not happen. A study of rural Pennsylvania counties found that fewer than 20% of people with OUD in the Medicaid program were diagnosed in primary care, although they regularly sought care in these settings.15 Screening rates are lacking in prisons, as well. Interviews with representatives from 21 state prison systems, representing 583 individual facilities, found that fewer than half of the prisons conducted screening.16 Mental health specialists also frequently underdiagnose substance use disorders among their patients.17
Using these two measures—diagnosed OUD and patients assessed for SUD using a standardized screening tool— will provide states with an understanding of how effectively they are identifying people in need of care. Policymakers can then target efforts to increase screening rates in settings where they will have the greatest impact.
2. Initiation of OUD Treatment
Measures:
- Cascade measure:
- 2a. Use of pharmacotherapy for OUD
- Supporting measure:
- 2b. OUD provider availability
2a. Use of pharmacotherapy for OUD
Medication is the most effective treatment for opioid use disorder. Methadone and buprenorphine, in particular, reduce the risk of overdose, improve treatment retention, and, by reducing risky behaviors such as the injection of illicit drugs, also decrease the transmission of infectious diseases such as HIV and hepatitis C.18 Injectable naltrexone is effective in helping people reduce opioid cravings, reduce illicit opioid use, and stay in treatment.19
However, in 2020, fewer than 12% of people ages 12 or older in the U.S. with OUD in the past year received medications.20 States that measure the use of pharmacotherapy for OUD have also found treatment gaps. In Rhode Island, just 27% of people at risk for OUD (those who “report heroin and/or extra-medical opioid use”) had initiated medication, while in Florida 40% of those with an OUD diagnosis received MOUD. Although these numbers are not directly comparable because Rhode Island includes people without a diagnosis in the rate, and Florida only includes those with a diagnosis, these findings indicate a need for strategies to increase medication uptake.21
2b. OUD provider availability
A lack of available providers is one factor that prevents people with OUD from receiving medication. As of July 2020, more than one-third of all rural counties lacked a single buprenorphine prescriber.22 People with OUD also face challenges accessing opioid treatment programs (OTP), the only place where they can obtain methadone. A study of five states found the average drive time to reach an OTP was nearly 40 minutes.23
However, these access challenges are not evenly distributed within states. The same study found that, when comparing urban and rural communities, urban patients had a much shorter average drive to an OTP—less than 10 minutes—compared with nearly 50 minutes for people in rural areas.24 Buprenorphine access also varies within states; while some counties don’t have any treatment providers, neighboring jurisdictions could have several.25
Further, the medication someone uses may be determined by where they live, rather than what works best for them. Although OTPs that distribute methadone are more common in predominantly Black and Hispanic communities, White communities are more likely to have buprenorphine providers.26
By measuring provider availability and stratifying this data by geography, states can identify the areas with greatest need and develop plans to increase the number of providers in those places.
3. Retention in OUD Treatment
Measures:
- Cascade measure:
- 3a. Continuity of pharmacotherapy for OUD
- Supporting measure:
- 3b. Initiation of OUD treatment and engagement in OUD treatment
- 3c. Follow-up after an emergency department visit for OUD
3a. Continuity of pharmacotherapy for OUD
To achieve good outcomes, people with OUD must do more than just start medication; they need to stay on it.27 Studies have shown that long-term treatment can lead to better outcomes in employment, health, and criminal justice involvement.28 In addition, it is safer for patients to continue prescribed medications for OUD than to suddenly stop treatment, which can increase the risk of overdose. For these reasons, federal guidelines discourage the removal of patients from treatment programs.29
To evaluate whether people with OUD are continuing to use medications, states should use the metric “Continuity of pharmacotherapy for OUD” to measure the percentage of people who receive MOUD for 180 days or six months.
An important aspect of this measure: It reports treatment retention rates for each of the three FDA-approved medications for OUD. Because the medications are available in different settings and under different conditions (e.g., methadone is available only in OTPs; prescribers must get permission from federal agencies to prescribe buprenorphine), tracking differences in retention across them could indicate a need to modify medicationspecific policies and practices. 30 For example, if data showed that patients taking methadone were less likely to stay in treatment, policymakers might determine that they need to remove barriers to the medication.
3b. Initiation of OUD treatment and engagement in OUD treatment
In Medicaid, many people who begin treatment for OUD leave care in the early stages. The measure “Initiation of OUD treatment and engagement in OUD treatment” indicates whether people continue to receive services during the first six to seven weeks after diagnosis. Among the 39 states reporting this measure to the Centers for Medicare and Medicaid Services in 2020, an average of 55% of people between the ages of 18 and 64 began treatment within 14 days of a diagnosis, but only 39% received two or more additional treatment services over the following 34 days.31 These rates varied greatly by state, suggesting that some states may have more promising approaches to retaining people in care early on.32
Using this measure and stratifying it by treatment setting, geography, race, gender, and other characteristics will help states identify who is at the greatest risk for leaving treatment in the early stages and develop strategies to help them stay.
Case Study: Kentucky
Kentucky was one of the earliest states to report an opioid crisis, and it already calculates and uses many of the core measures to evaluate care for its Medicaid population.
A variety of factors led Kentucky to invest in data to track the effectiveness of its OUD treatment system. State legislation required the Department for Behavioral Health, Developmental and Intellectual Disabilities to collect quality data as part of licensing requirements for drug treatment programs. The federal Centers for Medicare and Medicaid Services (CMS) also required the state to collect data on treatments for SUD as part of its Medicaid 1115 waiver to pay for residential SUD services. Beyond the legal requirements, state leaders also felt a responsibility to both the federal government and the state legislature to be “good stewards” of a substantial amount of funding and to track outcomes and direct money toward activities that were producing results, said Dr. Allen Brenzel, medical director for the state Department for Behavioral Health.33
Kentucky takes the important step of acting on this data. According to Dr. Katie Marks, director of the state’s opioid response grants at the Department for Behavioral Health, the legislature recently removed Medicaid’s prior authorization requirements for all forms of medications for OUD, a decision made after seeing numbers that showed a lag between diagnosis and the utilization of medication.34
3c. Follow-up after an emergency department (ED) visit for substance use
People visiting an ED for a substance use disorder are at a high risk for a subsequent fatal overdose.35 As a result, the American College of Emergency Physicians recommends that EDs provide medication to people with SUD and link them to community-based treatment. Unfortunately, however, data shows that few people who present at the ED with an overdose obtain follow-up treatment.36
By measuring the rates of follow-up care, states can design interventions to keep people connected to the treatment system after visiting the ED, improving their retention in care, and ultimately saving lives. However, it is important to note that this measure is not designed to specifically evaluate OUD-related care linkages—instead, it looks at substance use disorders more broadly.
4. Recovery from OUD
Measures:
- Cascade measure:
- 4. One or more patient-reported outcome measures to be determined by each state
Patients report that one of the things they most want out of substance use treatment is to improve the quality of their lives, a central element of recovery. 37 Yet people with OUD face many barriers to achieving this goal: stigma for both addiction and use of medication to manage it; difficulty finding a job or stable housing that supports recovery; interactions with the criminal legal system; co-occuring mental health conditions; and other challenges that may require support from the treatment system.38
It is critical for state policymakers to know if their treatment systems are improving lives and helping people recover, but because they are not systematically collecting and using data, their ability to do so is currently limited.
As a baseline, states can use data collected by SAMHSA in its National Survey on Drug Use and Health. This survey has since 2020 asked respondents who indicated that they have a problem with drug use whether they perceived themselves to be in recovery.39 However, although this survey provides an overall estimate of the number of residents in recovery, it does not provide the targeted information that policymakers need to improve the treatment system, such as where they received care.
One potential source for more detailed data is the SAMHSA National Outcome Measures, which states are required to collect and report for individuals receiving treatment in addiction programs that receive federal block grant funding.40 However, this data has multiple limitations. First, it does not include people receiving treatment in doctor’s offices. Second, it is collected using a tool called the GPRA (which stands for Government Performance and Results Act), which state officials have criticized for its length and potential for retraumatizing patients with questions about sensitive subjects—although a recent update to the tool attempts to address the latter concern.41 Finally, one of the outcome measures is successful discharge, which may be misinterpreted to imply that MOUD should be time-limited, despite research supporting long-term treatment.42
Other data that may be readily available to states, such as employment status and abstinence from drugs, may not accurately reflect the goals of each individual client.
Measures that strive to reflect whether clients are meeting their own goals—known as patient-reported outcome performance measures (PRO-PMs)—are currently limited in the field of substance use disorder. A 2020 report from the National Quality Forum identified the development of “quality of life/level of functioning measures” as a priority area of measurement for CMS.43
Progress is being made in establishing these measures. With funding from CMS, the American Psychiatric Association is developing measures for the “improvement or maintenance of symptoms, functioning, and recovery.” These measures may be available to states in the future.44
However, because states don’t have access to high-quality, actionable data on whether treatment is improving lives, the expert panel decided not to endorse a recovery measure at this time. Instead, the panel recommended that states collaborate with people with lived experience and providers to select one or more patient-reported outcomes and test strategies to collect and report the data.
As a starting point, state officials can select from existing recovery assessment tools developed to ask people with SUD about their quality of life. For example, the Brief Assessment of Recovery Capital (BARC-10) consists of 10 questions about substance use, mental and physical health, community involvement, social support, and other aspects of recovery capital—defined as “a variety of psychological, physical, social, and environmental resources” that mitigate the stress of achieving and maintaining recovery.45
For more options, see the Core OUD Treatment Measures Toolkit.
Recommendations
Implementing the core measures will give policymakers the data they need to understand the existing treatment landscape, including the number of people in a state with OUD who are receiving medication, as well as potential intervention points to increase the use of MOUD. However, to effectively close the gap between those who need medication and those who receive it, state officials need to think carefully about how the data is used.
Pew developed the following recommendations for state officials implementing the Core OUD Treatment Measures informed by the expert panel and a review of the literature:
Measures Must Be Accompanied by Planning and Action
Publicly report OUD treatment data
States commonly report opioid overdose deaths on public dashboards, but they should also report the core measures described here, including differences in MOUD availability and utilization by demographic groups and geographic areas.46 A systematic review and meta-analysis of public reporting on clinical measures found that public reporting is associated with improvements in outcomes.47
Design a plan to use OUD treatment data
In addition to publicly reporting OUD treatment metrics, state officials charged with responding to the opioid crisis should develop a plan that involves regularly reviewing the data and using it to inform program and policy decisions. This plan should include identifying a point person to take responsibility for ensuring that data is updated and reviewed; convening stakeholders across state agencies, provider groups, and communities who can help interpret and act on the data; and reviewing the resources available to support quality improvement activities.
The case study below illustrates the steps that leaders in one state took when establishing a data-driven approach to the opioid crisis. For additional implementation considerations, see the toolkit.
Case Study: Rhode Island
When Gina Raimondo took office as governor of Rhode Island in 2015, the smallest state in the U.S. ranked fifth in the nation in drug overdose deaths, fueled by the opioid crisis.48 Early in her first term, she created an overdose prevention task force that included representatives from the governor’s office, legislature, health and behavioral health departments, Medicaid, as well as stakeholders representing hospitals, corrections, police, state court judges, commercial insurance, health care advocates, and community members. Governor Raimondo tasked them with a singular mission: save lives.
One of the most important strategies was “increasing the number of people receiving [MOUD] each year.” To stay accountable to this goal, the state’s opioid dashboard reports the number of people receiving methadone or buprenorphine each month.49†
The task force also examines and acts on treatment data beyond what’s shown on the dashboard. For example, after finding low rates of medication uptake, researchers talked to people with OUD to understand why. One finding was a stigma attached to using medication. In response, the state expanded its use of peers with experience using MOUD to champion the use of medication and reduce stigma.50
Integrate community members and providers into data-driven decision-making
To understand the data, states need to collaborate with those in the best position to understand what it means and how to act on it—people with OUD and providers. People with lived experience can provide powerful insights into aspects of the OUD treatment system that are working well and areas that need improvement.
For example, researchers in Minnesota collaboratively developed a cascade of care for an American Indian Tribal Nation by establishing a community advisory board of members of the nation. This board collaborated with the researchers to interpret findings, noting that members of the Tribe with OUD had a lot of distrust and fear of the health care system while navigating treatment. They also found that treatment did not always incorporate or even acknowledge traditional healing practices.51 These insights provided a starting point for changing the treatment system to better meet the needs of Tribal members.
When establishing these collaborations, state officials should be careful to treat participants respectfully and not cause harm. Ethical collaborations benefit everyone involved. For state officials, the benefits are clear: a deeper understanding of how to serve their residents. For community members, the desired benefits vary but include helping others, having their voices heard, developing leadership opportunities, gaining new skills, and receiving monetary compensation.52 Community members should also have access to the data and findings; after all, it is their lives that are represented in the numbers.53
States should also involve treatment providers when analyzing these metrics. As people progress across the cascade of care, they will interact with many different providers and treatment settings. For example, they may be screened in an emergency department, receive support from a peer recovery coach, and go to an OTP for methadone. All these providers have a role to play in improving the OUD treatment system, and they must work together to support transitions from one setting to another.54
To Improve Health Equity, States Must Disaggregate the Data
In just one year, from 2019 to 2020, overdose deaths rose by 30% throughout the United States.55 But the trend in the aggregate masks stark differences in death rates by race and ethnicity. A study by the federal Centers for Disease Control and Prevention looked at overdose fatalities in 25 states and the District of Columbia and found that in these jurisdictions, the death rate increased the most among Black and American Indian/Alaska Native people (44% and 39%, respectively).56 By comparison, the increase for White people was 22%.57And because of systemic barriers to treatment, Black and Hispanic people are less likely to initiate and stay on medication than their White peers.58
These inequities demonstrate that states must disaggregate data by factors such as race and ethnicity, geographic location, gender, and age. Doing so can provide decision-makers in government and health care with rich information about where resources can best be directed to help ensure that all people have equitable access to services at each stage of the cascade of care. As noted in a recent Commonwealth Foundation report on the inadequacy of race/ethnicity data in government data systems, “We cannot improve what we cannot see or fail to measure. The path to health equity starts with collecting complete, accurate, and reliable race and ethnicity data.”59
Case Study: Missouri
Missouri reports on opioid overdoses as well as treatment utilization and retention, disaggregated by race and ethnicity. Reporting on treatment programs funded with federal SAMHSA block grants, Missouri’s data tracks treatment initiation, percentage of clients receiving each form of MOUD, retention in treatment, and time between first billable service and receipt of MOUD prescription.60
“If you’re already analyzing and reporting on this data, adding categories to track differences across racial groups is not a big lift,” said Rachel Winograd, who manages Missouri’s opioid data collection efforts. “The bigger question is, ‘What are you going to do when you find differences?’”61
Missouri’s data disaggregation efforts revealed that, along with a higher rate of overdose deaths, Black people’s retention rate in treatment was considerably lower than that of White people. Winograd said the findings influenced the state’s decision to use recent COVID-related federal funding to support five grassroots organizations in predominantly Black neighborhoods in St. Louis that serve people who use drugs. These groups, she said, had never before received state grant funding.62
Addressing data challenges
States can use data from insurers to track Core OUD Treatment Measures, but the quality of race and ethnicity data varies. Many commercial health plans do not collect race and ethnicity data.63 Although state Medicaid agencies are required to collect race/ethnicity data, and all collect self-reported data (a best practice) through the application process, their completeness and accuracy varies among states.64 Mismatches between responses on Medicaid applications and Census Bureau surveys and missing data have prompted researchers to raise “high concerns” about Medicaid race/ethnicity quality in 19 states.65
Experts point to a number of steps that Medicaid agencies could take to improve their reporting of race and ethnicity, including widespread use of intake workers to help applicants fill out forms and the use of CMSrecommended uniform reporting forms that feature more granularity in the reporting on Hispanic and Asian ethnicity and race categories.66 In lieu of these steps, to identify potential inequities among communities with different racial and ethnic profiles, states can compare performance on core measures. These techniques could be applied to both commercial and Medicaid claims.
Conclusion
The year 2021 was the worst on record for fatal opioid overdoses. Yet when states use data to address this crisis, there are signs of hope. In Missouri, state officials used data to pinpoint and address racial disparities in access to treatment. In Rhode Island, metrics informed an effort to decrease the stigma of using lifesaving medications for opioid use disorder. And in Kentucky, data made the case for removing barriers to these medications, helping people to get care when they were ready.
These examples show what’s possible when states collect and act on data. By using the Core OUD Treatment Measures to inform policy and practice, states can help transform their treatment systems to save lives.
Appendix A: Expert panel participants
Pew selected the expert panel to provide a diversity of perspectives on measuring the OUD cascade of care. By including the recovery community and harm reduction perspectives, treatment providers and quality measurement experts, federal officials, and the state agency staff who would ultimately use the data, Pew convened an expert panel with a range of points of view, all of whom engaged in a process to go from constructive disagreement to consensus.
| Name | Affiliation |
|---|---|
| Dr. Anika Alvanzo | Pyramid Healthcare Inc. (representing the American Society of Addiction Medicine) |
| Dr. Robert Baillieu | Substance Abuse and Mental Health Services Administration |
| Shannon Biello | Shatterproof |
| Jan Brown | SpiritWorks Foundation Center for the Soul |
| Amanda Geller | Centers for Disease Control and Prevention |
| Ann Hollen | Kentucky Department for Medicaid Services |
| Jodi Manz | National Academy for State Health Policy |
| Dr. Tami Mark | RTI International |
| Stephanie Rogers | Colorado Office of Behavioral Health |
| Christopher Sellers | Alabama Department of Mental Health |
| Dr. Kimberly Sue | National Harm Reduction Coalition |
| Monica Trevino | Michigan Public Health Institute |
Appendix B: Full metrics inventory and methodology
To identify the most appropriate metrics for tracking the cascade of care, Pew first created an inventory of all existing SUD and OUD measures, drawing from the following sources:
- National Quality Forum (NQF) Quality Positioning System.
- Centers for Medicare and Medicaid Services Measures Inventory Tool (CMIT) (which includes measures from the Behavioral Health Core Set).
- Medicaid 1115 substance use disorder (SUD) waiver demonstration monitoring metrics.
- Treatment-related metrics found in state opioid dashboards. If multiple states reported a similar measure, the panel treated it as a single measure. Pew identified state dashboards from a review of the Carolina Center for Health Informatics at UNC Chapel Hill’s “Opioid Dashboards and Data” page supplemented by a Google search for all 50 states and the District of Columbia in the format of “[state] opioid dashboard.” The research team only examined interactive dashboards for which metrics appeared to be updated regularly by a state or local government; the team did not review documents such as PDFs or PowerPoints for which metrics may have been reported at a point in time.
This inventory was developed in the summer of 2021; these sources may have had changes made to them since then.
To ensure that the inventory metrics were relevant to evidence-based OUD treatment, Pew excluded any measures that met the following criteria:
- Mental health only.
- A specific SUD other than opioid use (e.g., tobacco or alcohol use only).
- Controlled substance prescribing.
- Acute care utilization.
- Overdoses.
- Spending.
- Specific to inpatient psychiatric treatment care setting.
- Non-MOUD treatment utilization.
- Duplicative of other measures.
Pew then classified the metrics according to the stage of the care cascade that they measured or impacted. Some measures could be applied to multiple stages and were therefore assigned to multiple groups. Several measures for related health conditions that did not meet the exclusion criteria were considered even though they could not be placed in the care cascade. However, none of these measures was ultimately selected.
Complete metrics inventory


| Measure name | Cascade stage(s) | Measure source | NQF number |
|---|---|---|---|
| Assessed for SUD treatment needs using a standardized screening tool | Identification | 1115 SUD Waiver | N/A |
| Behavioral health risk assessment (for pregnant women) (BHRACH)—maternal care | Identification | CMIT | N/A |
| Identification of alcohol and other drug services (IAD) | Identification | CMIT | N/A |
| OUD prevalence | Identification | SAMHSA | N/A |
| DRAFT: Substance use screening and intervention composite | Identification and initiation/ engagement | CMIT | 2597 |
| Medicaid beneficiaries with newly initiated SUD treatment/diagnosis | Identification and initiation/ engagement | 1115 SUD Waiver | N/A |
| SUB-3 alcohol & other drug use disorder treatment provided or offered at discharge and SUB-3a alcohol & other drug use disorder treatment at discharge | Initiation and engagement | CMIT | 1664 |
| Alcohol and other drug use disorder treatment at discharge | Initiation and engagement | CMIT | N/A |
| Alcohol and other drug use disorder treatment provided or offered at discharge | Initiation and engagement | CMIT | N/A |
| Buprenorphine capacity | Initiation and engagement | Michigan Overdose Data to Action Dashboard, Rhode Island MedicationAssisted Treatment Data Dashboard | N/A |
| Continuity of care after medically managed withdrawal from alcohol and/or drugs | Initiation and engagement | CMIT | 3312 |
| Counseling regarding pharmacological treatment for opioid dependence | Initiation and engagement | CMIT | N/A |
| Follow-up after emergency department visit for alcohol and other drug abuse or dependence (FUA-HH) | Initiation and engagement | CMIT | 3488 |
| Follow-up after emergency department visit for mental illness or alcohol and other drug abuse or dependence | Initiation and engagement | NQF | 2605 |
| Individuals in prison receiving MAT | Initiation and engagement | Pennsylvania Opioid Data Dashboard | N/A |
| MAT providers for SUD treatment services | Initiation and engagement | Illinois Department of Public Health Opioid Data Dashboard | N/A |
| Medication-assisted treatment | Initiation and engagement | 1115 SUD Waiver | N/A |
| Number of opioid treatment programs for methadone therapy | Initiation and engagement | Rhode Island Medication-Assisted Treatment Data Dashboard | N/A |
| Number of VIVITROL providers | Initiation and engagement | Rhode Island Medication-Assisted Treatment Data Dashboard | N/A |
| Percentage of Medicaid beneficiaries receiving buprenorphine who have a documented diagnosis of opioid use disorder | Initiation and engagement | CMIT | N/A |
| Percentage of Medicaid beneficiaries with a diagnosis of opioid use disorder who are prescribed a medication for treatment of OUD. | Initiation and engagement | CMIT | N/A |
| Rates of methadone receipt per 100,000 by race/ethnicity | Initiation and engagement | Rhode Island Medication-Assisted Treatment Data Dashboard | N/A |
| Receipt of MOUD (count) | Initiation and engagement | Louisiana Department of Health Medicaid Expansion Dashboard; Pennsylvania Opioid Data Dashboard; Rhode Island Medication-Assisted Treatment Data Dashboard | N/A |
| Receipt of MOUD (rate) | Initiation and engagement | Vermont Opioids Scorecard | N/A |
| State total for substance use treatment admission, medicationassisted treatment planned in treatment | Initiation and engagement | New Jersey Overdose Data Dashboard (treatment statistics) | N/A |
| Substance use disorders: percentage of patients ages 18 years and older with a diagnosis of current opioid addiction who were counseled regarding psychosocial AND pharmacologic treatment options for opioid addiction within the 12-month reporting period | Initiation and engagement | CMIT | N/A |
| SUD provider availability | Initiation and engagement | 1115 SUD Waiver | N/A |
| Treatment gap | Initiation and engagement | New Hampshire Health and Human Services Data Portal, New York State Opioid Data Dashboard | N/A |
| Use of pharmacotherapy for opioid use disorder (OUD-HH) | Initiation and engagement | CMIT | 3400 |
| Buprenorphine prescriptions (count) | Retention and initiation/ engagement | California Overdose Surveillance Dashboard; Rhode Island MedicationAssisted Treatment Data Dashboard | N/A |
| Buprenorphine prescriptions (rate) | Retention and initiation/ engagement | Delaware Population Health Dashboard (prescription monitoring program); New York State Opioid Data Dashboard; North Carolina Opioid and Substance Use Action Plan Data Dashboard; Rhode Island MedicationAssisted Treatment Data Dashboard | N/A |
| Continuity of care after inpatient or residential treatment for substance use disorder | Retention and initiation/ engagement | CMIT | 3453 |
| Initiation and adherence to medication-assisted treatment among individuals with opioid use disorder | Retention and initiation/ engagement | CMIT | N/A |
| Initiation and engagement of alcohol and drug dependence treatment | Retention and initiation/ engagement | CMIT | 0004 |
| Client goal achieved/partially achieved at discharge from substance use treatment | Recovery | New Jersey Overdose Data Dashboard (treatment statistics) | N/A |
| Continuity of pharmacotherapy for opioid use disorder | Recovery | CMIT | 3175 |
| Employment status upon substance use treatment discharge | Recovery | New Jersey Overdose Data Dashboard (treatment statistics) | N/A |
| Experience of Care and Health Outcomes (ECHO) Survey | Recovery | NQF | 0008 |
| Improvement or maintenance in recovery for individuals with a mental health and/or substance use disorder | Recovery | CMIT | N/A |
| Improvement or maintenance of functioning for individuals with a mental and/or substance use disorder | Recovery | CMIT | N/A |
| Measurement-based care (MBC): stabilization or reduction in symptoms for patients with opioid use disorder | Recovery | CMIT | N/A |
| Measurement-based care processes: baseline assessment, monitoring, and treatment adjustment | Recovery | CMIT | N/A |
| Patient-Reported Outcomes Measurement Information System [PROMIS]—PROMIS 29 profile, ability to participate in social roles and activities | Recovery | CMIT | N/A |
| Patient-Reported Outcomes Measurement Information System [PROMIS]—PROMIS 29 profile, anxiety | Recovery | CMIT | N/A |
| Patient-Reported Outcomes Measurement Information System [PROMIS] —PROMIS global health, mental health | Recovery | CMIT | N/A |
| Readmissions among beneficiaries with SUD | Recovery | 1115 SUD Waiver | N/A |
| Significant problems or conditions reported at substance use treatment discharge | Recovery | New Jersey Overdose Data Dashboard (treatment statistics) | N/A |
| Access to preventive/ambulatory health services for adult Medicaid beneficiaries with SUD | Related health conditions | 1115 SUD Waiver | N/A |
| Annual hepatitis C virus (HCV) screening for patients who are active injection drug users | Related health conditions | CMIT | N/A |
| One-time screening for hepatitis C virus (HCV) for patients at risk (eCQM) | Related health conditions | CMIT | 3059, 3059e |
| Substance use disorders: screening for depression among patients with substance abuse or dependence | Related health conditions | CMIT | N/A |
| Tobacco use screening and followup for people with serious mental illness or alcohol or other drug dependence | Related health conditions | NQF | 2600 |
Endnotes
- National Academies of Sciences, Engineering, and Medicine, Medications for Opioid Use Disorder Save Lives (Washington: The National Academies Press, 2019).
- Substance Abuse and Mental Health Services Administration, “Key Substance Use and Mental Health Indicators in the United States: Results from the 2020 National Survey on Drug Use and Health” (2021), https://www.samhsa.gov/data/sites/default/files/reports/rpt35325/NSDUHFFRPDFWHTMLFiles2020/2020NSDUHFFR1PDFW102121.pdf.
- Pew systematically examined state opioid dashboards identified by the Carolina Center for Health Informatics and a supplemental Google search. The research team then identified and cataloged all OUD treatment-related metrics that did not meet the established exclusion criteria (see Appendix for more detail). Carolina Center for Health Informatics, “Opioid Dashboards and Data,” The University of North Carolina at Chapel Hill, accessed Dec. 20, 2021, https://cchi.web.unc.edu/opioid-dashboards/.
- United Kingdom Department of Health & Social Care, “Towards Zero—An Action Plan Towards Ending HIV Transmission, AIDS and HIVRelated Deaths in England—2022 to 2025” (2021), https://www.gov.uk/government/publications/towards-zero-the-hiv-action-plan-forengland-2022-to-2025/towards-zero-an-action-plan-towards-ending-hiv-transmission-aids-and-hiv-related-deaths-in-england-2022to-2025; United Nations Joint Programme on HIV/AIDS, “90–90–90 — An Ambitious Treatment Target to Help End the AIDS Epidemic” (2017), https://www.unaids.org/en/resources/documents/2017/90-90-90.
- T. Kirby, “The UK Reaches UNAIDS 90-90-90 Targets,” The Lancet 392, no. 10163 (2018): 2427, https://www.sciencedirect.com/science/article/pii/S0140673618331179; United Kingdom Department of Health & Social Care, “Towards Zero.”
- M.K. Ali et al., “A Cascade of Care for Diabetes in the United States: Visualizing the Gaps,” Ann Intern Med 161, no. 10 (2014): 681-9, https://www.ncbi.nlm.nih.gov/pubmed/25402511; N.L. Allard, J.H. MacLachlan, and B.C. Cowie, “The Cascade of Care for Australians Living With Chronic Hepatitis B: Measuring Access to Diagnosis, Management and Treatment,” Aust N Z J Public Health 39, no. 3 (2015): 255-9, https://www.ncbi.nlm.nih.gov/pubmed/25716519; G. Alvarez-Uria et al., “Entry, Retention, and Virological Suppression in an HIV Cohort Study in India: Description of the Cascade of Care and Implications for Reducing HIV-Related Mortality in Low- and MiddleIncome Countries,” Interdiscip Perspect Infect Dis 2013 (2013): 384805, https://www.ncbi.nlm.nih.gov/pubmed/23935613; A. Anglemyer et al., “HIV Care Continuum and Meeting 90-90-90 Targets: Cascade of Care Analyses of a U.S. Military Cohort,” Mil Med 185, no. 7-8 (2020): e1147-e54, https://www.ncbi.nlm.nih.gov/pubmed/32207528; L. Barss et al., “Interventions to Reduce Losses in the Cascade of Care for Latent Tuberculosis: A Systematic Review and Meta-Analysis,” Int J Tuberc Lung Dis 24, no. 1 (2020): 100-09, https://www.ncbi.nlm.nih.gov/pubmed/32005312; HIV.Gov, “Why Is the HIV Care Continuum Important?” (June 21, 2021), https://www.hiv.gov/federalresponse/policies-issues/hiv-aids-care-continuum.
- A.R. Williams et al., “Development of a Cascade of Care for Responding to the Opioid Epidemic,” Am J Drug Alcohol Abuse 45, no. 1 (2019): 1-10; A.R. Williams et al., “Developing an Opioid Use Disorder Treatment Cascade: A Review of Quality Measures,” Journal of Substance Abuse Treatment 91 (2018): 57-68, https://www.journalofsubstanceabusetreatment.com/article/S0740-5472(18)30039-4/fulltext; A.R. Williams, E.V. Nunes, and M. Olfson, “To Battle the Opioid Overdose Epidemic, Deploy the ‘Cascade of Care’ Model,” Health Affairs (blog), Health Affairs, March 13, 2017, https://www.healthaffairs.org/do/10.1377/forefront.20170313.059163/full/.
- T. Boyd et al., “Quantifying Opioid Use Disorder Cascade of Care Outcomes in an American Indian Tribal Nation in Minnesota,” Drug and Alcohol Dependence 222 (2021): 108661, https://www.ncbi.nlm.nih.gov/pubmed/33775445; K. Johnson et al., “Treatment for Opioid Use Disorder in the Florida Medicaid Population: Using a Cascade of Care Model to Evaluate Quality,” Am J Drug Alcohol Abuse 47, no. 2 (2021): 220-28, https://www.ncbi.nlm.nih.gov/pubmed/33054435; J.T. Prieto et al., “Monitoring Opioid Addiction and Treatment: Do You Know If Your Population Is Engaged?” Drug Alcohol Depend 202 (2019): 56-60, https://www.ncbi.nlm.nih.gov/pubmed/31302412; J.L. Yedinak et al., “Defining a Recovery-Oriented Cascade of Care for Opioid Use Disorder: A Community-Driven, Statewide Cross-Sectional Assessment,” PLOS Medicine 16, no. 11 (2019): e1002963, https://doi.org/10.1371/journal.pmed.1002963.
- 9Substance Abuse and Mental Health Services Administration, “Recovery and Recovery Support,” accessed March 23, 2022, https://www.samhsa.gov/find-help/recovery.
- J.L. Yedinak et al., “Defining a Recovery-Oriented Cascade of Care for Opioid Use Disorder.”
- National Quality Forum, “Measure Evaluation Criteria,” accessed Feb. 4, 2022, https://www.qualityforum.org/Measuring_Performance/Submitting_Standards/Measure_Evaluation_Criteria.aspx.
- National Quality Forum, “NQF’s History,” accessed March 23, 2022, https://www.qualityforum.org/about_nqf/history/.
- Prieto et al., “Monitoring Opioid Addiction and Treatment.”
- U.S. Preventive Services Task Force, “Unhealthy Drug Use: Screening,” accessed Feb. 4, 2022, https://www.uspreventiveservicestaskforce.org/uspstf/recommendation/drug-use-illicit-screening.
- E.S. Cole et al., “The Role of Primary Care in Improving Access to Medication-Assisted Treatment for Rural Medicaid Enrollees With Opioid Use Disorder,” Journal of General Internal Medicine 34, no. 6 (2019): 936-43, https://www.ncbi.nlm.nih.gov/pmc/articles/PMC6544707/.
- C.K. Scott et al., “The Impact of the Opioid Crisis on U.S. State Prison Systems,” Health & Justice 9, no. 1 (2021): 17, https://doi.org/10.1186/s40352-021-00143-9.
- T.L. Mark, A. Meinhofer, and G.A. Zarkin, “Receipt of Substance Use Disorder Treatment Among Patients Visiting Psychiatrists,” Journal of Addiction Medicine 13, no. 3 (2019), https://journals.lww.com/journaladdictionmedicine/Fulltext/2019/06000/Receipt_of_Substance_Use_Disorder_Treatment_Among.16.aspx.
- R.P. Mattick et al., “Methadone Maintenance Therapy Versus No Opioid Replacement Therapy for Opioid Dependence,” Cochrane Database of Systematic Reviews CD002209, no. 3 (2009), https://www.cochranelibrary.com/cdsr/doi/10.1002/14651858.CD002209.pub2/abstract; D.S. Metzger et al., “Human Immunodeficiency Virus Seroconversion Among Intravenous Drug Users In- and Out-ofTreatment: An 18-Month Prospective Follow-Up,” Journal of Acquired Immune Deficiency Syndromes 6, no. 9 (1993): 1049-56, https:// pubmed.ncbi.nlm.nih.gov/8340896/; R.P. Schwartz et al., “Opioid Agonist Treatments and Heroin Overdose Deaths in Baltimore, Maryland, 1995-2009,” American Journal of Public Health 103, no. 5 (2013): 917-22, https://www.ncbi.nlm.nih.gov/pubmed/23488511; J.I. Tsui et al., “Association of Opioid Agonist Therapy With Lower Incidence of Hepatitis C Virus Infection in Young Adult Injection Drug Users,” JAMA Internal Medicine 174, no. 12 (2014): 1974-81, https://www.ncbi.nlm.nih.gov/pubmed/25347412; S.E. Wakeman et al., “Comparative Effectiveness of Different Treatment Pathways for Opioid Use Disorder,” JAMA Network Open 3, no. 2 (2020): e1920622, https://www.ncbi.nlm.nih.gov/pubmed/32022884.)
- S.D. Comer et al., “Injectable, Sustained-Release Naltrexone for the Treatment of Opioid Dependence: A Randomized, Placebo-Controlled Trial,” Archives of General Psychiatry 63, no. 2 (2006): 210-8, https://www.ncbi.nlm.nih.gov/pubmed/16461865; E. Krupitsky et al., “Injectable Extended-Release Naltrexone for Opioid Dependence: A Double-Blind, Placebo-Controlled, Multicentre Randomised Trial,” The Lancet 377, no. 9776 (2011): 1506-13, https://doi.org/10.1016/S0140-6736(11)60358-9; J.D. Lee et al., “Comparative Effectiveness of Extended-Release Naltrexone Versus Buprenorphine-Naloxone for Opioid Relapse Prevention (X:Bot): A Multicentre, Open-Label, Randomised Controlled Trial,” The Lancet 391, no. 10118 (2018): 309-18, https://www.ncbi.nlm.nih.gov/pmc/articles/PMC5806119/; J.R. Morgan et al., “Overdose Following Initiation of Naltrexone and Buprenorphine Medication Treatment for Opioid Use Disorder in a United States Commercially Insured Cohort,” Drug and Alcohol Dependence 200 (2019): 34-39, https://doi.org/10.1016/j.drugalcdep.2019.02.031; Wakeman et al., “Comparative Effectiveness.”
- Substance Abuse and Mental Health Services Administration, “Key Substance Use and Mental Health Indicators in the United States.”
- Johnson et al., “Treatment for Opioid Use Disorder in the Florida Medicaid Population: Using a Cascade of Care Model to Evaluate Quality”; Yedinak et al., “Defining a Recovery-Oriented Cascade.”
- C.H.A. Andrilla and D.G. Patterson, “Tracking the Geographic Distribution and Growth of Clinicians With a DEA Waiver to Prescribe Buprenorphine to Treat Opioid Use Disorder,” The Journal of Rural Health 38, no. 1 (2022): 87-92, https://onlinelibrary.wiley.com/doi/abs/10.1111/jrh.12569.
- P.J. Joudrey, E.J. Edelman, and E.A. Wang, “Drive Times to Opioid Treatment Programs in Urban and Rural Counties in 5 U.S. States,” JAMA 322, no. 13 (2019): 1310-12, https://www.ncbi.nlm.nih.gov/pmc/articles/PMC6777265/.
- Ibid.
- U.S. Department of Health and Human Services, Office of Inspector General, “Buprenorphine-Waivered Providers—County Data,” accessed Feb. 4, 2022, https://oig.hhs.gov/oei/maps/waivered-providers/index.html.
- W.C. Goedel et al., “Association of Racial/Ethnic Segregation With Treatment Capacity for Opioid Use Disorder in Counties in the United States,” JAMA Netw Open 3, no. 4 (2020): e203711, https://www.ncbi.nlm.nih.gov/pubmed/32320038.
- American Society of Addiction Medicine, “The ASAM National Practice Guideline for the Treatment of Opioid Use Disorder—2020 Focused Update” (2020), https://www.asam.org/quality-care/clinical-guidelines/national-practice-guideline.
- National Academies of Sciences, Medications for Opioid Use Disorder Save Lives.
- Substance Abuse and Mental Health Services Administration, “Medications for Opioid Use Disorder: For Healthcare and Addiction Professionals, Policymakers, Patients, and Families” (2020), https://store.samhsa.gov/sites/default/files/SAMHSA_Digital_Download/PEP20-02-01-006.pdf.
- Practice Guidelines for the Administration of Buprenorphine for Treating Opioid Use Disorder, 86 Fed. Reg. 22439-40 (4/28/2021), https://www.federalregister.gov/documents/2021/04/28/2021-08961/practice-guidelines-for-the-administration-of-buprenorphinefor-treating-opioid-use-disorder; The Pew Charitable Trusts, “Medications for Opioid Use Disorder Improve Patient Outcomes” (2020), https://www.pewtrusts.org/en/research-and-analysis/fact-sheets/2020/12/medications-for-opioid-use-disorder-improve-patientoutcomes.
- Centers for Medicare and Medicaid Services, “Quality of Behavioral Health Care in Medicaid and CHIP: Findings From the 2020 Behavioral Health Core Set” (2022), https://www.medicaid.gov/medicaid/quality-of-care/downloads/2021-behavioral-health-chartpack.pdf.
- Ibid.
- A. Brenzel, medical director, Kentucky Department for Behavioral Health, Developmental and Intellectual Disabilities, phone call to Jane Koppelman, senior officer, The Pew Charitable Trusts, Dec. 21, 2021.
- K. Marks, project director, Kentucky Opioid Response Effort, phone call to Jane Koppelman, senior officer, The Pew Charitable Trusts, Dec. 21, 2021.
- N. Krawczyk et al., “Predictors of Overdose Death Among High-Risk Emergency Department Patients With Substance-Related Encounters: A Data Linkage Cohort Study,” Annals of Emergency Medicine 75, no. 1 (2020): 1-12, https://pubmed.ncbi.nlm.nih.gov/31515181/.
- K. Hawk et al., “Consensus Recommendations on the Treatment of Opioid Use Disorder in the Emergency Department,” Annals of Emergency Medicine 78, no. 3 (2021): 434-42, https://www.sciencedirect.com/science/article/pii/S0196064421003061; A.S. Kilaru et al., “Incidence of Treatment for Opioid Use Disorder Following Nonfatal Overdose in Commercially Insured Patients,” JAMA Network Open 3, no. 5 (2020): e205852-e52, https://doi.org/10.1001/jamanetworkopen.2020.5852.
- Community Catalyst, Faces & Voices of Recovery, and American Society of Addiction Medicine, “Peers Speak Out: Priority Outcomes for Substance Use Treatment Services” (2021), https://www.communitycatalyst.org/resources/tools/peers-speak-out/pdf/Peers-SpeakOut.pdf.
- C. Truong et al., “Challenges on the Road to Recovery: Exploring Attitudes and Experiences of Clients in a Community-Based Buprenorphine Program in Baltimore City,” Addictive Behaviors 93 (2019): 14-19, https://www.sciencedirect.com/science/article/pii/ S0306460318308360; Brandeis Opioid Resource Connector, “Addressing the Opioid Crisis Through Social Determinants of Health: What Are Communities Doing?” (2021), https://opioid-resource-connector.org/sites/default/files/2021-02/Issue%20Brief%20-%20Final.pdf.
- Substance Abuse and Mental Health Services Administration, “2020 National Survey on Drug Use and Health (NSDUH): Methodological Summary and Definitions” (2021), https://www.samhsa.gov/data/sites/default/files/reports/rpt35330/2020NSDUHMethodSummDefs091721.pdf.
- Department of Health and Human Services, Office of Inspector General, “SAMHSA Has Improved Outcome Reporting for the Substance Abuse Prevention and Treatment Block Grant” (2015), https://oig.hhs.gov/oei/reports/oei-04-12-00160.pdf.
- S.K. Blanchard, “Health Officials Warn Historic Addiction Treatment Funding Burdened by Federal Bureaucracy,” The Intercept, July 6, 2021, https://theintercept.com/2021/07/06/addiction-treatment-samhsa-gpra-tool/; Substance Abuse and Mental Health Services Administration, “Supporting Statement for the Government Performance and Results Act Client/Participant Outcome Measure” (2021), https://www.reginfo.gov/public/do/DownloadDocument?objectID=119332201.
- National Academies of Sciences, Medications for Opioid Use Disorder Save Lives.
- National Quality Forum, “Opioids and Opioid Use Disorder: Quality Measurement Priorities” (2020), https://www.qualityforum.org/WorkArea/linkit.aspx?LinkIdentifier=id&ItemID=92192.
- American Psychiatric Association, “Quality Measure Development,” accessed May 17, 2022, https://www.psychiatry.org/psychiatrists/practice/quality-improvement/quality-measure-development.
- C.L. Vilsaint et al., “Development and Validation of a Brief Assessment of Recovery Capital (BARC-10) for Alcohol and Drug Use Disorder,” Drug and Alcohol Dependence 177 (2017): 71-76, https://www.sciencedirect.com/science/article/pii/S0376871617302119.
- Carolina Center for Health Informatics, “Opioid Dashboards and Data.”
- P. Campanella et al., “The Impact of Public Reporting on Clinical Outcomes: A Systematic Review and Meta-Analysis,” BMC Health Services Research 16 (2016): 296-96, https://pubmed.ncbi.nlm.nih.gov/27448999, https://www.ncbi.nlm.nih.gov/pmc/articles/PMC4957420/.
- R. Rudd et al., “Increases in Drug and Opioid-Involved Overdose Deaths—United States, 2010–2015,” Morbidity and Mortality Weekly Report 65, no. 50-51 (2016): 1445-52, http://dx.doi.org/10.15585/mmwr.mm655051e1.
- Prevent Overdose RI, “Track Our Action Plan,” accessed March 7, 2022, https://preventoverdoseri.org/track-our-action-plan/.
- N. Alexander-Scott and R. Boss, “Governor Raimondo’s Task Force on Overdose Prevention and Intervention,” Dec. 11, 2019, https://preventoverdoseri.org/wpcontent/uploads/2019/12/Dec2019_GTF_PowerPoint_Final.pdf.
- Boyd et al., “Quantifying Opioid Use Disorder Cascade of Care Outcomes.”
- C. Simon et al., “We Are the Researched, the Researchers, and the Discounted: The Experiences of Drug User Activists as Researchers,” International Journal of Drug Policy 98 (2021): 103364, https://www.sciencedirect.com/science/article/pii/S0955395921002693.
- Ibid.
- C. Blanco et al., “America’s Opioid Crisis: The Need for an Integrated Public Health Approach,” Translational Psychiatry 10, no. 1 (2020): 167, https://doi.org/10.1038/s41398-020-0847-1.
- M. Kariisa et al., “Vital Signs: Drug Overdose Deaths, by Selected Sociodemographic and Social Determinants of Health Characteristics—25 States and the District of Columbia, 2019–2020,” Morbidity and Mortality Weekly Report 71, no. 29 (2022): 940-47, http://dx.doi.org/10.15585/mmwr.mm7129e2.
- Ibid.
- Ibid.
- B. Andraka-Christou, “Addressing Racial and Ethnic Disparities in the Use of Medications for Opioid Use Disorder,” Health Affairs 40, no. 6 (2021): 920-27, https://doi.org/10.1377/hlthaff.2020.02261.
- Grantmakers in Health and National Committee for Quality Assurance, “Federal Action Is Needed to Improve Race and Ethnicity Data in Health Programs” (2021), https://www.gih.org/wp-content/uploads/2021/10/GIH-Commonwealth-Fund-federal-data-report-part-1.pdf.
- Missouri Department of Health & Senior Services, “Missouri Opioids Information,” accessed Feb. 7, 2022, https://health.mo.gov/data/opioids/.
- R. Winograd, associate professor, Department of Psychological Sciences, Missouri Institute of Mental Health, University of Missouri-St Louis, phone call to Jane Koppelman, The Pew Charitable Trusts, Dec. 13, 2021.
- Ibid.
- Grantmakers in Health and National Committee for Quality Assurance, “Federal Action Is Needed to Improve Race and Ethnicity Data in Health Programs.”
- State Health Access Data Assistance Center, “Race/Ethnicity Data in CMS Medicaid (T-MSIS) Analytic Files Updated December 2021– Features 2019 Data,” accessed Feb. 7, 2022, https://www.shadac.org/news/raceethnicity-data-cms-medicaid-t-msis-analytic-filesupdated-december-2021-%E2%80%93-features-2019.
- Ibid.; L.E. Fernandez et al., “Evaluating Race and Hispanic Origin Responses of Medicaid Participants Using Census Data” (working paper, Center for Adminsitrative Records Research and Applications, U.S. Census Bureau, 2015), https://www.census.gov/library/workingpapers/2015/adrm/carra-wp-2015-01.html.
- Grantmakers in Health and National Committee for Quality Assurance, “Federal Action Is Needed to Improve Race and Ethnicity Data in Health Programs.”
ADDITIONAL RESOURCES

Article
Fact Sheet


