State Public Pension Fund Returns Expected to Decline
Review of investment practices and performance for 2018 and 2019

Overview
About 29 million Americans have been promised retirement benefits through state public sector pension systems. And more than half of those benefits depend on earnings generated by nearly $4 trillion in assets held in trust by those systems.1 However, with more than two-thirds of those assets allocated to risky investments—publicly traded stocks, also known as equities, and alternative vehicles, including private equity, real estate, and hedge funds—retirement systems’ ability to meet their commitments hinges largely on investments that are subject to stock market swings.
Market volatility since 2019 underscores the risks and potential rewards that accompany this strategy. The S&P 500 index fell 34% at the start of the COVID-19 pandemic in February and March 2020, which led pension asset values to plummet as well. Then, beginning just a month later, markets soared, pushing returns into positive territory for fiscal year 2020 and up to 27% on average for fiscal 2021—the highest annual returns in more than 30 years.2 As a result, plan assets increased by over $500 billion, driving the funded ratio—the share of promised benefits that plans have funds to pay for—above 80% for the first time since 2008.3
Despite this recent rally, pension fund returns have declined fairly steadily this century, and a combination of trends suggests that will continue. With stock valuations well above historical averages and the Congressional Budget Office projecting that real gross domestic product (GDP) growth—a major driver of equity returns—will be lower in coming years than in fiscal 2021, future returns are likely to drop as stock prices adjust. Additionally, interest rates have hit all-time lows, diminishing expectations for returns on fixed-income investments, such as bonds.
Over the past decade, pension funds have lowered the return assumptions that inform their investment decisions from a median of 8% in 2009 to 7.25% as of 2019. The Pew Charitable Trusts and other experts expect average pension fund returns closer to 6%, suggesting that plans may continue to lower their assumptions. Falling returns have a significant impact on pension plans: A 1 percentage point drop in annual returns on $4 trillion equates to a $40 billion decrease in pension assets.
Investment costs, especially fees, also affect pension funds’ bottom lines and vary widely across plans, and when funds are not transparent in disclosing fees paid, policymakers and the public are less able to assess plan performance. For example, Pew estimates that fees for private equity are three times the average across all asset classes and that unreported private equity fees total at least $5 billion annually. Yet only a handful of states have comprehensive requirements for disclosure of these costs.
This chartbook updates Pew’s research on the performance of the nation’s 73 largest state public pension funds for fiscal 2018 and 2019, the most recent years for which comprehensive data is available, and provides a snapshot of the investment allocations, reporting practices, and fees that affect state retirement systems’ ability to deliver on their promises to public workers.4

Since the end of the 1990s, the total allocation from public pension funds to risky investments has accounted for 70% to 75% of investments.
After shifting away from relatively safe bonds toward comparatively risky stocks from the 1950s to the 1990s, pension funds have turned more and more over the past 15 years to alternative assets to diversify their portfolios and achieve return targets. Investments in these vehicles have doubled since 2006, and in 2019 made up about a quarter of total assets. Alternative investments are more difficult to value than stocks or bonds and have expensive, complex fee structures, raising the bar for reporting: To evaluate how effectively and efficiently a given plan’s investments are performing, its members and board need comprehensive information that details costs and returns broken down by asset class.

Across the U.S., state public pension funds employ remarkably similar investment strategies: All 73 pension funds studied invested more than half of their funds in risky assets in 2019, with 52—or nearly threequarters—of them falling in a tight range of 65% to 80%. The South Dakota Retirement System had the lowest allocation to risky assets, 53%; the Alaska Public Employees’ Retirement System and the West Virginia Consolidated Public Retirement Board reported the highest allocation, 88%.

Increased allocations to stocks and alternatives can result in greater financial returns but also heighten volatility and the risk of losses. Pension fund yields are highly correlated with the volatile swings in stock returns; even relatively small differences can have a major effect on asset values. For example, a 1 percentage point difference in annual returns on $4 trillion in assets equates to a $40 billion impact on pension assets.

Fund managers’ investment choices within the alternative investment asset class vary widely.
Overall, funds are more likely to invest significantly—more than 5% of assets—in private equity or real estate than in hedge funds. Among individual funds, the share of total assets allocated to alternative investments ranged from zero to more than 30%; and of the 73 funds studied, 31 had more than10% of assets in private equity, while only nine had more than 10% in hedge funds in 2019.
In addition, a recent trend among large pension funds has been to divest from hedge funds. For example, the largest pension plans in California, New York City, and Pennsylvania announced in 2014, 2016, and 2021, respectively, their intentions to exit the asset class because of high fees and poor performance.

Recent market volatility highlights the importance of managing pension plan risks and maintaining realistic return targets. Driven by the start of the COVID-19 pandemic, the S&P
500 index fell 34% in February and March of 2020, and pension asset values also plummeted. But by mid-2021 markets were soaring, yielding a two-year 2020-21 fiscal return of 21%. In fiscal 2021, state pension funds saw historic median returns of more than 25%, with assets approaching $4 trillion.
Although pension funds emerged from the period with net positive yields, a more prolonged recession or a slower recovery, such as what followed the Great Recession, could have left them much more vulnerable. Plan administrators, trustees, and government sponsors need comprehensive tools and information—including on investment costs and performance—to make complex investment decisions when facing such uncertainty.

Annual returns in excess of 25% are rare: Before 2021, they were last seen in the 1980s. Pension funds should not expect to replicate such unusually high annual returns anytime soon, given that 2021’s historic returns were largely fueled by $5 trillion in federal stimulus funds—primarily provided through the Coronavirus Aid, Relief, and Economic Security Act in 2020 and the American Rescue Plan Act of 2021—meant to bolster the U.S. economy during the COVID-19 pandemic.

Federal stimulus of $5 trillion spurred the stock market rally that began in spring 2020 and that drove asset valuations to a near all-time high. This indicates that expected high GDP growth during the economic recovery has already been priced into the market and is reflected in current stock prices, which, in turn, strongly suggests lower stock market returns over the next two decades as prices and GDP growth revert to long-run expectations. Pension funds should anticipate a dampening effect on their equity returns as a result.

The long-term decline in interest rates is a key driver of lower expected market returns. Ten-year Treasury bonds, which are commonly used as a benchmark for interest rates, are currently at a 50-year low, and economic forecasts expect rates to remain well below 3% for the foreseeable future, which is significantly lower than the previous 50-year average of nearly 6%. Fixed-income investments make up more than a quarter of pension fund assets across the 50 states and generally yield returns that track closely with interest rates.

Even with the stock market gains in recent years, public pension fund returns over the past 20 years are at 7%, about the same as the 2021 median assumed rate of return—the rate that plan administrators use to calculate long-term estimates for the value of their assets and liabilities— for the 73 funds studied. And with equity valuations near a 20-year high, interest rates near a 20-year low, and expected nominal GDP growth below 4%, most economists, wealth managers, and other specialists expect average future returns closer to 6%.5

Growth in GDP and bond yields form the building blocks of investment returns, and market experts expect both to lag historical averages and outlooks issued before the pandemic. For example, from 1988 to 2008, U.S. GDP grew more than 5.5%, but post-COVID-19 forecasts are nearly 2 percentage points lower.
Similarly, although investment-grade bond yields averaged about 6.5% over the same 20-year period, market analysts project significantly lower future yields. Pew forecasts that lower GDP growth and bond yields will mean that typical pension fund portfolios yield total returns of only 6% post-COVID-19, down from 6.4% pre-COVID-19.
Pension plans and their boards could reasonably set their return targets between 6% and 7%, based on median pension fund returns forecasts of about 6% and the historical 20-year performance of 7%.

The risk premium for public funds—the difference between U.S. bond yields and the average plan’s assumed return—illustrates the dramatic increase in U.S. public pension plans’ exposure to financial market uncertainty over the past 25 years. Between 1992 and 2019, the expected equity risk premium increased from less than 1% to almost 5%, as bond yields declined and the assumed rates of return remained relatively stable. In other words, plans’ equity premium has grown by over 3 percentage points— more than fourfold over the period from 1992 to 2019.

Likewise, the median assumed rate of return across funds has fallen over the past decade by nearly a full percentage point. This change brings pension plan expectations more in line with market expectations for returns and inflation. In 2019, the median assumed rate of return was 7.25%. However, pension plans may expect a long-run average return closer to 6%, according to Pew’s market analysis.

Fund administrators and trustees should regularly review and adjust their assumed rates of return in light of declining expectations of future investment performance. States have continued to decrease their return assumptions in response to downward market trends; 46 states lowered their assumed rates of return from 2014 to 2019.


Even when the measurement period is sufficiently long to minimize the role of good timing and luck, the performance of state pension funds varies significantly. A typical state fund that uses net-of-fee reporting saw 8.5% returns over the past decade, the longest available period for most funds.
Meanwhile, over the same 10-year span, funds that performed in the bottom quarter (25th percentile) of net-of-fee reporters earned an average 7.75% return, with the worst-performing fund earning 6.7% returns. That single percentage point difference adds up to billions of dollars annually for low-performing funds.
Similar results were found for the smaller set of funds that use grossof-fee reporting. These funds’ reported returns are higher—9.1% at the median—than those of net-of-fee reporters because the former do not net out the cost of investments, but the bottom quarter still performed at least a third of a percentage point below that median return.

Plans reported more than $24 billion in fees and investment expenses in 2019, with a 50-state average of 0.35% of investments, a 30% increase in costs since 2006. This reflects in part the increasing allocations to expensive alternative investments over that span. However, fee reporting differs widely among funds. Georgia’s plan reports some of the lowest fees at 0.05% of assets, while South Carolina reports the highest: 1.05% of assets.
The variation reflects the diversity in how funds use expensive alternative investments and how comprehensive they are in reporting fees. For example, South Carolina is one of the five states—with California, Missouri, New York, and North Carolina—that report the most thorough set of costs, including private equity performance fees that many funds omit.
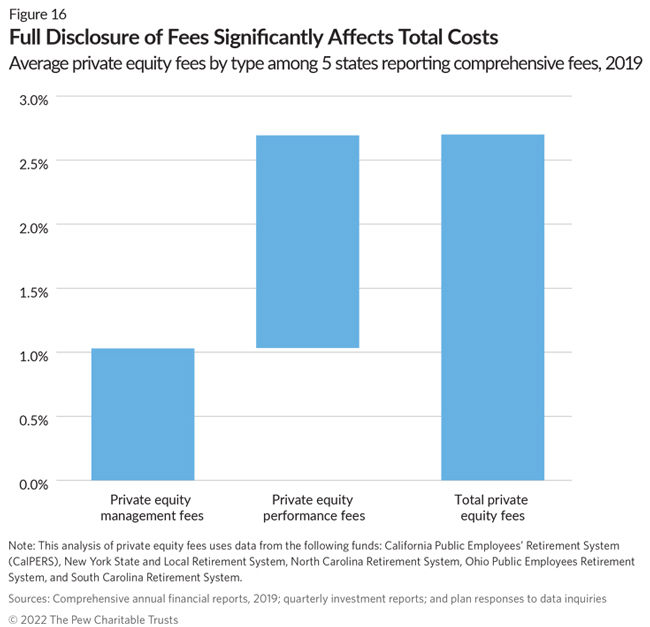
Reporting returns less fees is critical to transparency, particularly with many state pension funds making significant investments in high-cost alternative assets. Five funds that report comprehensive fees on their private equity investments include accrued carried interest (performance fees) that often goes unreported. These funds’ fees on private equity exceeded 2% of their holdings’ value, with an average total cost of nearly 2.75%; South Carolina and California reported private equity fees of more than 3% for 2019.
Investment strategy and private equity portfolio differences make cross-state comparisons difficult, but Pew and external experts observe that private equity performance fees average 1.5% of assets, which is more than four times the average reported fee level across all asset classes.6 In all cases, private equity performance fees are significantly higher than the invoiced management fees that funds must report.
Conclusion
Three quarters of state pension fund investments are allocated to risky, high-fee assets, which must be scrutinized for transparent reporting; in addition, historic stock market returns are unlikely to continue. In this environment, plan administrators, fiduciaries, and policymakers who select and oversee investment strategies must understand the effect of market volatility on plan assets and government budgets.
Access to clear data explaining pension funds’ investment strategies, market performance, and fees paid is necessary to effectively govern plans and properly steward the trillions of dollars in public assets that pay for promised benefits for workers and retirees. Clear disclosures and full reporting provide stakeholders with the information they need to assess how pension assets are being managed and whether plan investment strategies are appropriately balancing risk, returns, and costs.
Data sources
Pew researchers used three sources covering the 73 largest state-sponsored pension funds, which account for about 95% of all state pension fund investments and collectively managed nearly $4 trillion in assets in 2019, to examine changing investment practices across the 50 states:
- State-sponsored plans’ data, including Comprehensive annual financial reports, actuarial valuations, and other relevant documents published by individual public pension plans from 1992 to 2019, with a focus on asset allocation, performance, and fees from 2006 to 2019.
- U.S. Federal Reserve Financial Accounts of the United States data, including aggregate economic and investment data on public pensions from 1954 to 2019.
- Wilshire Trust Universe Comparison Service performance comparison data, reported quarterly from 1981 to 2021.
These data sets provide a 60-year snapshot of aggregate investment trends and a detailed look at investment practices from 2006 to 2019 across most state public pension funds.
Endnotes
- United States Census Bureau, 2019 Annual Survey of Public Pensions: State & Local Tables, accessed March 1, 2022, https://www.census.gov/data/tables/2019/econ/aspp/aspp-historicaltables. html.
- S&P Dow Jones Indices, S&P 500, Jan. 1, 2020-June 30, 2021, accessed March 1, 2022, https://www.spglobal.com/spdji/en/indices/equity/sp-500/#overview.
- The Pew Charitable Trusts, “The State Pension Funding Gap: Plans Have Stabilized in Wake of Pandemic” (2021), https://www.pewtrusts.org/-/media/assets/2021/09/the_state_pension_funding_gap.pdf.
- Data was collected from the 73 largest state-sponsored pension funds, which manage about 95% of all state pension fund investments.
- See P. Zemsky et al., “2022 Capital Market Assumptions” (Voya Investment Management, 2021), https://institutional.voya.com/system/files/article/file/IM%20Capital%20Markets%20Assumptions%202022%20Final.pdf; J.P. Morgan Asset Management, “Long-Term Capital Market Assumptions” (2022), https://am.jpmorgan.com/content/dam/jpm-am-aem/global/en/insights/portfolio-insights/ltcma/ltcma-full-report.pdf; Wilshire, “2022 Asset Allocation Return & Risk Assumptions” (2021), https://assets-global.website-files.com/60f8038183eb84c40e8c14e9/61f17b14d7b27330b8d698a9_Wilshire-2022-Asset-Allocation-Return-and-Risk-Assumptions.pdf.
- A. Dang, M. Heale, and D. Dupont, “The Time Has Come for Standardized Total Cost Disclosure for Private Equity” (CEM Benchmarking Inc., 2015), https://caia.org/sites/default/files/AIAR_Q3_2015-04_PrivateEquity_DangDupontHeale.pdf.
ADDITIONAL RESOURCES


