Time Served in South Dakota
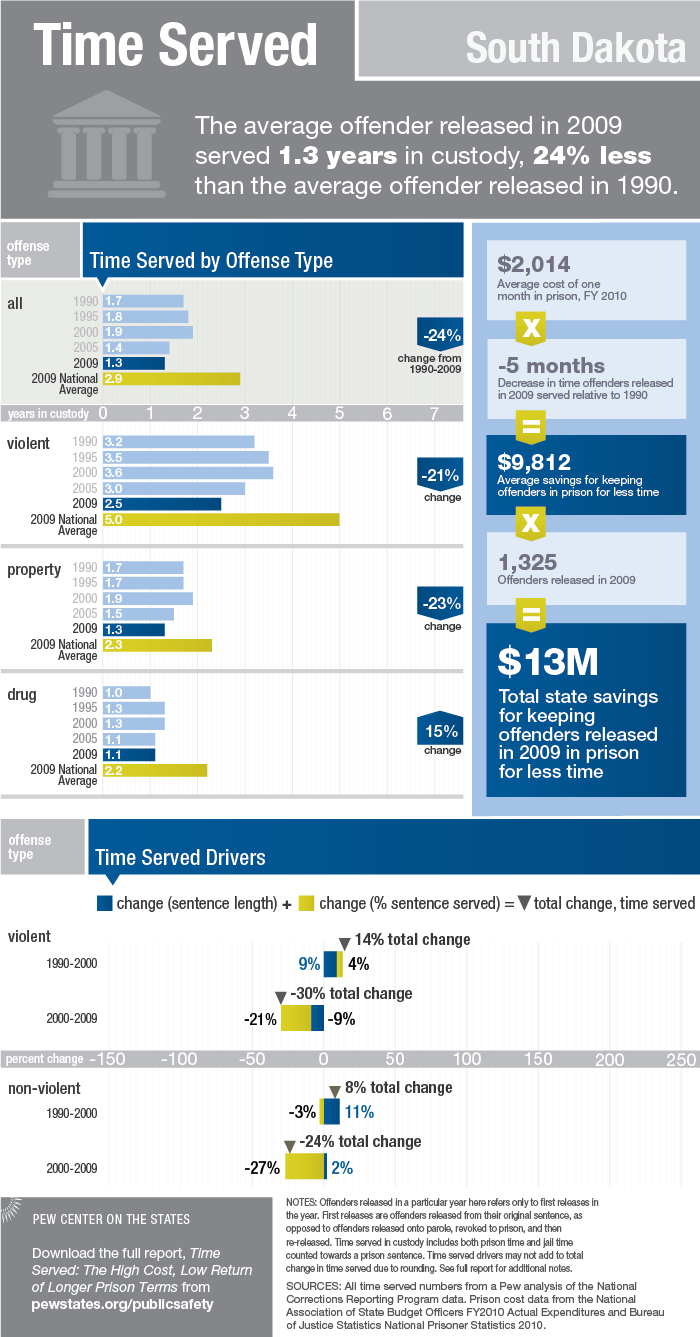
* NOTES: Offenders not fitting into the violent, property, or drug categories (such as offenders convicted of quality of life and weapons offenses) were included in the total calculations but are not presented as a separate category. In South Dakota, these non-categorized offenders made up 35 percent of the 2009 release cohort (versus only 16 percent nationally). These offenders served the shortest average LOS in 2009, and made up a much larger percentage of the release cohort in 2009 than in 1990, accounting for the steeper decline in overall time served than in time served for violent, property, or drug offenders.
Spotlight on Mental Health
ADDITIONAL RESOURCES

Article

Data Visualization


Explore Pew’s new and improved
Fiscal 50 interactive

Your state's stats are more accessible than ever with our new and improved Fiscal 50 interactive:
- Maps, trends, and customizable charts
- 50-state rankings
- Analysis of what it all means
- Shareable graphics and downloadable data
- Proven fiscal policy strategies
Welcome to the new Fiscal 50
Key changes include:
- State pages that help you keep track of trends in your home state and provide national and regional context.
- Interactive indicator pages with highly customizable and shareable data visualizations.
- A Budget Threads feature that offers Pew’s read on the latest state fiscal news.