Employer-based Retirement Plan Access and Participation across the 50 States

Who’s in, who’s out

Employer-based Retirement Plan Access and Participation

A data visualization from

Download resources

Overview

Workers in the United States accumulate the vast majority of their retirement savings through employer-based plans, but large gaps in coverage exist. Pew’s analysis shows that more than 30 million workers report they do not have access to an employer-based retirement plan.

The data, drawn from federal sources, show significant differences in access and participation across the states. For example, the share of workers in Wisconsin participating in employer-based plans, such as pensions or 401(k)s, was more than 20 percentage points higher than in Florida.

This data visualization shows how employer-based retirement plan access and participation vary among states and by characteristics such as employer size, industry, and wage and salary. The analysis focuses on full-time, full-year, private sector wage and salary workers, ages 18 to 64. Users can click through the various tabs to obtain information of interest and create printable state-level summaries.

Key Findings

{{ showKeyFindings ? '–' : '+' }}

{{ currentMapHeadline }}

VT
NH
MA
RI
CT
NJ
DE
MD
{{ minValue * 100 | number:0 }}%
{{ maxValue * 100 | number:0 }}%

Select a rate

Select a subgroup

Clear subgroup selection

{{ showNotes ? '–' : '+' }} Notes


The access and participation data in these tables are from the pooled 2010-14 Integrated Public Use Microdata Series (IPUMS) version of the Current Population Survey (CPS). The CPS is a monthly U.S. household survey sponsored jointly by the U.S. Census Bureau and the U.S. Bureau of Labor Statistics. Information is self-reported and subject to other sources of error. In our state-by-state fact sheets, we supplement the IPUMS data with information from the Financial Industry Regulatory Authority (FINRA) Investor Education Foundation’s 2012 Financial Capability Study and the U.S. Census Bureau’s Statistics of U.S. Businesses (SUSB). See the downloadable methodology for a full description of the data, their limitations, and our analysis approach.
NA - Not shown due to reliability concerns based on sample size or relative standard error.

Key national findings

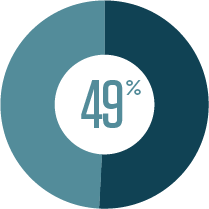
About half of workers in the analysis were not participating in a workplace retirement plan
49 percent
Overall, 58 percent of the workers had access to a plan, and 49 percent were participating.
The range in both access and participation across the states was over 20 percentage points
Highest participation rates:
  • Wisconsin
  • Minnesota
  • Iowa
Lowest participation rates:
  • Florida
  • Nevada
  • New Mexico
Access and participation varied based on factors such as employer size and industry
500 or more employees < 10 employees
74% 22%
access
rate
access
rate
Retirement plan access and participation also differed by individual characteristics such as wage and salary income, age, education, and race and ethnicity
White, Non-Hispanic Hispanic
63% 38%
access
rate
access
rate
Employer and individual characteristics varied across the states, factors that contribute to differing rates of access and participation.
For example, more than one-quarter of workers in New Mexico, California, Texas, and Arizona were Hispanic, compared with less than 5 percent in many other states.

Access and Participation Rates

Select a state above to view rates.
{{ state.pctAllAccess | percent:1:true }}% {{ state.pctAllParticipation | percent:1:true }}% {{ state[currentGenderMobile.value + 'Access'] | percent:1:true }}% {{ state[currentGenderMobile.value + 'Participation'] | percent:1:true }}% {{ state[currentEducationMobile.value + 'Access'] | percent:1:true }}% {{ state[currentEducationMobile.value + 'Participation'] | percent:1:true }}% {{ state[currentIncomeMobile.value + 'Access'] | percent:1:true }}% {{ state[currentIncomeMobile.value + 'Participation'] | percent:1:true }}% {{ state[currentIndustryMobile.value + 'Access'] | percent:1:true }}% {{ state[currentIndustryMobile.value + 'Participation'] | percent:1:true }}% {{ state[currentSizeMobile.value + 'Access'] | percent:1:true }}% {{ state[currentSizeMobile.value + 'Participation'] | percent:1:true }}% {{ state[currentRaceMobile.value + 'Access'] | percent:1:true }}% {{ state[currentRaceMobile.value + 'Participation'] | percent:1:true }}% {{ state[currentAgeMobile.value + 'Access'] | percent:1:true }}% {{ state[currentAgeMobile.value + 'Participation'] | percent:1:true }}%
Access rate Participation rate

{{ showNotes ? '–' : '+' }} Notes

The access and participation data in these tables are from the pooled 2010-14 Integrated Public Use Microdata Series (IPUMS) version of the Current Population Survey (CPS). The CPS is a monthly U.S. household survey sponsored jointly by the U.S. Census Bureau and the U.S. Bureau of Labor Statistics. Information is self-reported and subject to other sources of error. In our state-by-state fact sheets, we supplement the IPUMS data with information from the Financial Industry Regulatory Authority (FINRA) Investor Education Foundation’s 2012 Financial Capability Study and the U.S. Census Bureau’s Statistics of U.S. Businesses (SUSB). See the downloadable methodology for a full description of the data, their limitations, and our analysis approach.
NA Not shown due to reliability concerns based on sample size or relative standard error.

Access and Participation by State, Region, and Metropolitan Statistical Area

Access and Participation Rates

{{ showAccessParticipation ? '–' : '+' }}
{{ state.state }}  
{{ state.pctAllAccess | percent:1:true }}%
{{ state.pctAllParticipation | percent:1:true }}%
{{ value[0].region }}
{{ state.state }}  
{{ state.pctAllAccess | percent:1:true }}%
{{ state.pctAllParticipation | percent:1:true }}%
{{ msa.state }}  
{{ msa.pctAllAccess | percent:1:true }}%
{{ msa.pctAllParticipation | percent:1:true }}%
All reported digits are rounded, entries are ordered using precise digits.

State Data

{{ showStateData ? '–' : '+' }}
Select a state above to view data.
Workers in the United States accumulate the vast majority of their retirement savings through employer-based plans, but large gaps in coverage exist. The data show significant differences in access and participation across the states. In {{ state.state }}, more than {{ state.numNoAccess | number:0 }} full-time, full-year, private-sector wage and salary workers lack access to a retirement savings plan or a pension through their employer.
{{ state.pctAllAccess | percent:1:true }}% {{ state.pctAllParticipation | percent:1:true }}% {{ state.pctAllTakeup | percent:1:true }}%
of workers have access to a workplace retirement plan (#{{ state.rankNoAccess }} out of 50 states) of workers are participating in a workplace retirement plan (#{{ state.rankParticipation }} out of 50 states) of workers with access to a workplace plan are participating (take-up rate)

Retirement Plan Access and Participation

  • Access
  • Participation
Total
All full-time, full-year, private-sector wage and salary workers ages 18-64 (selfemployed excluded)
{{ state.pctAllAccess | percent:1:true }}%
{{ state.pctAllParticipation | percent:1:true }}%
Firm Size
< 10 employees
{{ state.size0to9Access | percent:1:true }}%
{{ state.size0to9Participation | percent:1:true }}%
10-49 employees
{{ state.size10to49Access | percent:1:true }}%
{{ state.size10to49Participation | percent:1:true }}%
50-99 employees
{{ state.size50to99Access | percent:1:true }}%
{{ state.size50to99Participation | percent:1:true }}%
100-499 employees
{{ state.size100to499Access | percent:1:true }}%
{{ state.size100to499Participation | percent:1:true }}%
500+ employees
{{ state.sizeOver500Access | percent:1:true }}%
{{ state.sizeOver500Participation | percent:1:true }}%
Age
Ages 18-29
{{ state.age18to29Access | percent:1:true }}%
{{ state.age18to29Participation | percent:1:true }}%
Ages 30-44
{{ state.age30to44Access | percent:1:true }}%
{{ state.age30to44Participation | percent:1:true }}%
Ages 45-64
{{ state.age45to64Access | percent:1:true }}%
{{ state.age45to64Participation | percent:1:true }}%
Wage and Salary Income
Less than $25,000
{{ state.incomeUnder25KAccess | percent:1:true }}%
{{ state.incomeUnder25KParticipation | percent:1:true }}%
$25,000 to $49,999
{{ state.income25to49KAccess | percent:1:true }}%
{{ state.income25to49KParticipation | percent:1:true }}%
$50,000 to $99,999
{{ state.income50to99KAccess | percent:1:true }}%
{{ state.income50to99KParticipation | percent:1:true }}%
$100,000+
{{ state.incomeOver100KAccess | percent:1:true }}%
{{ state.incomeOver100KParticipation | percent:1:true }}%
Note: Estimates are based on a pooled 2010-14 IPUMS-CPS file, with the exception of the “Firm Size” analysis, which includes only 2011-14 data because of changes in the categories over time. The estimated size of the population lacking access to a retirement plan is rounded down and refers only to full-time, full-year, private-sector wage and salary workers ages 18-64.
Source: Sarah Flood et al., Integrated Public Use Microdata Series, Current Population Survey: Version 4.0 (machine-readable database,Minneapolis: University of Minnesota, 2015), https://cps.ipums.org/cps.

Financial Capability

Dollar bills Calculator Thumbs up
{{ state.canGet2KNextMonth | percent:1:true }}% {{ state.calculatedRetirement | percent:1:true }}% {{ state.satisfiedFinancialCondition | percent:1:true }}%
Are certain they could come up with $2,000 if an unexpected need arose in the next month* Have ever tried to figure out how much they need to save for retirement Are satisfied with their current personal financial condition when thinking of assets, debts, and savings*
* All respondents in the state.
All non-retired respondents in the state.

Source: FINRA Investor Education Foundation, National Financial Capability Study (2012), http://www.usfinancialcapability.org.

Employment by Size of Firm

  • {{ state.size0to9Employment | percent:1:true }}%
  • {{ state.size10to49Employment | percent:1:true }}%
  • {{ state.size50to99Employment | percent:1:true }}%
  • {{ state.size100to499Employment | percent:1:true }}%
  • {{ state.sizeOver500Employment | percent:1:true }}%
Number of employees
  • < 10
  • 10-49
  • 50-99
  • 100-499
  • 500+
Source: U.S. Census Bureau, Statistics of U.S. Businesses (2012), http://www.census.gov/econ/susb/.


Additional Resources

America’s Overdose Crisis

America’s Overdose Crisis

Sign up for our five-email course explaining the overdose crisis in America, the state of treatment access, and ways to improve care

Sign up
Quick View

America’s Overdose Crisis

Sign up for our five-email course explaining the overdose crisis in America, the state of treatment access, and ways to improve care

Sign up
Composite image of modern city network communication concept

Learn the Basics of Broadband from Our Limited Series

Sign up for our four-week email course on Broadband Basics

Quick View

How does broadband internet reach our homes, phones, and tablets? What kind of infrastructure connects us all together? What are the major barriers to broadband access for American communities?

What Is Antibiotic Resistance—and How Can We Fight It?

Sign up for our four-week email series The Race Against Resistance.

Quick View

Antibiotic-resistant bacteria, also known as “superbugs,” are a major threat to modern medicine. But how does resistance work, and what can we do to slow the spread? Read personal stories, expert accounts, and more for the answers to those questions in our four-week email series: Slowing Superbugs.