Where States Get Their Money

FY 2015

Note: This research has been updated with new data. For the latest data, visit: http://www.pewtrusts.org/en/research-and-analysis/data-visualizations/2018/where-states-get-their-money.

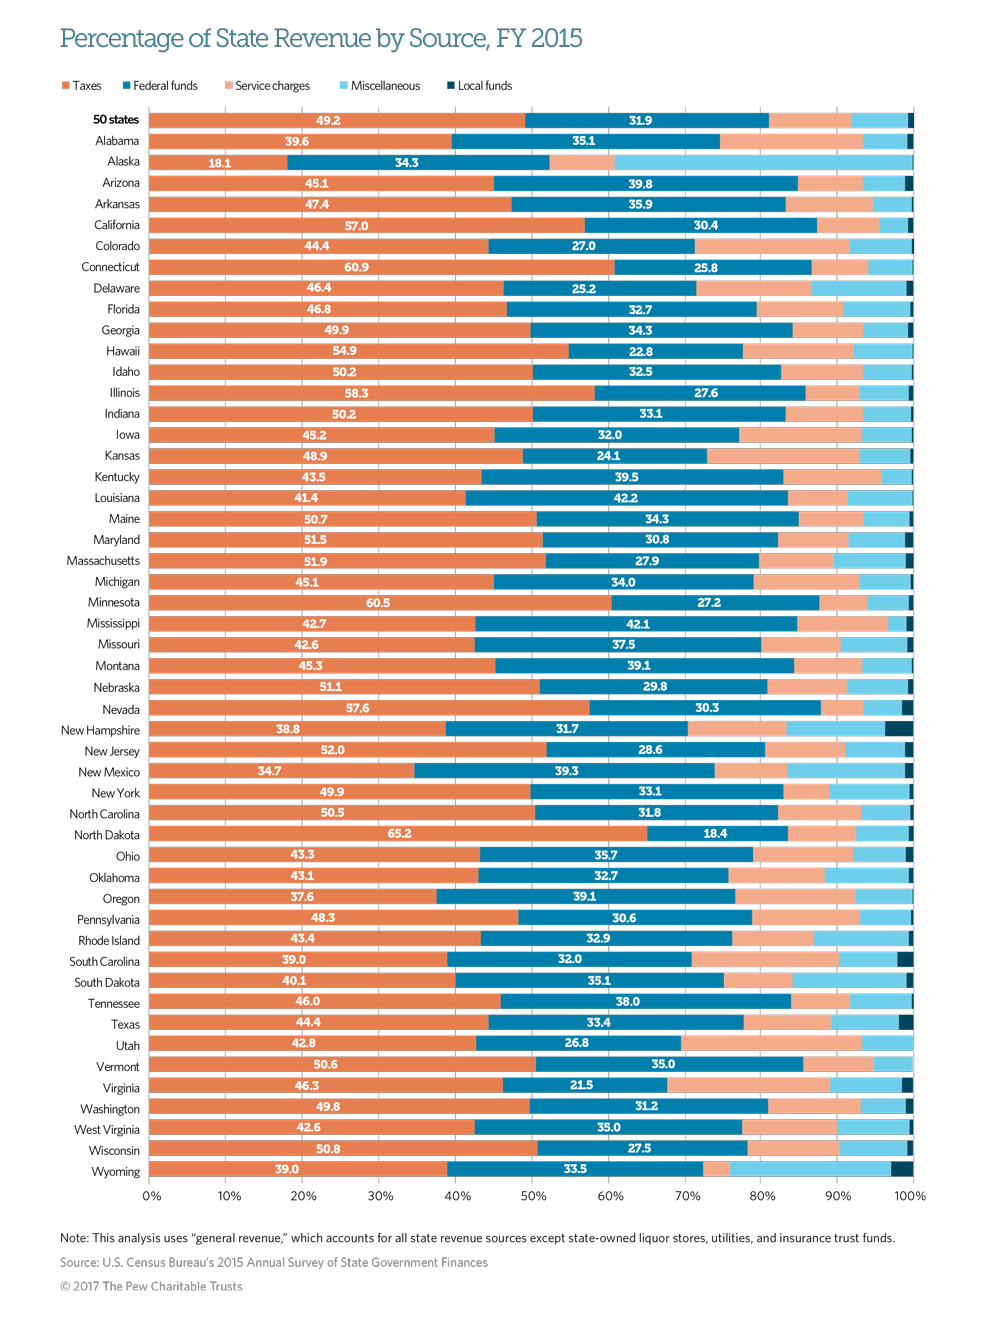
Taxes and federal funds together account for 81 percent of revenue for the 50 states. Taxes are the largest revenue source in 46 states, while federal funds are greatest in three. But neither is the primary contributor to government coffers in one state: Alaska. This infographic displays a breakdown of each state’s revenue, by major categories. See downloadable data for other percentages.

Data Visualization

Fiscal 50: State Trends and Analysis

Quick View
Data Visualization

Fiscal 50 is an interactive platform that provides clear, data-driven portraits of state fiscal conditions. Users can view, sort, and analyze data on key trends that shape states’ fiscal health now and over the long term. Fiscal 50 also features research and analysis to help users understand how these trends interact and fit together—and how they relate to real-time developments playing out in state capitols across the country.

Spotlight on Mental Health

Composite image of modern city network communication concept

Learn the Basics of Broadband from Our Limited Series

Sign up for our four-week email course on Broadband Basics

Quick View

How does broadband internet reach our homes, phones, and tablets? What kind of infrastructure connects us all together? What are the major barriers to broadband access for American communities?

What Is Antibiotic Resistance—and How Can We Fight It?

Sign up for our four-week email series The Race Against Resistance.

Quick View

Antibiotic-resistant bacteria, also known as “superbugs,” are a major threat to modern medicine. But how does resistance work, and what can we do to slow the spread? Read personal stories, expert accounts, and more for the answers to those questions in our four-week email series: Slowing Superbugs.

Explore Pew’s new and improved
Fiscal 50 interactive

Your state's stats are more accessible than ever with our new and improved Fiscal 50 interactive:

  • Maps, trends, and customizable charts
  • 50-state rankings
  • Analysis of what it all means
  • Shareable graphics and downloadable data
  • Proven fiscal policy strategies

Explore

Welcome to the new Fiscal 50

Key changes include:

  • State pages that help you keep track of trends in your home state and provide national and regional context.
  • Interactive indicator pages with highly customizable and shareable data visualizations.
  • A Budget Threads feature that offers Pew’s read on the latest state fiscal news.

Learn more about the new and improved Fiscal 50.