Federal Defense Spending Varies Widely Across States
Policymakers should consider relative impacts as they debate changes
This page was updated March 02, 2018, to correct the federal defense spending total and state and national per-capita rates. For the latest research on this topic, please see Wide Variation in Federal Defense Spending From State to State.
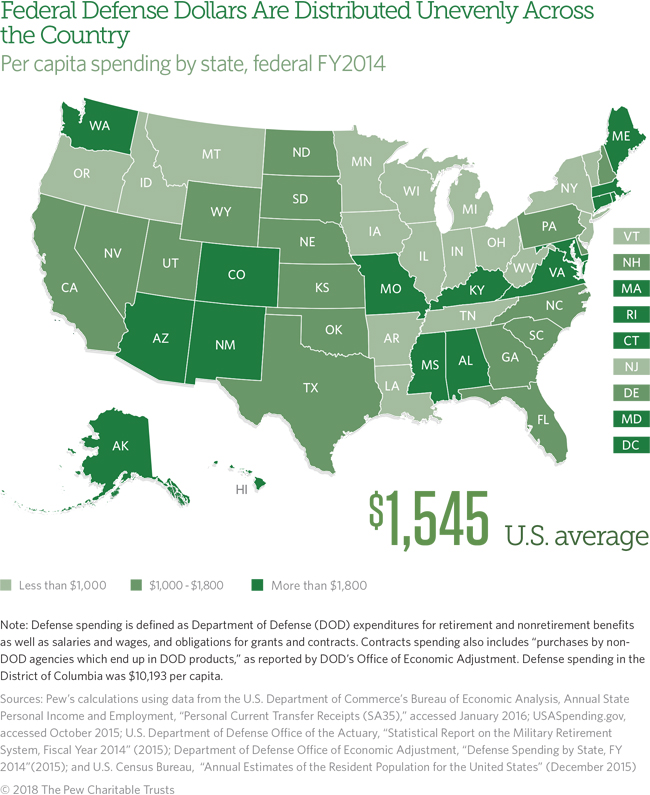
The U.S. government spends defense dollars in every state through purchases of military equipment, wages for service members and civilians, pension payments, health care services, and grants to states. But the size of those investments varies substantially across the states, so changes in defense spending will affect them differently, and the impacts will depend on which programs and operations are increased or cut. As Congress and the Trump administration discuss the federal budget, the distribution of defense dollars will be watched closely by the states.
In 2014, federal defense spending totaled $493 billion, or $1,545 per person nationally, and ranged from $430 per capita in West Virginia to $7,336 in Virginia.
Categories of defense spending:
- Retirement benefits, which are payments to individuals for military pensions.
- Nonretirement benefits, which are payments for health care provided through the military’s TriCare Management Program.
- Grants, which include funding to state and local governments for programs such as National Guard activities, Medical Research and Development, and Basic and Applied Scientific Research.
- Contracts for purchases of goods and services, such as military equipment, information technology, and operations and maintenance programs.
- Salaries and wages for active-duty military, civilian, reserve, and National Guard personnel.
Anne Stauffer is director of and Justin Theal is a senior associate with The Pew Charitable Trusts’ fiscal federalism initiative.

ADDITIONAL RESOURCES


