Flooding Threatens Public Schools Across the Country
Infrastructure analysis evaluates county-level flood risk
Overview
Flooding is the most costly and common natural disaster in the United States, affecting every region. Last year alone, 36 presidentially declared flood-related disasters inundated 24 states, costing billions of dollars. In addition to homes, these coastal and inland floods damaged roads, bridges, hospitals, and another critical part of communities: schools.
Severe flooding can force schools to close, and buildings can be badly damaged. Learning is disrupted, along with families’ daily lives. And in a storm’s aftermath, communities can face steep repair costs. The floods in West Virginia in June 2016, for example, caused $130 million in damage to regional schools.1
The devastation that many public schools sustain due to floods is compounded by their age and condition. More than half of our public schools were built in the last century for the baby boomer generation. As with other aging infrastructure, many were simply not designed to withstand severe weather or the changing patterns of land use and demographics.
The Pew Charitable Trusts examined flood risks that schools across the country face. It developed an overall flood risk score for counties to determine the vulnerability of their schools. The chartbook also offers recommendations for helping schools—and the communities that depend on them—be more prepared to withstand the impact of storms and hurricanes.
Key findings
Pew and research partner ICF analyzed U.S. public elementary and secondary school data to develop a county-level composite flood risk score for schools in all 50 states. Three indicators make up this score: a school’s location within a designated flood zone, the percentage of a school’s neighborhood (as represented by ZIP code) located within a flood zone, and the number of historical flood-related federal disaster declarations in that county.
These are the key findings from the analysis:
- The risk of school flooding is distributed widely across the United States. The Atlantic Coast, Gulf Coast, Mississippi River corridor, and southwestern Arizona have the highest composite flood risk scores.
- Schools in both inland and coastal counties have high composite flood risk scores. Those in coastal counties with the highest composite flood risk scores are Monroe County, Florida; Hyde County, North Carolina; Cameron Parish, Louisiana; Poquoson City, Virginia; and Tyrrell County, North Carolina. The inland counties are Alexander County, Illinois; Maricopa County, Arizona; Crittenden and Mississippi counties in Arkansas; and Tunica County, Mississippi.
- The 100 counties with the highest composite flood risk scores include 6,444 schools that serve nearly 4 million students.
- 2,247 schools (out of 84,123 with available data) are located in areas subject to flooding that has a 1 percent chance of being equaled or exceeded in any year. The South Atlantic region has the highest proportion of schools located in a flood zone.
- Even when a school is not located in a flood zone, students who attend it often live within areas of flood risk. Of more than 5,000 schools, half or more of the ZIP code is located in a designated 1 percent annual chance flood zone.

Low funding for infrastructure and mitigation compounds risk
When flooding damages community infrastructure such as schools, local, state, and federal entities may share the cost and responsibility for any repairs. While local authorities often feel the impacts most acutely, when events overwhelm state capacity and a major disaster is declared, the federal government can provide additional support. For example, states often rely on the Federal Emergency Management Agency (FEMA) for disaster assistance to repair, restore, and replace damaged infrastructure and community facilities. Other federal agencies also provide emergency management and school preparedness assistance.2 To reduce risk ahead of time, states and communities can take advantage of FEMA’s pre-disaster mitigation grant program.
Despite such efforts and rising flood risks, investments in resilient infrastructure and mitigation activities have historically been insufficient to meet demand. Over the past 35 years, federal investment in infrastructure has dropped from 1 percent to 0.5 percent of gross domestic product. And while the federal government spent $277.6 billion from 2005 to 2014 on disaster assistance, spending on FEMA’s pre-disaster mitigation grant program accounted for less than $600 million of this amount.3 These years of underinvesting have left much of America’s infrastructure, including schools, dangerously close to failing, according to a March 2017 report by the American Society of Civil Engineers. It estimated that the annual funding gap for maintaining schools is $38 billion.4
Recommendations
Designing communities, including schools, to withstand future floods can help reduce the human impact and the high cost of rebuilding that typically follows natural disasters. This is especially critical given that researchers anticipate that areas currently at high risk of flooding in riverine and coastal communities will expand by 45 and 55 percent, respectively, by the end of the century.5 Analysis from FEMA found that every dollar invested to reduce disaster risk saves the nation an average of $4 in benefits.6 By making smart decisions now, policymakers can help reduce potential impacts on schools while greatly cutting the expense of post-storm rebuilding.
Policymakers should consider taking these measures:
- Modernize maps: Location is central to understanding and planning for flood risks. While FEMA flood maps do not portray all areas that could flood, they offer an important starting point for assessing risk and local decision-makers rely on the expertise of federal agencies for such information. FEMA must work with states and communities to ensure that they have up-to-date flood maps, and Congress should provide adequate funding for this purpose.
- Leverage federal assistance: Federal agencies, including FEMA, the National Oceanic and Atmospheric Administration, and the Army Corps of Engineers, should continue to provide local decision-makers with the technical know-how to help them better understand flood risks for their schools.
- Develop pre-disaster plans for schools: The federal government requires communities and states that seek federal funding to proactively develop hazard mitigation plans. These should incorporate strategies for siting, upgrading, and managing facilities to reduce future risk. In addition, requirements for flood insurance should be enforced to protect federal investments.
- Rebuild smarter with federal dollars: When communities leverage federal funds to rebuild or repair damaged infrastructure, these investments must account for future risk. Where feasible, they should consider relocating schools out of flood-prone areas.
The three indicators examined in this study provide a national analysis of flood risk, and do not capture actions that individual schools, districts, or other entities may be taking to reduce risk or increase school resilience.
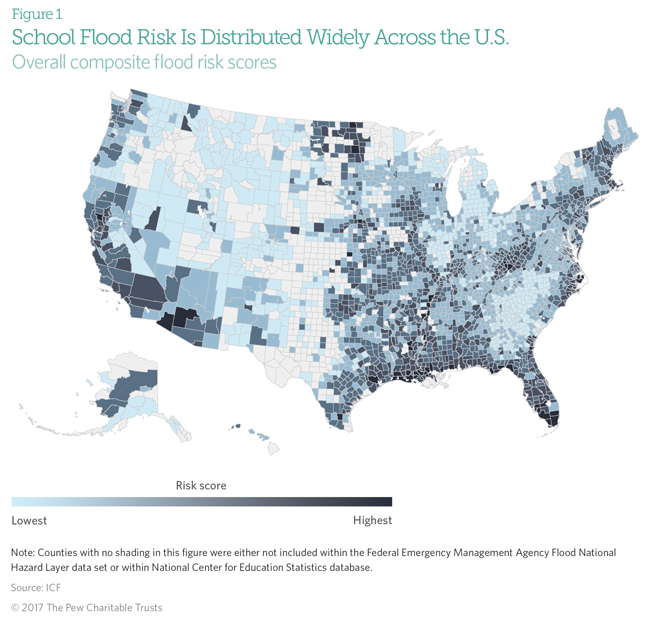
Schools in every state across the country face flood risks. Counties along the Atlantic Coast, Gulf Coast, and Mississippi River corridor and in southwestern Arizona have the highest composite flood risk scores nationwide. Counties in Alaska, Michigan, and the Mountain West have the lowest.
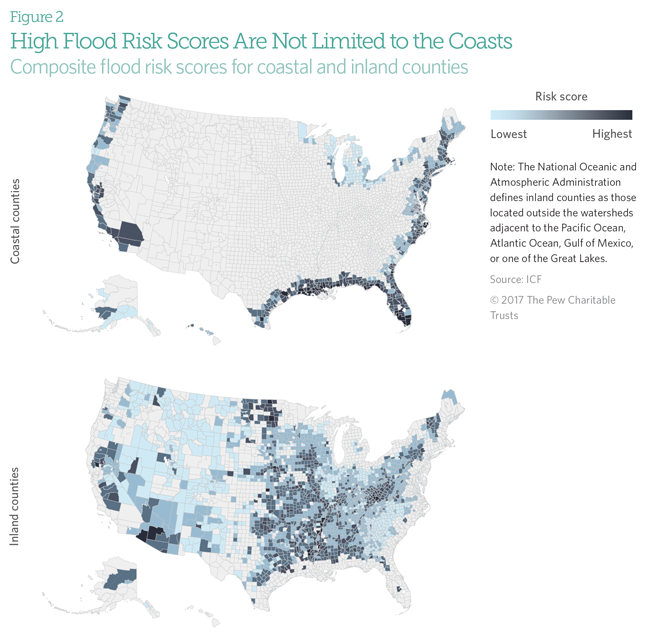
Flood risk is not limited to coastal areas. Inland counties with the highest composite flood risk scores include Alexander County, Illinois; Maricopa County, Arizona; Crittenden and Mississippi counties in Arkansas; and Tunica County, Mississippi. Of the 2,186 inland counties in the United States, 435 have composite flood risk scores in the top 25 percent. In all, 3,303 inland county schools, serving more than 1.6 million students, are located in a flood zone. The coastal locations with high overall composite flood risk scores are coastal Louisiana, North Carolina, and South Florida.
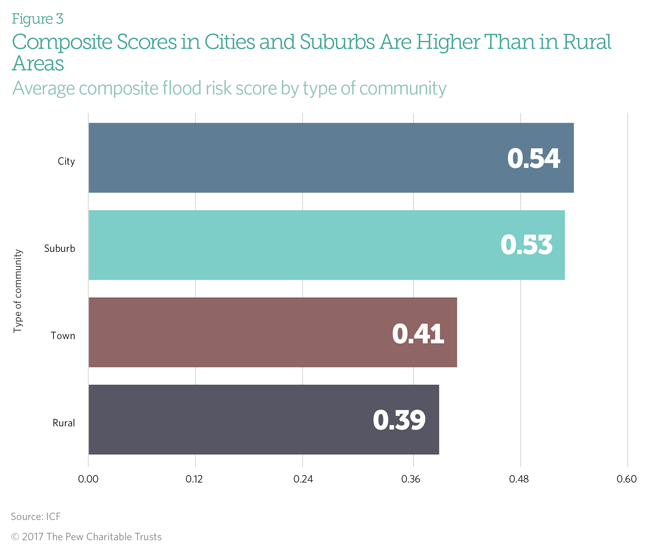
While composite flood risk scores in suburbs and cities are higher than in rural areas, a geographic breakdown shows that all types of areas are vulnerable to flooding. The higher composite flood risk scores in suburbs and cities are driven by slightly higher percentages of school ZIP codes in a flood zone and larger numbers of historical disaster declarations.
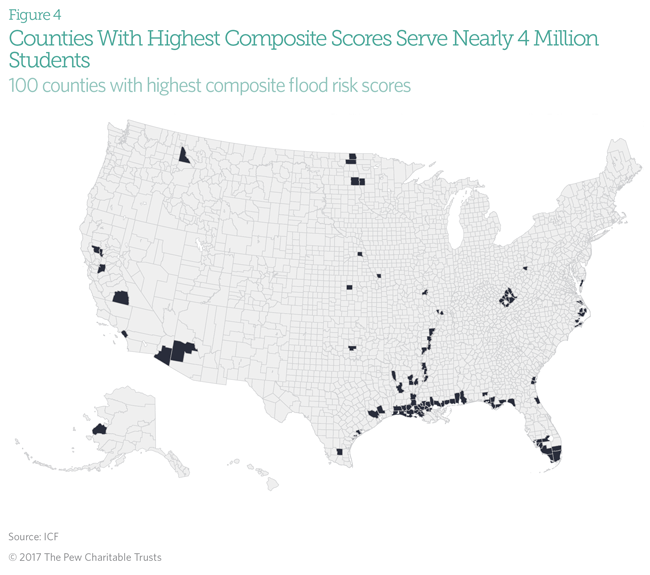
The 100 counties with the highest composite flood risk scores are in 23 states. These counties have 6,444 schools serving almost 4 million students. Louisiana has the highest number of these counties, with 24 in the top 100.
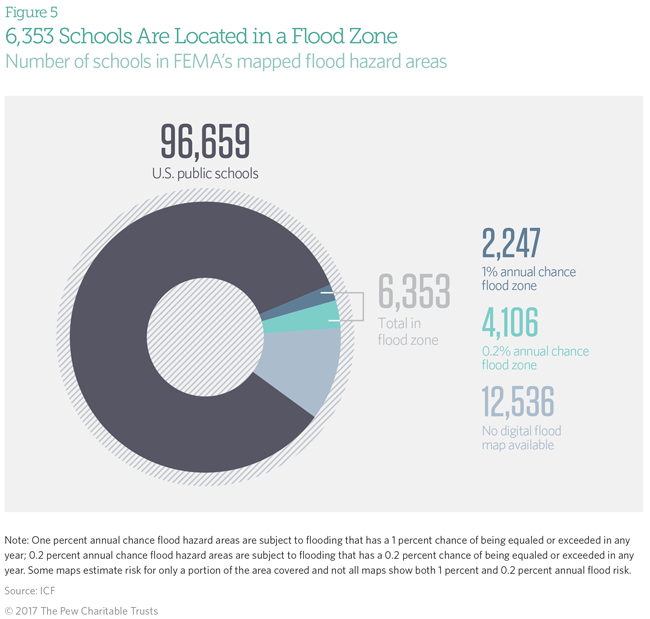
Of the 96,659 public schools in the United States, 2,247 are located in the 1 percent annual chance flood zone. More than 1 million students attend these schools. In addition, 4,106 schools serving 2.5 million students are located in the 0.2 percent annual chance flood zone. The South Atlantic region has the highest proportion of schools located in these two zones.
By comparison, 3,574 schools are located outside a flood zone but lie within the 100 counties with the highest composite risk scores. (See Figure 4).
The South Atlantic region (Florida, Georgia, North Carolina, and South Carolina) has the greatest percentage of schools and student populations located in the 1 percent annual chance flood zone. The region has 552 schools in that flood zone, serving 312,600 students.
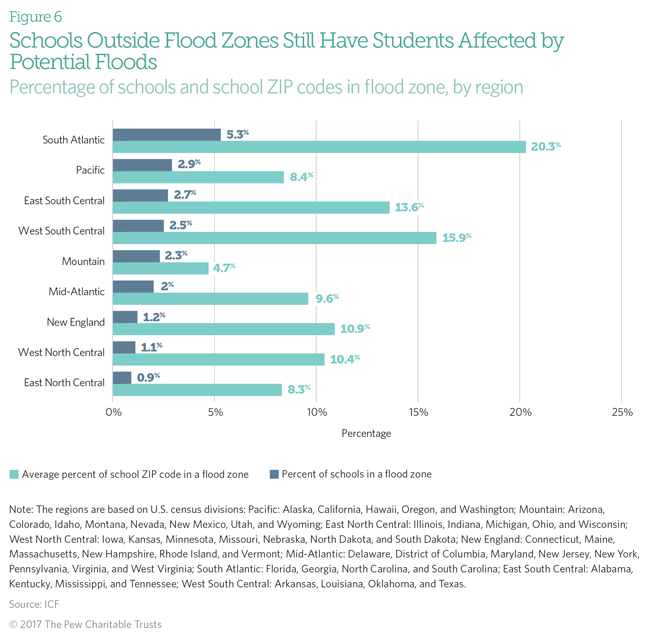
More than 3.2 million students attend schools where half or more of the geographic extent of the ZIP code lies within a designated flood zone. The percentage of a ZIP code located in a flood zone is an indicator of the potential for students’ homes or local businesses to experience flooding, or for school transportation to be affected by flooding. This can cause disruptions even if the school itself is not flooded. There is overlap between the areas that have the highest concentrations of schools in a flood zone and ZIP codes in a flood zone. Areas with significant overlaps include coastal Louisiana, North Carolina, Florida, the Mississippi River corridor, and southwestern Arizona.
Appendix
The goal of this analysis was to better understand the potential flood risk to schools through a high-level screen, using nationally available data sets. Pew and ICF developed a composite flood risk score to capture three potential dimensions of flood risk to schools. The results highlight counties based on the relative risk of schools within those counties.*
Using the data identified in Table 1, ICF generated composite flood risk scores for each school in the National Center for Educational Statistics (NCES) database on elementary and secondary schools based on three indicators of potential flood risk. The three indicators are:
A. School flood zone risk: Indicates potential for direct flood risk to the school. If the school was located within the horizontal extent of a 1 percent annual chance flood zone, a score of 1 was assigned. If the school was located in a 0.2 percent annual chance flood zone but not a 1 percent annual chance flood zone year, a score of 0.5 was assigned. If the school was not located in any designated flood zone, a score of 0 was assigned. School latitude and longitude† were obtained from the NCES data set and spatially overlaid with available FEMA flood hazard layers using geographic information system (GIS) software. One important component of flood risk, the elevation of an individual structure in relation to an estimated flood height associated with the designated flood zone, is not used in this report and is generally not used in broad-scale assessments of flood risks. It should also be noted that not all areas of the country have been studied and mapped for flood hazard, and that not all FEMA flood maps have been digitized. This study included only areas that are covered within the digitized FEMA flood maps. All locations have some degree of flood risk, even if not located within the 0.2 or 1 percent annual chance flood zones.
B. ZIP code flood zone risk: Indicates potential for indirect flood risk to the school via the flood risk of the surrounding neighborhood (e.g., roads, nearby buildings). Indicator scores were calculated based on the percentage of the school’s ZIP code intersecting the horizontal extent of the 0.2 percent annual chance flood zone. Scores ranged from 0 (none of the ZIP code in flood zone) to 1 (entire ZIP code in flood zone). ZIP code polygons were obtained from the U.S. Census Bureau and overlaid with FEMA flood hazard layers, using GIS software. Again, elevation data are not used in this assessment, and risks to individual structures within any area will depend on structure elevations in relation to expected flood heights. This indicator does not include analysis of whether specific local neighborhood infrastructure is located within the flood zone and there may be instances where schools may serve students from additional ZIP codes.
C. County disaster declaration count risk: Indicates potential for direct or indirect flood risk based on frequency of historical federal flood-related disasters.** Indicator scores were assigned based on the number of historical flood-related disaster declarations in the school’s county. Scores ranged from 0 (no disaster declarations for a school’s county) to 1 (county had the most disaster declarations of all U.S. counties) and were calculated by dividing a county’s disaster declaration count by the maximum number of county declarations (36). In a limited number of cases, FEMA disaster declarations were not explicitly linked to modern county names. To account for this, disasters were assigned to multiple counties where ambiguity existed. For example, the same number of disaster declarations was assigned to “Fairfax County” and “Fairfax City [County]” where the disaster declaration geography was provided only as “Fairfax” in the original data.
- This indicator captures only federal disaster declarations, and due to data limitations does not include incidence of smaller-scale floods that are not declared a federal disaster.
ICF also calculated a composite flood risk score for each school based on the sum of all three individual indicator risk scores. The range of scores was 0 to 3. Schools with a higher score were considered to be at higher overall possible risk of flooding than schools with lower scores, based on the best available data. This overall composite score is useful to identify areas with potential risk for further analysis.
The three indicators provide a high-level representation of potential flood risk to each school from nationally available data sets. These indicators are not intended to fully capture local flood risk, and there are several known risk factors not covered by these three indicators. For example, flood risk from smaller, more localized floods, flood risks to student or teacher residences, building standards for schools, and actions taken to reduce flood risks are not captured within the nationally available data sets.
* These indicators improve the understanding of potential flood risk at a national level; a measure of absolute flood risk for specific locations is beyond the scope of this study.
† For this screening analysis, the school location is represented by a single point location, which does not capture the full perimeter of the school property and may underestimate flood risk for specific locations.
** ICF defined flood-related disasters as any events with “flood” in the event title, plus any events of the following incident types: dam break, coastal storm, flood, hurricane, tsunami, and typhoon.
Data sources
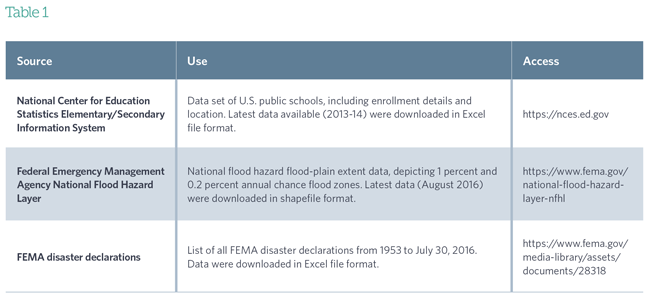
The national-level flood analysis relied on data on school locations, school characteristics, and physical flood risk from the sources shown in Table 1. ICF has relied on the quality control of the underlying data sources and is not responsible for errors therein.
Endnotes
- Associated Press, “West Virginia Lawmakers Quickly OK Flood Cost Bill,” The Intelligencer, Sept. 20, 2016, http://www.theintelligencer.net/news/top-headlines/2016/09/westâvirginia-lawmakers-quickly-ok-flood-cost-bill.
- Government Accountability Office, “Federal Disaster Assistance: Federal Departments and Agencies Obligated at Least $277.6 Billion During Fiscal Years 2005 Through 2014” (September 2016), http://www.gao.gov/assets/680/679977.pdf.
- Ibid.
- American Society of Civil Engineers, “2017 Infrastructure Report Card: Schools” (March 2017), http://www.infrastructurereportcard.org/wp-content/uploads/2017/01/Schools-Final.pdf.
- AECOM, “The Impact of Climate Change and Population Growth on the National Flood Insurance Program,” prepared for the Federal Emergency Management Agency (June 2013), http://www.aecom.com/content/wp-content/uploads/2016/06/Climate_Change_Report_AECOM_2013-06-11.pdf.
- National Institute of Building Sciences, Multihazard Mitigation Council, “Natural Hazard Mitigation Saves: An Independent Study to Assess Future Savings From Mitigation Activities --Volume 2: Study Documentation” (2005), http://c.ymcdn.com/sites/www.nibs.org/resource/resmgr/MMC/hms_vol2_ch1-7.pdf?hhSearchTerms=Natural+and+hazard+and+mitigation.


ADDITIONAL RESOURCES

Article
Article


