Making State Pension Investments More Transparent
Accountability varies widely and could be improved
 Getty
GettyOverview
The California Public Employees’ Retirement System (CalPERS), the nation’s largest public retirement plan, recently raised the bar on investment fee transparency by disclosing the full amount it pays to invest in private equity, which may bring greater rewards but also greater risk and higher management costs. CalPERS, like most public retirement systems, pays performance-based fees, known as carried interest, to external investment managers as part of their compensation, but the system only began publicly disclosing these costs in November. CalPERS’ new policy of reporting carried interest and other performance fees resulted in the disclosure that external investment partners realized $700 million from profit sharing agreements in fiscal 2015.
The move highlights the widespread problem among public retirement systems of underreported manager fees and expenses, particularly those associated with alternative investments such as private equity, real estate, and hedge funds, and points to the need for greater disclosure in order to provide full transparency on investment costs. State retirement systems receive guidance on disclosing investment details from the Governmental Accounting Standards Board and the Government Finance Officers Association’s Best Practice for Public Employee Retirement System Investments. However, states interpret and implement these standards differently.
To examine transparency practices across the 50 states, The Pew Charitable Trusts collected data on asset allocation, performance, and fees from the 73 largest state-sponsored pension funds. Collectively, these funds have approximately $2.9 trillion in investments, or more than 95 percent of all state pension fund investments, according to the U.S. Census Bureau’s Census of Governments 2014 report on state-administered pensions.1
The analysis shows wide variation in investment strategies, policies on disclosure of investment returns, and transparency in reporting the costs of managing assets. Better and more consistent disclosure rules would help those with a stake in these systems discern how well investments are being managed and provide data that could be compared more easily from state to state.
In many cases, current disclosure policies make it difficult for policymakers, stakeholders, and the public to gauge the actual performance of these funds. To help interested parties develop a more complete understanding of both the results and the costs of different investment strategies, this brief highlights some specific steps to improve transparency through greater disclosure. States and funds should:
- Adopt comprehensive fee-reporting standards, such as those proposed by the Institutional Limited Partners Association’s Fee Transparency Initiative.
- Make investment policy statements transparent and accessible.
- Disclose bottom-line performance, both net and gross of fees.
- Expand reporting to include longer-term performance results.
- Report results by asset class, net and gross of fees.
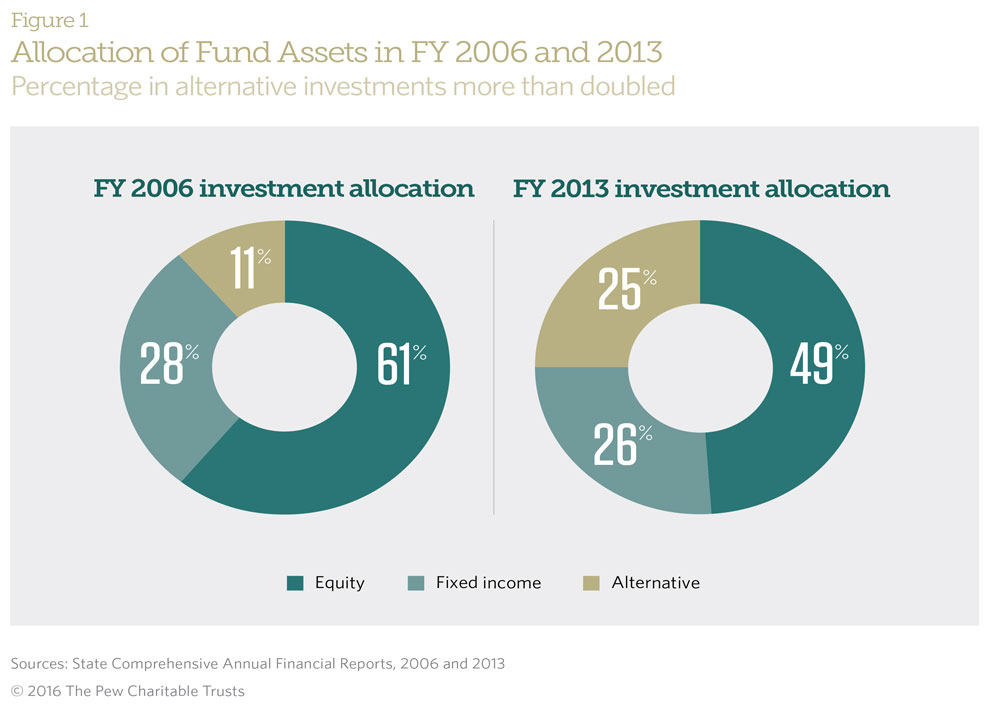
Increased use of alternative asset classes requires greater disclosure
State retirement systems across the United States collectively have more than $3 trillion in assets, with threequarters invested in stocks and what are known as “alternative investments”—an allocation that has more than doubled in recent years.2 To manage these assets, state funds paid more than $10 billion in 2014 in fees and investment expenses—their largest expenditure. The cost of managing these assets has increased by more than 30 percent over the past decade, a jump closely correlated with greater use of alternative investments, such as real estate, private equity, and hedge funds. These fees can reduce investment returns on alternatives by as much as 10 to 20 percent.
What Are Alternative Investments?
Although there is no fixed definition for alternative investments, they are generally agreed to include private equity, hedge funds, real estate and some commodities. These investments typically lack an established public exchange, have low liquidity, and can be more difficult to value. Alternative investments typically carry higher fees and can be employed to diversify investment portfolios or to achieve higher rates of return, although often at higher levels of risk.
Some state funds report investment performance “gross of fees,” which does not account for payments to investment managers. Some provide information about overall long-term performance but do not detail the results of individual investment strategies. Some states, though, are taking action to improve transparency. After public criticism, state treasurers in North Carolina and Rhode Island took new steps over the past two years toward greater fee disclosure.3
Cities face similar issues. For example, a study of the New York City pension fund released in 2015 found that the fund underperformed its stated investment goals by a total of $2.5 billion over the past decade, largely as a result of high investment fees, and the Dallas Police and Fire Fund recently reported significant losses in investments made in local real estate.4
These examples all point to the need for greater and more consistent transparency on these investments. In particular, the increased use of alternative asset classes requires greater disclosure because of their complicated nature, intricate fee structures, and potential risk to a fund’s health.
Recommendation 1: Adopt comprehensive fee reporting standards
A recent report by CEM Benchmarking Inc., an independent global provider of comparative analysis for large pension funds, endowments, and sovereign wealth funds, estimates that the average value of undisclosed private equity fees, including carried interest, monitoring costs and other portfolio company fees, can equal 1.5 percent or more of assets each year, or about half of total private equity management costs.5 The recently released 2014 CalPERS reporting mirrors this finding and suggests that the treatment of carried interest is a significant contributor to the wide variation in reported fees across the 73 plans studied here.
For example, the South Carolina Retirement System holds 38 percent of its assets in alternative investments and has been widely criticized for being subject to some of the highest fees in the country—1.58 percent in reported fees in 2013. But CEM found that South Carolina was “simply reporting more costs than other funds rather than incurring more costs.”6 The South Carolina Retirement System Investment Commission (RSIC) reports invoiced management fees, which is common; but unlike most funds, it also reports the fees deducted from returns. The commission explains its practice with this note:
A portion of investment expenses are directly invoiced by the manager; however, a significant number of investment managers provide account valuations on a net of fee basis. Since these investment expenses are netted against investment income, amounts reported represent a good faith attempt by the RSIC to disaggregate amounts that were not necessarily readily separable throughout the fiscal year. The collection process is not standard practice for many investment managers. The investment expense numbers netted out of accounts include amounts for investment management fees, performance fees (carried interest) and other expenses such as organization expenses in limited partnership structures.”7
In other words, rather than relying on the external managers’ standard reporting or invoices, South Carolina collects and validates additional detailed information, not only on full management fees but also on portfolio company fees, other fund-level fees, and accrued carried interest (performance fees). This is an attempt to account for all fees incurred during the fiscal year, including those that were netted from asset values.8
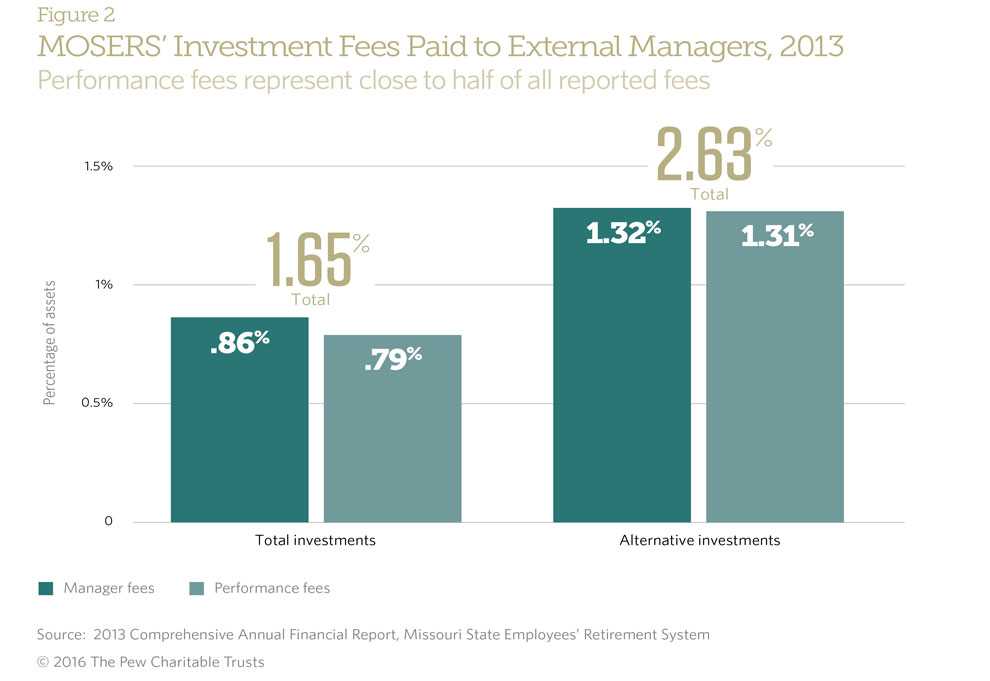
This level of fee disclosure may be uncommon, but South Carolina is not the only plan collecting and reporting more than invoiced fees. The Missouri State Employees’ Retirement System (MOSERS) is particularly thorough in collecting and reporting these fees, not only by asset class but for each external consultant or manager. MOSERS reports the highest fees of the 73 plans studied, at 1.73 percent, with 1.65 percent paid to external managers. But, as illustrated in Figure 2, about half of all reported external management costs during the 2013 reporting period were performance fees that many states do not report.
The call for standardized reporting and transparency of private equity fees in the United States may be gaining momentum. The Institutional Limited Partners Association’s Fee Transparency Initiative, a widely supported industry effort to establish comprehensive standards for fee and expense reporting among institutional investors and fund managers, is advocating for total fee reporting by private equity managers and their investors.9 The association released a final version of the proposed standardized reporting template in January 2016.10 Further, in a recent letter to the Securities and Exchange Commission, 13 state and municipal treasurers and comptrollers— including several contributors to the Fee Transparency Initiative—made an appeal for industrywide standards on private equity fee disclosure, including carried interest.11
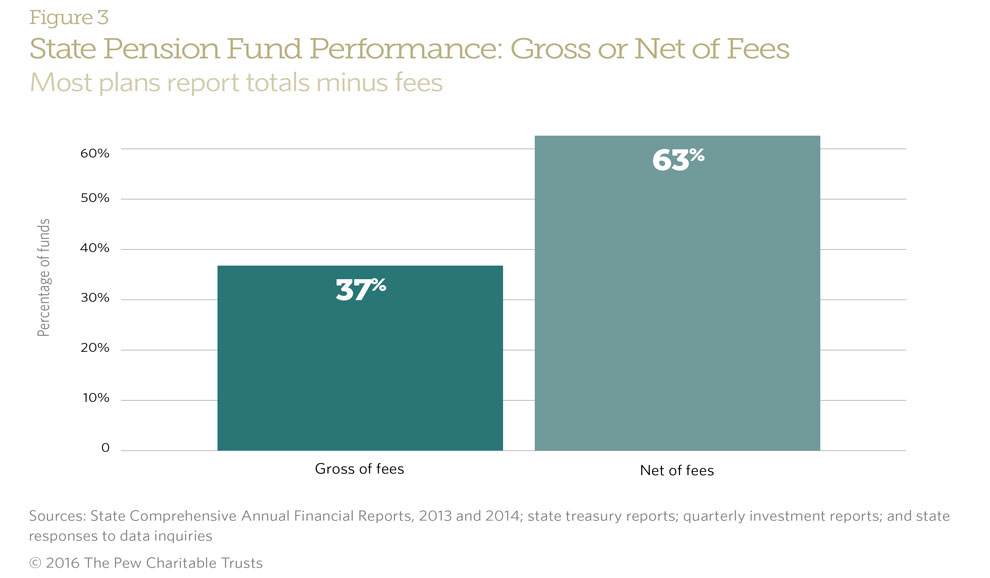
Clear information that accounts for the costs of managing assets is needed to fully understand investment performance. Still, more than one-third of plans examined do not disclose detailed returns minus the fees paid to managers, or “net of fees.”
Recommendation 2: Make investment policy statements transparent and accessible
The Government Finance Officers Association (GFOA) recommends that each pension plan develop a concrete statement of investment goals that describes its investment and risk tolerance saying, “The development of an investment policy is fundamental to sound financial management.”12 Public pension funds’ formal investment policies include information on the risk and return objectives, as well as targets for investments across different asset classes. Making these investment policies transparent and readily accessible provides stakeholders with critical information on the strategies that pension systems follow for the investment of public funds.
For example, MOSERS provides online access to its investment policy statement, which includes a detailed description of the use of alternative investments to achieve the fund’s risk and return objectives. The system also includes an in-depth explanation of the policy in its annual reports.13
Of the 73 plans examined, 59 provided access to investment policies online; others indicated that their policies are available upon written request. Setting a standard of making these statements available online, following the practice of most funds, creates the foundation for transparency in public pension investing.
Recommendation 3: Disclose bottom-line performance, both net and gross of fees
Clear information that accounts for the costs of managing assets is needed to fully understand investment performance. Still, more than one-third of plans examined do not disclose detailed returns minus the fees paid to managers, or “net of fees.” For 10-year results, 27 of 73 plans studied, or 37 percent, reported returns “gross of fees”—without deducting manager fees. (See Figure 3.) Reporting performance both gross and net of fees gives stakeholders information on both the cost and bottom-line results of pension funds’ investment strategies. A direct comparison of returns on a net and gross basis is a clear and easy method for examining the impact of fees on fund performance.
Recommendation 4: Expand performance reporting to include 20-year results by investment type
Fund investment policies are designed to reflect the long-term nature of pension funds because many participants may work for over 30 years and receive benefits for 20 years—or more—in retirement. However, the GFOA recommendations only call for reporting performance over five years, and most funds report only 10- year investment performance.
Reporting results over a longer time horizon would supply stakeholders with information that is better aligned with fund investment strategies. It also would be helpful when examining the impact of shorter-term results, such as the strong performance during the 1990s bull run of the stock market or the underperformance to fund benchmarks during the volatile financial markets of the 2000s. Based on Pew’s research, 13 of the funds in the analysis regularly provide 20-year investment performance figures in their reports and six report such figures by asset class. Making this practice routine would furnish stakeholders with critical information on long-term results that is more aligned with the long-term investment strategies that these funds follow.
Recommendation 5: Include performance results by asset class—both net and gross of fees
The GFOA recommendations call for funds to provide performance results by asset class over time, as well as full disclosure of long-term investment performance by investment type or asset class. State retirement systems in Georgia, Kentucky, Louisiana, Missouri, and New York already release comprehensive 20-year data on performance returns by asset class. Currently, only Georgia and Missouri make that information available net of fees. South Dakota is the only state to disclose 20-year performance net and gross of fees but does not break this reporting down by asset class.
While the performance of individual asset classes may vary over the short term, long-term performance data must be available to assess the overall success of the investment strategy. Further, disclosure of performance both gross and net of fees by asset class would provide stakeholders with bottom-line results and a clearer picture of the cost of implementing the investment strategy identified in fund policy. (See Appendix A for an illustration of how the current reporting for the Pennsylvania Public School Employees’ Retirement System could be improved to include this additional information.)
Conclusion
Allocation of assets and bottom-line performance ultimately determine plans’ fiscal health and the ability to pay for the promised retirement benefits; in fact, experts estimate that investment returns account for 60 percent of pension benefits. The fees and cost of managing these assets can significantly affect the long-term costs of providing retirement benefits to public workers.
There is no one-size-fits-all approach to investing pension assets. However, because many alternative investments involve greater risk and complexity, boosting transparency is essential. Policymakers, stakeholders, and the public need full disclosure on investment performance and fees to ensure that risks, returns, and costs are balanced in ways that follow best practices and meet funds’ policy needs.
Methodology
Pew’s research focused on financial data collected from 2012, 2013, and 2014 financial reports, including Comprehensive Annual Financial Reports, investment reports, and in two instances—North Carolina and Connecticut—annual state treasury reports. For each plan, Pew collected data from the financial reports on asset allocation, performance, and fees. Pew made no adjustments or changes to the state figures and offered states the opportunity to verify the data. A forthcoming report on pension fund investments and performance will examine plan level 2014 data.
Additional data used in this analysis came from two sources:
- Data collected from state Comprehensive Annual Financial Reports; pension plan actuarial valuations; and other statements that disclose financial details about individual public pension plans between fiscal 1992 and 2014. In some cases in which information was not available in public sources, the data also include facts provided by the individual pension plans in response to Pew’s requests.
- Pensions & Investments’ “Public 100,”14 a fund-level data set that provides details on public-sector pension plans’ use of hedge funds, private equity, and other alternative investments. This source includes data from 126 major state and local pension funds covering 95 percent of all U.S. public pension assets, according to U.S. census data. Pew’s analysis used the data set covering 2006 to 2013, the most recent period for which consistent data on asset allocation and fees are available. In particular, the analysis relied on the data for the period between 2006 and 2011.
It is important to note that available data sources should be used with care when making cross-plan comparisons. For example, inconsistencies often arise in reporting periods and asset classification across funds. In addition, the annual reports of the public pension plans studied show a wide range of completeness in disclosure of fees paid, particularly with regard to alternative classes such as hedge funds and private equity.
Appendix A
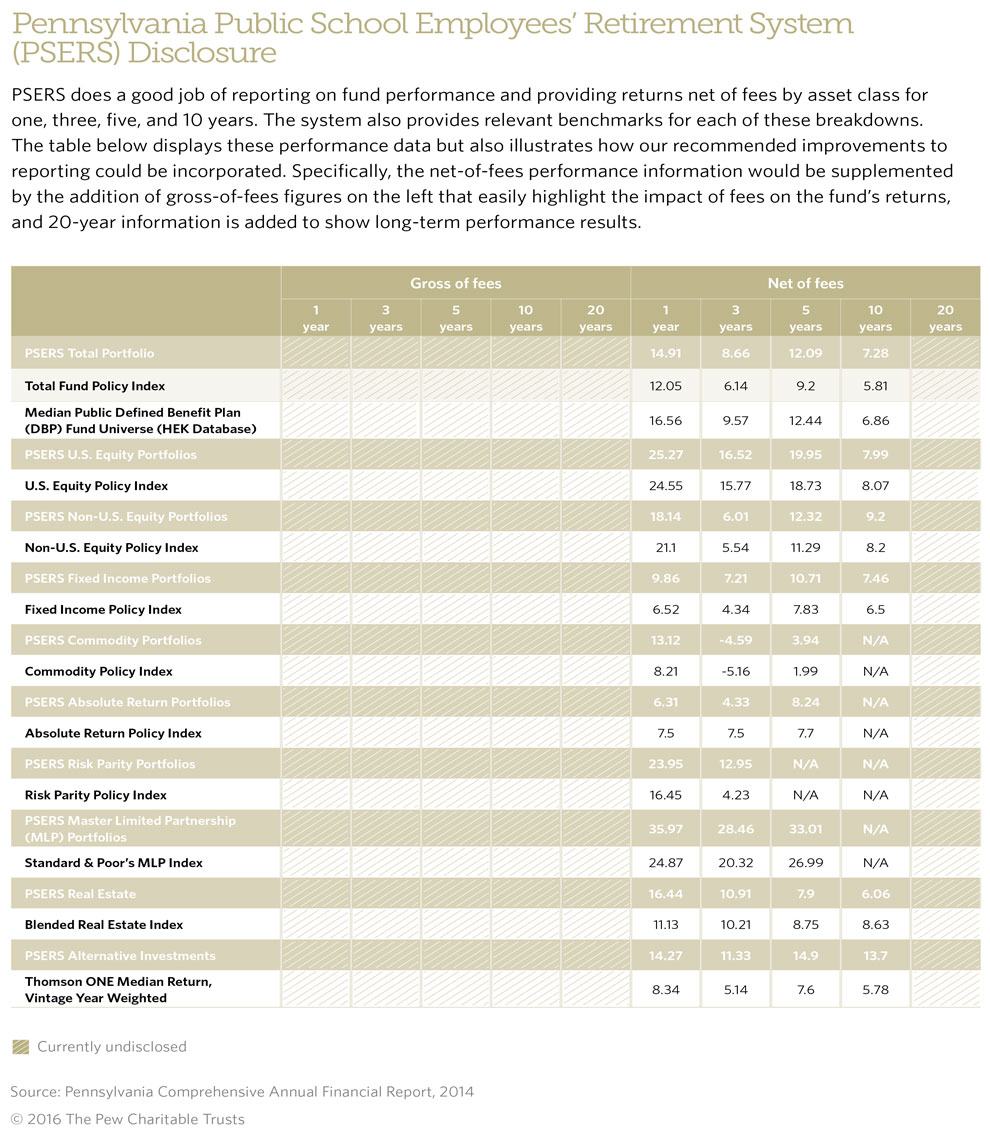
Pennsylvania Public School Employees’ Retirement System (PSERS) Disclosure
PSERS does a good job of reporting on fund performance and providing returns net of fees by asset class for one, three, five, and 10 years. The system also provides relevant benchmarks for each of these breakdowns. The table below displays these performance data but also illustrates how our recommended improvements to reporting could be incorporated. Specifically, the net-of-fees performance information would be supplemented by the addition of gross-of-fees figures on the left that easily highlight the impact of fees on the fund’s returns, and 20-year information is added to show long-term performance results.
Endnotes
- 2014 Survey of Public Pensions: State and Local Data,” U.S. Census Bureau (February 2015), http://www.census.gov/govs/retire/
- 2014 Survey of Public Pensions:State and Local Data,” U.S. Census Bureau (February 2015), http://www.census.gov/govs/retire/; all other figures are calculated using Pew data.
- For information about efforts to raise the bar on disclosure concerning investment management fees and fee arrangements, see North Carolina Department of State Treasurer, “Treasurer Cowell Urges House to Pass Pension Investment Transparency Measure,” June 3, 2014, https://www.nctreasurer.com/inside-the-department/News-Room/press-releases/Pages/Treasurer-Cowell-Urges-House-to- Pass-Pension-Investment-Transparency-Measure.aspx; and also see Edward Siedle, “North Carolina State Workers Demand Treasurer Release Pension Records,” Forbes, Jan. 14, 2014, http://www.forbes.com/ sites/edwardsiedle/2014/01/14/north-carolina-state-workersdemand- treasurer-release-pension-records. For further details about Rhode Island’s efforts to increase disclosure on pension investment management fees and fee arrangements, see Rhode Island Office of the General Treasurer, “Treasurer Magaziner Unveils ‘Transparent Treasury’ Initiative,” May 26, 2015, http://www.ri.gov/press/view/24905; Rhode Island Office of the General Treasurer, “Transparency in Government Agreement,” last updated May 25, 2015, http://data.treasury.ri.gov/ dataset/201505-state-investment-commission-reportmay- 2015/resource/ea15ae0f-51b9-4af5-abbd-9f477722f738; and James Comtois, “Rhode Island Takes Transparency to New Level,” Pensions & Investments, June 29, 2015, http://www.pionline.com/article/20150629/PRINT/306299974/rhode-island-takes-transparencyto-new-level.
- Patrick McGeehan, “Wall Street Fees Wipe Out $2.5 Billion in New York City Pension Gains,” The New York Times, April 8, 2015, http://www.nytimes.com/2015/04/09/nyregion/wall-street-fees-wipe-out-2-5-billion-in-new -york-city-pension-gains. html?smid=tw-share&_ r=1; Steve Thompson, “Real Estate Losses Near $200M for Dallas Police, Fire Pension Fund,” The Dallas Morning News, Sept. 18, 2014, http://www.dallasnews.com/news/metro/20140918-real-estate-losses-near-200m-for-dallas-police-fire-pension-fund.ece.
- Andrea Dang, David Dupont, and Mike Heale, “The Time Has Come for Standardized Total Cost Disclosure for Private Equity,” CEM Benchmarking Inc. (April 2015), http://www.cembenchmarking.com/Files/Documents/CEM_article_-_The_time_has_come_for_ standardized_total_cost_disclosure_for_private_equity.pdf.
- Dang, Dupont, and Heale.
- South Carolina Retirement Systems, “FY2013 Comprehensive Annual Financial Report,” 85–89, https://www.retirement.sc.gov/financial/ cafrarchive/CAFR%202013.pdf.
- For a more detailed discussion of South Carolina’s approach to collecting and reporting accurate private equity costs, see Dang, Dupont, and Heale, “The Time Has Come,” 4.
- Institutional Limited Partners Association, “Private Equity Reporting Should Be More Uniform Across Industry, Says ILPA,” Sept. 3, 2015, http://ilpa.org/index.php?file=/wp-content/uploads/2015/09/ILPA-Transparency-Initiative-press-release_2015-Sept3.pdf&ref=http://ilpa.org/2015/ilpa-publishes-a-press-release-on-increasing-transparency-in-the-pe-industry/&t=1447791502.
- Institutional Limited Partners Association, “ILPA Fee Reporting Template,” https://ilpa.org/best-practices/reporting-best-practices/forconsultation- ilpa-fee-reporting-template/.
- In a letter dated July 21, 2015, trustees from 12 states and the District of Columbia representing $1 trillion in pension assets called upon the Securities and Exchange Commission to require standardized private equity disclosure (http://comptroller.nyc.gov/wp-content/ uploads/documents/SEC_SignOnPDF.pdf).
- Nicholas Greifer, “A Guide for Establishing a Pension Investment Policy,” Government Finance Officers Association (2003), http://www. gfoa.org/sites/default/files/AGuideForEstablishingAPensionInvestmentPolicy.pdf.
- Missouri State Employees’ Retirement System, “Investment Policy,” https://www.mosers.org/Investments/Investment-Policy.aspx
- Public 100,” Pensions & Investments, http://www.pionline.com/data-store.
ADDITIONAL RESOURCES

Article


