Public Retirement Systems Need Sustainable Policies to Navigate Volatile Financial Markets
State pension funding gap, 2021

Overview
Over the past decade, policy reforms and increased financial contributions have dramatically improved the cash flow situation of some of the nation’s most troubled state pension plans. Thanks to these changes, which include reforms to benefit designs, a commitment to fiscal discipline, and greater monitoring of the financial health of public retirement systems, no state is at risk of pension plan insolvency. Nevertheless, many states still have more to do to ensure the long-term sustainability of pension promises.
As recently as 2016, seven states still had gaps between outgoing benefit payments and incoming contributions that were large enough to cause insolvency if investments fell short of expectations and policymakers failed to react quickly. But by 2018, the number of plans at serious risk of insolvency had dropped to two. And in 2021, no state was below that dangerous threshold, a sign of the significant turnarounds achieved by states such as Colorado, Kentucky, and New Jersey.
However, sustainable pension policy requires more than just paying the bills due today. If a pension plan is meeting current needs but pension debt is steadily growing, future generations of policymakers might have to make unaffordable contribution increases or reduce benefits. From 2002 to 2018, states fell short of minimum funding thresholds by a combined $220 billion, which caused the funding gap to grow in good economic times as well as bad. But after more than a decade of increasing pension contributions—which have risen by 7% annually since 2008—by 2021, states collectively were contributing enough to keep pension debt stable (though not enough to make progress in paying down pension debt). Most states met or exceeded Pew’s contribution benchmarks in 2021, but 21 still had negative amortization, meaning that contributions were insufficient to keep the funding gap from growing.
Although the improvements in states’ fiscal discipline related to pension liabilities are apparent in the cash flow and net amortization data, whether that progress will be enough to ensure long-term sustainability is not yet clear. In 2021, once-in-a-generation investment returns raised the overall state pension “funded ratio” (the share of pension liabilities matched by assets) to its highest level in more than a decade. Recent investment shortfalls and economic uncertainty, however, have erased most of those gains. Successful states with a long track record of stable costs and full funding have demonstrated policies that can weather ups and downs in financial markets. States that have had to play catch-up and still face significant underfunding might have more work to do.
After more than a decade of reform, policymakers have a wide array of proven practices at their disposal to ensure that public pensions are sustainable. Successful states have shown that sound policy can deliver well-funded retirement promises and stable costs using policies and practices such as contributing more than the minimum when times are good to build a buffer against future downturns, having benefits automatically adjust based on the plan’s funding level, and reducing exposure to investment risk.
In addition, stress testing—modeling what will happen under various economic and investment conditions—can help policymakers know whether further reforms are needed and plan for the budget impact of the next economic downturn. States have the tools to prevent runaway pension costs or unfunded liabilities, so should those problems emerge and strain public budgets and balance sheets during a future recession, it will be the result of poor policy choices rather than bad luck.
State pension plans’ cash flow has improved
While successful pension policy must achieve several goals, the most important, clearly, is to avoid running out of money. State and local pension plans are typically pre-funded, with the state and other public employers setting money aside for current public employees and letting it grow in order to pay the promised benefits when those workers retire. In 2021, state pension plans received $128 billion in contributions from state and local governments, school districts, and other plan sponsors (public employers with workers in state pension plans), plus $45 billion from employee contributions. But those pension plans also paid out $260 billion in benefits, resulting in a negative operating cash flow of $87 billion.
State pension plans are able to pay out more than they receive through contributions because they benefit from returns on invested assets that have been set aside to pay for benefits. In 2021, the negative operating cash flow was more than matched by $819 billion in investment returns, thanks to once-in-a-generation investment performance, with the typical pension plan generating a 27% return. Most states assume a 7% return from financial markets, which likewise would have more than offset the negative cash flow with $220 billion in expected gains.
Across the 50 states, the negative operating cash flow in 2021 equaled 2.8% of the assets state pension plans had at the start of the year. Thus, at a minimum, investment returns on those assets had to equal 2.8% or higher to ensure plan assets would have risen. But that’s not the entire story, as liabilities also increase from year to year: Rising assets alone are no guarantee that a pension’s funding is sustainable. And for underfunded pension plans, declining assets can quickly lead to insolvency, forcing either a significant increase in employer contributions to provide benefits on a pay-as-you-go basis or even the inability to send out retirement checks.
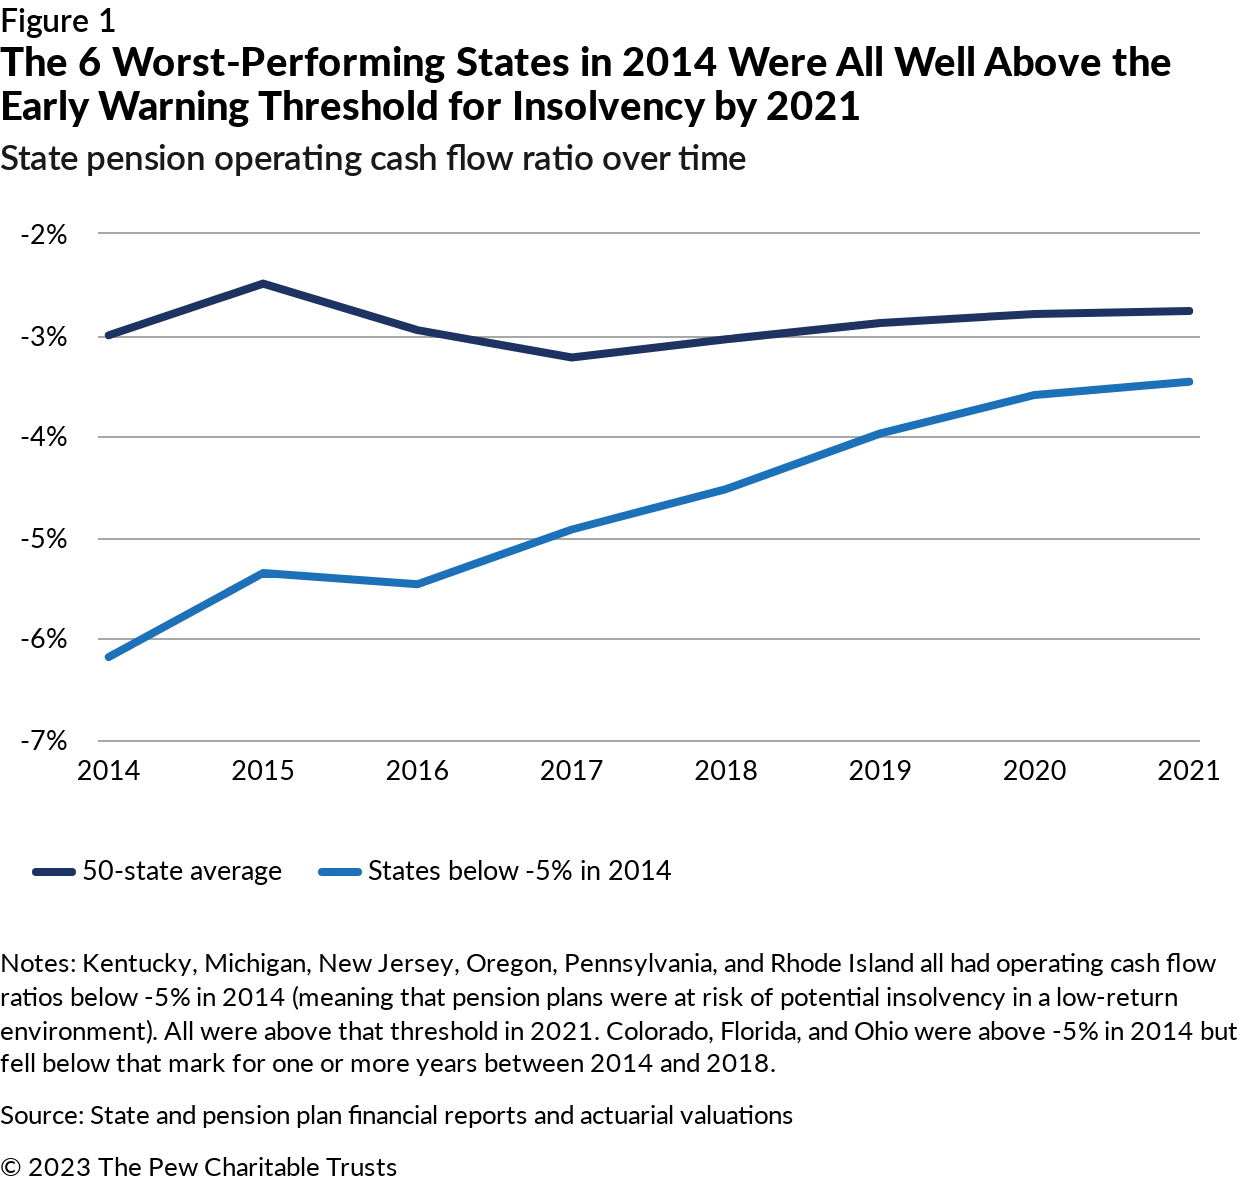
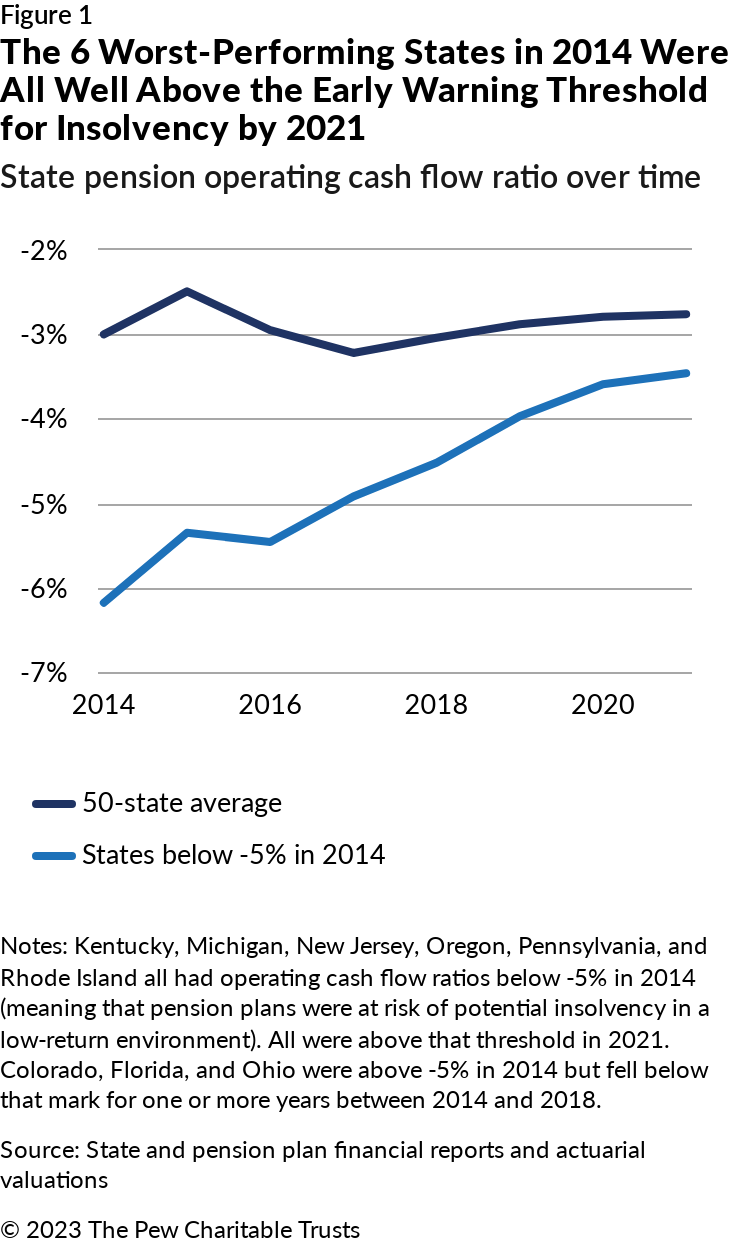
Pew began calculating and using operating cash flow (OCF) as a key metric for assessing the health of state pension plans in 2014, relying on data that was newly available as a result of changes in government accounting standards. As shown in Figure 1, the overall operating cash flow ratio for states in 2014 was -3%. That ratio has stayed largely stable in subsequent years.
Pew has identified an OCF ratio below -5% as an early warning sign of potential insolvency, based on the assumption that there is a reasonable likelihood of a plan experiencing a period of lower-than-expected investment performance over a 20-year period in which average returns fall below 5%. In 2014, six states fell below that -5% threshold. By 2021, every one of the 50 states had a cash flow ratio above −5%. This improvement was thanks largely to a significant increase in employer contributions from 2014 to 2021, with an average 6.7% annual growth over this seven-year period. Likewise, benefit reforms, including limits to cost-of-living adjustments in many states, have helped reduce growth in benefit payments, further improving cash flow.
Tracking cash flow on an annual basis can help policymakers detect early warning signs of distress for public pension plans and identify potential near-term worries. As Pew’s data shows, the efforts of state policymakers and fiscal discipline have resulted in real improvements to the cash flow of state pension plans.
States contributed enough in 2021 to keep pension debt stable
Pew’s research into public pension plans dates back to 2007, with the publication of Pew’s first report, “Promises With a Price.” From the beginning, Pew’s research has emphasized the importance of adequately funding pension promises. Although policymakers can and should pay attention to questions of plan design, investment practices, and governance, the lack of consistent, adequate funding will make any pension policy unsustainable. States with a track record of fully funding their pension promises going back to 2003 were 94% funded in 2021 (the average funded ratio among the 18 states that made the full pension contribution, on average, from 2003 to 2021). States that fell short over that period were just 79% funded. As mentioned above, the “funded ratio” describes the amount of money set aside by a state in the past to pay for its current pension liabilities. Thus, if a state previously saved 94 cents for every $1 of current pension liability, it is said to be 94% funded—leaving a 6% gap, which must be funded by future employer contributions to cover benefits already owed.
Pew’s primary benchmark for assessing the adequacy of a state’s pension contributions is called net amortization. Net amortization is calculated as the total amount of money needed to pay for new benefits earned by current employees in a given year and to cover interest on pension debt on the plan’s balance sheet at the start of the year. States where pension contributions exceed this benchmark can expect to see pension debt decline year over year if investments meet expectations and other assumptions hold true. States that fall short of this benchmark can expect to see funding gaps grow over time. For states where contributions hover around the benchmark, pension debt should stay stable over time, neither growing nor shrinking.
Net amortization benchmark
The net amortization benchmark is calculated by taking the sum of service cost (the actuarial value of benefits earned by employees in a year, also called normal cost) and interest on the net pension liability at the beginning of the year and then subtracting employee contributions. Each pension plan’s total liability and the net pension liability grow annually at the plan’s assumed rate of return; employer and employee contributions are also adjusted to reflect expected interest.
Given the volatility pension plans face, Pew defines a net amortization result as “stable”—that is, sufficient to keep any existing funding gap from growing—when it is within -0.5% to 0.5% of payroll. Contributions exceeding that amount mean a public pension plan has positive amortization, and those falling below that level indicate negative amortization. In this context, employers would have needed to contribute 18.7% of payroll—or $133 billion—to state pension plans to exactly equal the net amortization benchmark. Actual employer contributions were 18.6% of payroll, or $132 billion, within the range for stable amortization.
From fiscal years 2014 through 2018, states collectively fell short of the net amortization benchmark by an average of $18 billion a year, or 3% of payroll. In 2019, states were on the cusp of meeting the benchmark—under the threshold by just $400 million, or less than 0.1% of payroll. This improvement helped stabilize pension debt and set the stage for fiscal year 2020, when state pension plans received contributions sufficient to pay down $5 billion in pension debt. Because state pension plans operate in an environment with significant volatility, they ended fiscal year 2021 slightly below the threshold: The net amortization benchmark increased by $8 billion from 2020 to 2021 due to investment shortfalls in 2020, but employer contributions rose by only $2 billion.
Together, the 50 states had positive amortization for the first time in 2020. While not quite able to replicate this success in 2021, contributions remained sufficient to stabilize pension debt. Even so, 21 states had negative amortization in 2021, meaning they can expect their funding gap to grow over time, absent an increase in contributions. The net amortization benchmark relies on data that states began reporting consistently in 2014; when Pew first calculated and reported this benchmark that year, only 17 states had stable or positive amortization, as shown in Figure 2 below. In previous years, Pew had examined whether states were contributing enough to meet their self-reported actuarial funding targets; most were likewise falling short of that benchmark.
In fact, prior to 2020, the most recent year in which states collectively met contribution targets was 2001. Although other factors contributed to the pension problems facing states, nearly 20 years of inadequate funding of pension plans has led to hundreds of billions of dollars in additional pension debt.
The 24 states with positive amortization can expect their funding level to improve over time with the policies they have in place as long as investment returns hit their targets and other economic and demographic assumptions hold true. However, the volatility of investment markets and uncertainty about whether the future will match other assumptions mean that policymakers still need to pay careful attention to measuring and managing risk. Pension plans with stable amortization and full funding may likewise be in a sustainable situation, but stable states that have unfunded liabilities will need a plan to address that shortfall. For the 21 states with negative amortization, maintaining current policies and contribution levels will lead to increasing unfunded liabilities, push the cost of current and past benefits onto future budgets, and create the risk of unsustainable growth in minimum contributions.

What does it mean for a state to have positive amortization? And how can a state end up with negative amortization? Looking at the example of four states—Kentucky, Pennsylvania, South Carolina, and West Virginia—can offer a helpful illustration. As shown in Table 1, below, three of the four had negative amortization in 2014. The state of Kentucky and participating employers would have had to contribute 50% of payroll in 2014 to cover the cost of newly earned benefits (service cost) and interest on $32 billion of pension debt that was on the state’s books when that fiscal year began. Employer contributions instead totaled just 18% of payroll; if not for good investment returns, pension debt would have grown by $1.7 billion in a single year. Pennsylvania and South Carolina were in a similar position. Pennsylvania would have had to increase pension contributions by 14% of payroll to pay for service cost and interest on pension debt. And South Carolina was falling short by 5% of payroll. But while Kentucky and Pennsylvania faced problems because they were not making the actuarially determined employer contribution in 2014, South Carolina fell short even as it made the calculated contributions, since actuarial calculations can still allow for negative amortization when the actuarial policy is built to push costs off into the future. South Carolina’s new funding policies, put into effect in 2017, will address this problem over time. Kentucky and Pennsylvania have spent the last decade raising contributions to reflect actuarially determined funding, and both are starting to make progress paying down pension debt.
Although Kentucky, Pennsylvania, and South Carolina show how states can stop making problems worse by meeting minimum contribution benchmarks, West Virginia’s situation shows how consistently achieving positive amortization can actually fix past pension challenges. West Virginia’s pension plans have been historically underfunded, with the lowest funded ratio of any state at the turn of the 21st century. But thanks to funding policies designed to pay down debt, its funding gap has been steadily shrinking. In 2014, West Virginia started with $5.2 billion of unfunded pension liability; the state finished 2021 with a funding gap of less than $500 million. West Virginia thus managed to close 90% of its funding gap in just seven years.
Policymakers in many states have committed to making actuarially determined employer contributions to state pension plans and, in states such as South Carolina, have improved how actuarial calculations are made to ensure that pension funds are sufficient to pay for pension benefits. In addition, some states have adjusted benefit provisions and employee contributions to make sure that state and local budgets can sustain the resulting costs. As a result, many states have made substantial progress in moving toward sustainable pension policy. Now most states are on track to meet their pension obligations—if everything goes as planned. But what happens if unexpected problems arise?
States need tools to manage risk from volatile markets
States reported that their pension plans were 82% funded in 2021, meaning 82 cents had been set aside for every dollar that actuaries calculated state plans should have had on hand to pay for promised benefits. This was the highest ratio since prior to the 2007-09 recession. The funding gap closed to approximately $836 billion in 2021, compared with the nearly $1.4 trillion of unfunded liability reported in 2020. Although the reforms and policy changes described above helped states turn a corner and move toward stable or shrinking unfunded liabilities, the scale of the change was driven by financial market gains: The typical public pension plan enjoyed a 27% increase in the value of its assets. Thanks to that boost, pension assets climbed from $3.1 trillion in 2020 to $3.9 trillion in 2021, even as liabilities rose from $4.5 trillion to $4.7 trillion.


America’s Overdose Crisis
Sign up for our five-email course explaining the overdose crisis in America, the state of treatment access, and ways to improve care
Sign up
Table 1
How Kentucky, Pennsylvania, South Carolina, and West Virginia Managed Pension Debt
Net amortization process in 4 states, 2014 and 2021
| Kentucky | Pennsylvania | South Carolina | West Virginia | |||||
|---|---|---|---|---|---|---|---|---|
| 2014 | 2021 | 2014 | 2021 | 2014 | 2021 | 2014 | 2021 | |
| Paid the ADEC? | No | Yes | No | Yes | Yes | Yes | Yes | Yes |
| Starting unfunded | $32,206 | $30,343 | $54,599 | $66,465 | $20,225 | $29,187 | $5,220 | $3,777 |
| Discount rate | 5.93% | 6.37% | 7.50% | 7.19% | 7.50% | 7.25% | 7.50% | 7.50% |
| Service cost | $1,166 | $780 | $3,083 | $2,888 | $895 | $1,245 | $291 | $292 |
| Interest on pension debt | $1,908 | $1,933 | $4,095 | $4,776 | $1,517 | $2,116 | $392 | $283 |
| Employee contribution | $435 | $460 | $1,382 | $1,538 | $779 | $1,127 | $162 | $187 |
| Net amortization benchmark | $2,639 | $2,252 | $5,796 | $6,125 | $1,633 | $2,235 | $520 | $388 |
| Employer contribution | $934 | $2,485 | $3,189 | $7,898 | $1,179 | $2,144 | $769 | $624 |
| Net amortization | -$1,705 | $233 | -$2,607 | $1,773 | -$455 | -$91 | $249 | $236 |
| Employer contribution/ payroll | 18% | 47% | 17% | 38% | 14% | 19% | 26% | 19% |
| Net amort/payroll | 50% | 42% | 31% | 30% | 19% | 20% | 18% | 12% |
| Shortfall/payroll | 33% | -4% | 14% | -9% | 5% | 1% | -9% | -7% |
| Covered payroll | $5,232 | $5,335 | $18,481 | $20,560 | $8,491 | $11,261 | $2,926 | $3,224 |
| Expected unfunded | $33,911 | $30,110 | $57,206 | $64,692 | $20,680 | $29,278 | $4,971 | $3,541 |
| Actual unfunded | $31,386 | $27,973 | $54,438 | $53,762 | $19,328 | $24,503 | $3,820 | $448 |
| Note: All dollar figures are in millions. “Actuarially determined employer contributions” (ADEC) are as reported by the pension plan based on calculations by the plan actuary. “Expected unfunded” is what the pension debt would have been if all assumptions proved true and no policies were changed that year; “actual unfunded” is the reported pension debt at the end of the year after including unexpected investment performance and demographic experience. Shortfall as a share of payroll represents how much the employer contribution rate would need to increase to meet the net amortization benchmark; negative values indicate that contributions are above the benchmark.
Source: State and pension plan financial reports and actuarial valuations |
But states can’t invest their way out of pension challenges; the enormous gains of 2021 have largely been evaporated by financial markets in the 2022 fiscal year, with the typical pension plan losing nearly 8% of asset value. Projecting forward, using investment and economic information through June 30, 2022, Pew estimates that the 2022 funding gap will be larger than in 2020 at about $1.45 trillion. As the past few years of investment booms and subsequent market corrections have shown, policymakers need tools to manage the ups and downs in financial markets and clear funding plans to pay down pension debt without relying solely on investment performance.
Public pension plans rely on investments, including risky investments that promise higher returns, to ensure that adequate assets will be available to pay future promised benefits. And, since retirement funding requires planning for decades in the future, pension policy must be resilient to all sorts of demographic, economic, and other risks. Given that, sustainable pension policy not only needs to ensure adequate funding of promised benefits if everything goes as planned but also must have tools to manage risk and uncertainty. Promising practices and policies used in well-funded pension plans offer policymakers a toolkit to do so.

Stress tests assess whether policies will provide stability in a downturn
Virtually every state has made reforms to respond to the impact of the 2007-09 recession on pension plan balance sheets and costs. But which states are prepared for the next downturn or for the possibility of long-term investment underperformance?
Many state pension plans use stress testing to assess what different investment, economic, demographic, and policy scenarios might mean for pension plan balance sheets and for solvency. Stress tests also help states and plan sponsors make informed budget decisions. As of 2021, half of the states have been using this tool to evaluate the potential effects of investment risk on plan funding levels and required contributions. Policymakers can use stress testing as an early warning sign of unsustainable policies or excessive risk, as a tool to compare and understand policy choices, and to predict whether reform efforts will be successful at addressing long-term pension challenges.
Stress testing isn’t just an academic exercise. Colorado, for example, found from a prior stress test that its policies would lead to a 1 in 4 chance of pension insolvency, which prompted pension reform.1 Connecticut used stress testing to identify problems with its funding policy and guide changes to address those issues.2 And South Dakota used stress test analysis to adjust the state’s risk management tools in response to the COVID-19 pandemic.3
Stress testing in states such as California, Minnesota, and Pennsylvania shows what a low-investment return scenario might do to pension costs, which in turn allows policymakers to make budget decisions to mitigate future pension costs. Stress testing can also help guide policy decisions around benefit design, actuarial assumptions, and contribution policy.
Pennsylvania offers a useful example, with stress test analyses done for the State Employees’ Retirement System (SERS) and the Public School Employees’ Retirement System (PSERS). The SERS stress test showed that if investments hit their target, employer costs as a share of payroll will decline while funding levels will improve, with full funding of SERS expected in 2038. Even a decade of lower-than-expected returns would allow for the contribution rate to remain stable at about 26% of payroll—meaning that Pennsylvania would not be able to enjoy hoped-for budget relief, but neither would it require significant increases in the share of the state budget that goes toward pension costs. A one-time asset shock with a 20% loss in asset value, however, would push contribution rates for SERS to about 36% of payroll by 2028, from 31% in 2023. Thanks to this analysis, state policymakers can understand the scale and the timing of cost increases needed to address these investment scenarios and plan accordingly.4
Similarly, for PSERS, if everything goes as planned and the system achieves its 7% annual investment return goal, employer contributions for teacher pension benefits will stay stable at around 35% of salary until 2034, when the cost of legacy unfunded liabilities will have been paid for and the contribution rate will drop to about 4% of payroll. On the other hand, a 20-year spell of lower-than-expected returns might require further increases in the contribution rate, up to 49% of payroll in 2034, followed by a drop to about 20% by 2040.5
States and individual pension plans will vary in the questions they ask about risk and the investment, economic, and policy scenarios they apply in stress testing. For example, the Maryland State Retirement and Pension System conducts an annual risk assessment that includes climate risk analysis—examining the expected return of different portfolios under different environmental scenarios. This type of analysis can help policymakers consider future asset allocation strategies or provide advance warning of how expected returns might be affected by broader shifts in financial markets or government policy to reduce emissions that cause climate change.6

In some states, such as Wisconsin, stress testing demonstrates that current policies are sufficient to maintain high funding levels with minimal uncertainty about contributions. A stress test of the Wisconsin Retirement System shows that in a 25th percentile scenario (a 1 in 4 chance that economic and investment conditions will be this bad or worse), employer contributions would only need to rise from 12.9% of salary to 15.2% of salary over a 10-year period.7 But even in states such as Pennsylvania, where past decisions to shortchange pension contributions and offer unfunded benefit increases have strained the state’s budget and balance sheet, stress testing can show the progress that’s been made—with the Keystone State on track to full funding under current assumptions—and help policymakers make data-driven decisions that incorporate risk and uncertainty.
Policymakers can adopt policies shown to effectively manage risk
The reason for state policymakers to care about stress testing and pension risk is that unsustainable pension policies have a direct impact on state budgets. The increases in costs for public pensions following the 2000 and 2007-09 recessions put significant strain on state and local budgets and crowded out other important public investments. It will require decades of sound pension policy choices and fiscal discipline to make up for risky investments and costly decisions.
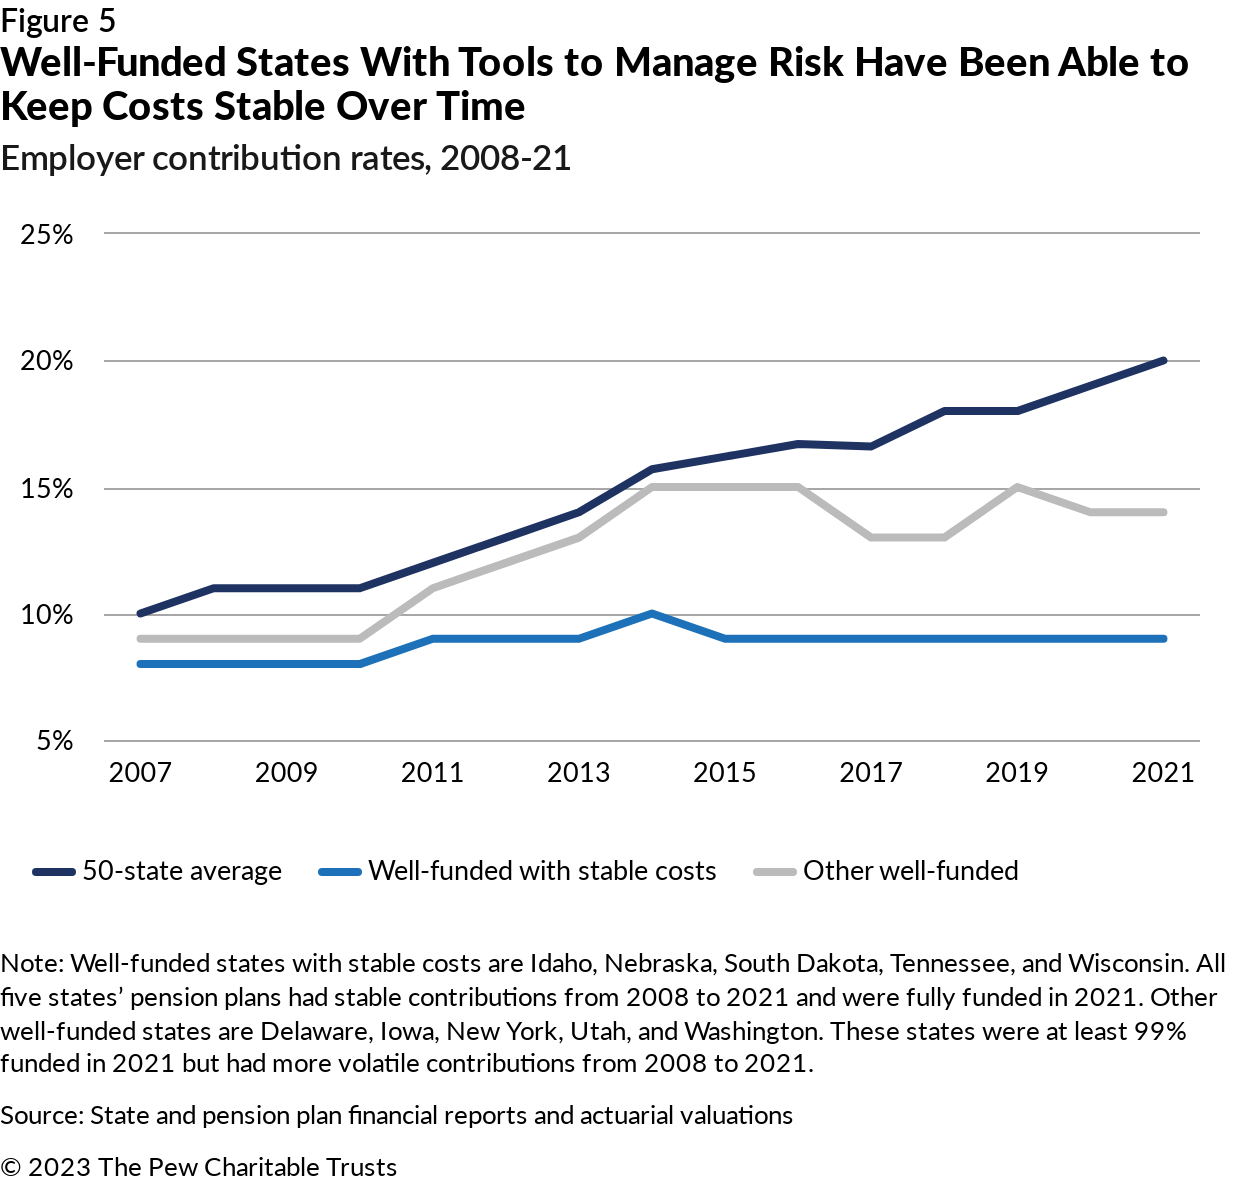
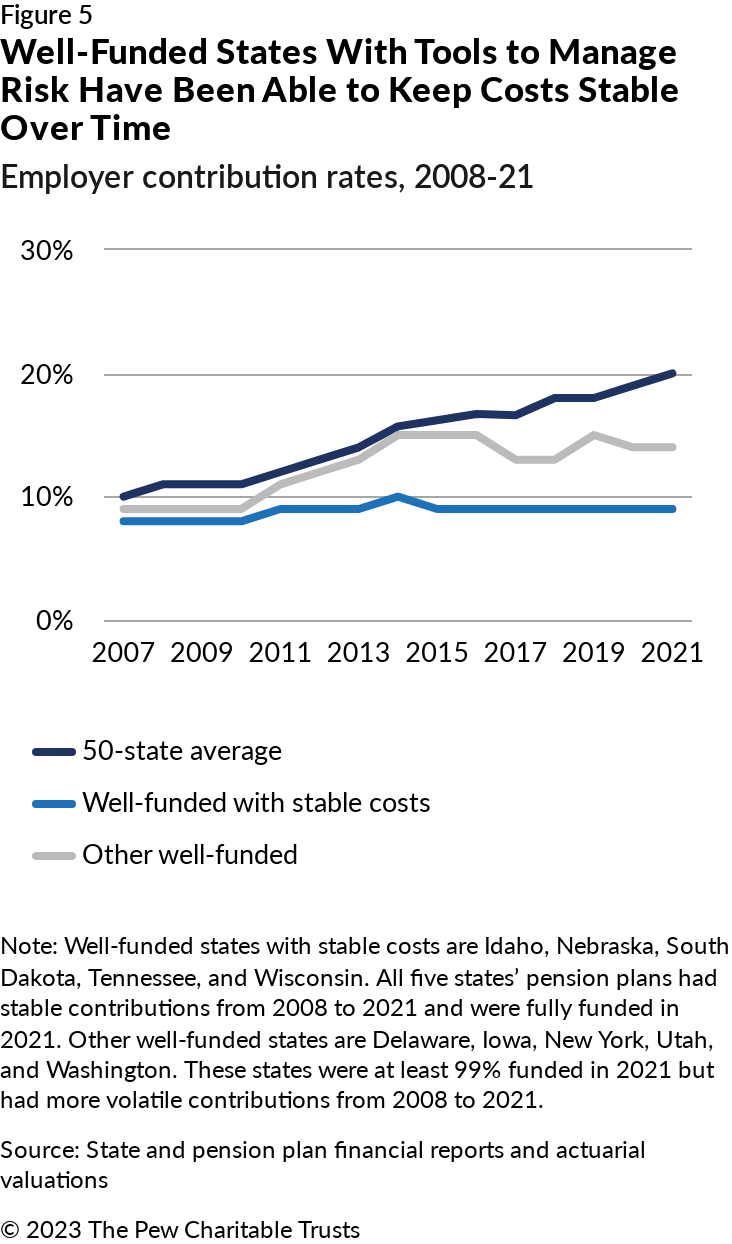
If future investment losses or economic uncertainty force states to increase pension contributions dramatically again because they haven’t put in place tools to manage risks, plan sponsors may be unwilling or unable to fund pension promises. That’s why predictability of costs is part of Pew’s test of fiscally sustainable pension policies. As models, states such as South Dakota, Tennessee, and Wisconsin have demonstrated that fiscal discipline and sound policy can help states keep pension promises by maintaining full funding and stable costs.8 All three of those states have maintained high funding levels while keeping employer contributions stable (fluctuating by no more than 3% of payroll from 2007 to 2021). As a result, the cost of pensions to state and local budgets has been relatively consistent regardless of whether you were looking at 2007, 2012, or 2020.
States need to start with a plan for uncertainty that ensures contributions will be actuarially sufficient to pay for benefits. But since that approach can lead to an unpredictable rise in contribution rates, policymakers will want to take additional steps to avoid budget stress and the crowding out of other public spending priorities. Three key approaches can be seen not only in states with a long track record of pension policy success but also in states that have taken steps to turn things around.
Build a contribution buffer: The biggest challenge for state budgets has been making up for years of contribution shortfalls in states that underpaid in good times and bad. But even states that committed to making actuarially based contributions, such as New York and Delaware, saw contributions fluctuate significantly following the 2007-09 recession because how much actuaries recommend in contributions will rise and fall based on investment performance.
One way for a state to avoid having to rapidly increase contribution rates to keep up with minimum pension contributions is to pay a little more when times are good in order to create a buffer for when things worsen. Thus, South Carolina adopted a new funding policy in 2017 because its previous system for making actuarial calculations to set contribution rates had failed to result in paying down pension debt. The new funding policy raised employee and employer contributions. Equally important, when times are good in the future (investment returns are high and budgets have surpluses), this new policy will keep contributions stable to ensure that a subsequent downturn doesn’t require policymakers to turn around and raise contribution rates again.9
Other states demonstrate a variety of ways to use funding policy to create a buffer against uncertain investment returns and other risks. Tennessee created a new benefit tier following the 2007-09 recession and sets contribution rates for that tier above the actuarial contribution rate, then puts the excess in a reserve fund that will cover future costs above the contribution rate. From 2021 to 2023, a policy governing surplus budgetary reserves in Connecticut led to nearly $6 billion in supplemental pension contributions to pay down legacy pension debt, strengthening the state’s balance sheet and reducing future contributions. Eleven other states similarly took advantage of unexpectedly high revenues and federal stimulus to make excess contributions beyond the actuarial target from 2021 to 2023.
Adjust benefits to share risk: Most states offer a defined benefit to public employees—a guaranteed lifetime benefit in retirement. But a number of public pension plans now include provisions that will adjust benefits or employee contributions based on plan funding, investment returns, or other actuarial factors. Other plans use a hybrid model, pairing a traditional defined benefit plan with a defined contribution plan, similar to a 401(k), so that a portion of the benefit has an employer guarantee and the other varies based on investment performance. Successful states such as South Dakota, Tennessee, and Wisconsin have used variable benefit provisions as part of their policies to maintain full funding and stable costs, while Colorado, Pennsylvania, Kentucky, and Rhode Island have included variable benefit provisions and hybrid plan designs as part of their comprehensive reforms to manage and mitigate future risk. And North Dakota just joined Alaska, Michigan, and Oklahoma as states that use a defined contribution plan as the core benefit for state employees.
Obviously making a portion of the benefit adjust based on funding, investments, or some other factor asks workers and retirees to bear a certain level of risk. Wisconsin, however, also offers an example of how these policies can sustainably share gains. Wisconsin retirees received cost-of-living adjustments (COLAs) of 5.1% and 7.4% in 2020 and 2021, respectively, but just 1.6% in 2022. As a result, even with recent high inflation rates and the low increase in 2022, retirees in Wisconsin’s public pension system had more protection from inflation than the typical public retiree.
Reduce level of investment risk: Projections of future economic growth, bond yields, and investment performance of a typical pension plan’s portfolio indicate that future returns are likely to be below both historic averages and what state pension plans typically assume. States have been adjusting to this new reality, with all 50 states having lowered their return assumptions since 2015.
From 1995 through 2021, state pension plans averaged 8% returns, though those high returns were paired with high volatility. In 2008, the average state pension plan assumed that investments would achieve an 8% return, but distress in financial markets meant plans fell far below that threshold that year. By 2021, the average state pension plan was assuming that future returns will be about 7%. Policymakers looking to further reduce fiscal risks from pension liabilities may consider additional reductions in the assumed rate of return.
Lowering the return assumption increases the likelihood of meeting investment targets and reduces the impact of any shortfall. It also allows pension plans to shift to a less risky investment portfolio. But this shift poses a different sort of challenge: As plan sponsors lower the return assumption, that increases a fund’s estimated liability, expanding the reported funding gap and the cost of paying down pension debt. But with recent projections showing that future pension plan returns are likely to be closer to 6% than 7% over the next 20 years, below both historical averages and what most state pension plans continue to rely on, policymakers will need to find ways to further reduce investment expectations.10
Some states have developed ways to make the shift to a lower investment assumption without breaking budgets. When investments beat expectations, the California Public Employees’ Retirement System (CalPERS) risk management policy automatically lowers the return assumption and shifts to a less risky investment portfolio, using investment gains to mitigate the associated costs.11 Connecticut lowered its return assumption from 8% to 6.9% as part of a broader set of contribution policy reforms that had the effect of spreading the cost out over time to avoid an immediate budget impact while ensuring that contributions became more predictable over the long run.12
Conclusion
States have made real progress in addressing the risk of insolvency and spiraling unfunded liabilities that they confronted following the 2007-09 recession. More than a decade of reforms to contribution policies, benefit designs, actuarial assumptions, and governance is paying dividends. At the same time, recent ups and downs in investment markets are a reminder that state pension plans have taken on significant investment risks, and not all states have adequate tools to manage that uncertainty. Stress testing can help policymakers assess those risks and make plans and policy changes as needed to address the uncertainty. States with a long track record of successfully managing their pension liabilities, as well as states that have made successful turnarounds, offer a menu of promising practices to offer public employees retirement security while keeping costs predictable, without pushing pension debt onto future generations or crowding out important public services.
Endnotes
- G. Mennis, T. Dawson, and S. Fehr, “Financial ‘Stress Test’ of Colorado Pension System Spurs Reform,” The Pew Charitable Trusts, July 26, 2018, https://www.pewtrusts.org/en/research-and-analysis/articles/2018/07/26/financial-stress-test-of-colorado-pension-system-spurs-reform.
- G. Mennis and M. Lowenthal, “Stress Testing in Connecticut Shows Reforms Stabilizing State Pension System,” The Pew Charitable Trusts, Jan. 30, 2019, https://www.pewtrusts.org/en/research-and-analysis/articles/2019/01/30/stress-testing-in-connecticut-shows-reforms-stabilizing-state-pension-system.
- D. Draine and A. Oberthur, “South Dakota Pension System Responds to Pandemic-Related Market Downturn,” The Pew Charitable Trusts, 2020, https://www.pewtrusts.org/en/research-and-analysis/articles/2020/06/23/south-dakota-pension-system-responds-to-pandemic-related-market-downturn.
- Korn Ferry, “Commonwealth of Pennsylvania State Employees’ Retirement System: 2022 Stress Testing and Risk Assessment” (2022), https://sers.pa.gov/pdf/2022-SERS-StressTestingandRiskAssessmentReport.pdf. The report shows on page 8 what the employer contribution rate will be annually through 2043 under current assumptions, with investment returns of 6.875%, as well as scenarios in which the next 10 years have returns of 4.875% (2% below assumption) and 8.875% (2% above assumption). The funded ratios by year for the three scenarios are available on page 9. Although an extended period of low returns would still allow the contribution rate for SERS to stay stable at less than current contributions, the asset shock scenario presented on pages 11-13, with 20% investment losses in 2022, would require contribution rates above current levels. These analyses are based on an actuarial valuation, which in turn is based on data as of Dec. 31, 2021, meaning that the strong investment returns from 2021 are included but not the subsequent losses from 2022.
- AON, “Stress Testing Analysis: Pennsylvania Public School Employees’ Retirement System (PSERS)” (2022), https://www.psers.pa.gov/About/Investment/Documents/a-PSERS%20-%202022%20Stress%20Testing%20Analysis%20(2022.12)%20FINAL.pdf. The stress test contains projections through 2050 of key actuarial indicators, including the contribution rate, for a baseline scenario with 7% annual returns as well as a low-return and excess-return scenario with investment returns of 5% and 9%, respectively, starting on page 8. Page 20 features a simulation analysis in which multiple potential investment scenarios are generated using the capital market assumptions developed by PSERS’ external analysts to show the range of potential employer contribution rates and other variables of interest.
- F. Yousofi, G. Mennis, and M. Mills, “How States Can Account for Climate Risks to Pension System Assets,” The Pew Charitable Trusts, May 15, 2023, https://www.pewtrusts.org/en/research-and-analysis/articles/2023/05/15/how-states-can-account-for-climate-risks-to-pension-system-assets
- State of Wisconsin Investment Board, “Stress Testing,” accessed May 17, 2023, https://www.swib.state.wi.us/stresstesting. This stress test uses simulation analysis on page 33 to show the range of employer contribution rates under multiple investment scenarios. Contributions are expected to drop from 14.2% of payroll to 12.9% of payroll, but a 25th percentile scenario (1 in 4 chance of lower than expected investment returns causing contributions to rise to this level or higher over 10 years) would cause costs to rise to 15.2% of payroll, and a 5th percentile scenario (1 in 20 chance of investments causing contributions to rise to this level or higher) would cause costs rise to 17.9% of payroll. Other simulations look at employer contributions based on different levels of long-term returns and volatility, helping policymakers and stakeholders understand the trade-off between returns and risk under various investment approaches. The simulations also look at what happens to retiree COLAs (dividends in Wisconsin) based on the risk-sharing COLA provisions the state uses, an example of how stress testing can also be applied to benefits and retirement security.
- The Pew Charitable Trusts, “Piecing Together Elements of Public Pension Plan Success” (2022), https://www.pewtrusts.org/en/research-and-analysis/articles/2022/06/28/piecing-together-elements-of-public-pension-plan-success; The Pew Charitable Trusts, “Tennessee’s Road to Public Pension Plan Success” (2022), https://www.pewtrusts.org/en/research-and-analysis/articles/2022/11/04/tennessees-road-to-public-pension-plan-success; The Pew Charitable Trusts, “Wisconsin Pension Official Details State’s Approach to Weathering Market Volatility” (2023), https://www.pewtrusts.org/en/research-and-analysis/articles/2023/01/10/wisconsin-pension-official-details-states-approach-to-weathering-market-volatility.
- G. Mennis, S. Banta, and D. Draine, “Assessing the Risk of Fiscal Distress for Public Pensions: State Stress Test Analysis” (working paper, Harvard Kennedy School, Mossavar-Rahmani Center for Business and Government, 2018), https://www.hks.harvard.edu/sites/default/files/centers/mrcbg/files/AWP_92_final.pdf.
- The Pew Charitable Trusts, “State Public Pension Fund Returns Expected to Decline” (2022), https://www.pewtrusts.org/en/research-and-analysis/issue-briefs/2022/05/state-public-pension-fund-returns-expected-to-decline.
- CalPERS, “CalPERS Trust Level Review Risk Management Summary” (2021), https://www.calpers.ca.gov/docs/forms-publications/risk-management-summary-jan-2021.pdf.
- Office of Connecticut Governor Dannel P. Malloy, “Gov. Malloy: Independent Analysis Shows Recent Adjustments Are Providing a More Stabilized Path for State Employee Pension System,” news release, Dec. 14, 2018, https://portal.ct.gov/Malloy-Archive/Press-Room/Press-Releases/2018/12-2018/Gov-Malloy-Analysis-Shows-Adjustments-Are-Providing-Stabilized-Path-for-Employee-Pension-System.


ADDITIONAL RESOURCES

Fact Sheet

Podcast