For state-by-state data please see the tables below.

Composition of Medicaid enrollees

In practice, Medicaid functions as two separate insurance programs for low-income individuals, one for children and parents and the other for elderly and disabled individuals of all ages. Elderly and disabled individuals made up only 24 percent of all Medicaid enrollees in 2010, but they accounted for approximately 64 percent of spending on benefits because they are more likely to have complex health care needs that require costly acute and long-term care services.29,* As a result of their high cost per capita, the proportion of a state's Medicaid beneficiaries who are elderly and disabled is a major driver of Medicaid spending.30 On average, Medicaid spends over five times more on these people than on parents and children with Medicaid coverage.

  • * Unlike employer-sponsored health insurance and Medicare, Medicaid covers long-term care services and supports for its enrollees. (Source: National Health Policy Forum, The Basics: National Spending for Long-Term Services and Supports (LTSS), 2012 (Washington: George Washington University, 2014), accessed April 16, 2014, http://www.nhpf.org/library/the-basics/Basics_LTSS_03-27-14.pdf.)

Distribution of Medicaid enrollment and payments for services by enrollment group

2010

For state-by-state data please see the tables below.

Composition of Medicaid enrollees

State variation in the percentage of Medicaid enrollees who are elderly or disabled—ranging from 16 percent in Arizona to 38 percent in Maine—can be driven in part by differences in the health and demographic makeup of the state's population as well as by the Medicaid eligibility thresholds set by the state.31

Distribution of Medicaid enrollment and payments for services by enrollment group

2010

For state-by-state data please see the tables below.

Composition of Medicaid enrollees

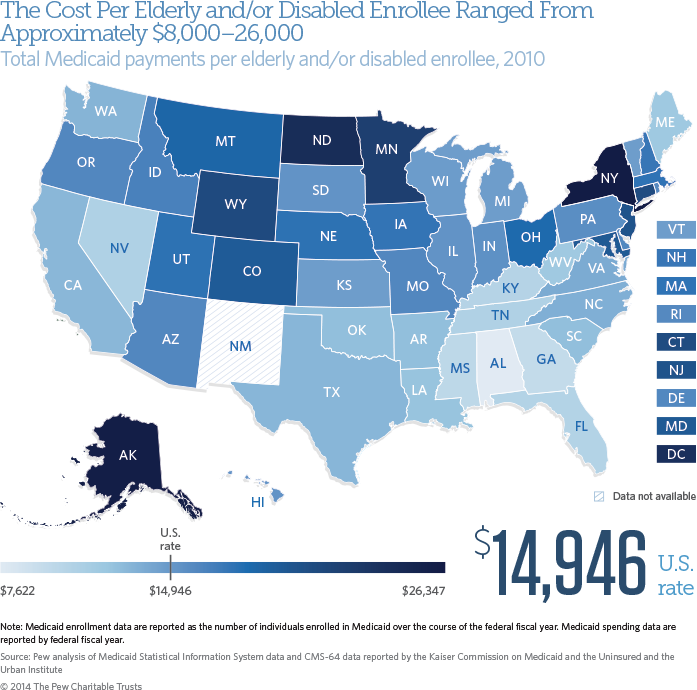
In 2010, the average Medicaid expenditure per elderly and disabled enrollee was $14,946, ranging from nearly $8,000 in Alabama to nearly $27,000 in New York. In contrast, the average Medicaid expenditure per child and parent was much lower, ranging from $1,354 in California to $5,227 in Alaska. Factors that affect this variation include program eligibility and optional benefits, provider payment rates, pharmaceutical discounts, regional differences in the cost of providing health care and the health status and poverty rate of the population.32 Many of these factors influence variation across states in per-person spending for all insured individuals, regardless of the source of their health insurance coverage.33

Total Medicaid payments per enrollee by enrollment group,

2010