Philadelphia’s Post-ARPA Fiscal Reality
What’s next for the city

Editor’s note: This brief was updated on March 26, 2024 to correct text describing the color representing ARPA money in Figure 1.
Overview
The start of the COVID-19 pandemic in 2020 forced officials in cities throughout the country to deal with unexpected budget shortfalls quickly. To close a projected one-year gap of $649 million, Philadelphia was forced to take several steps—including drawing down its operating fund balance, postponing planned tax-rate reductions, temporarily increasing some taxes, and reducing spending.1 But that didn’t address the long-term fiscal issues.
Then, along came the American Rescue Plan Act (ARPA), which Congress adopted in 2021; ARPA provided Philadelphia with $1.4 billion to use through December 2024.2 Local officials decided to use all the money to help address what they said would have been a $1.5 billion cumulative budget shortfall without it.3
This brief—based on research and analysis that PFM Group Consulting, a Philadelphia-based public finance advisory firm, conducted for The Pew Charitable Trusts—focuses on the city’s financial prospects after the federal ARPA money is spent. It examines how economic downturns could affect city revenue and what budgetary strategies local officials could consider, whatever the city’s fiscal condition.
Among the findings:
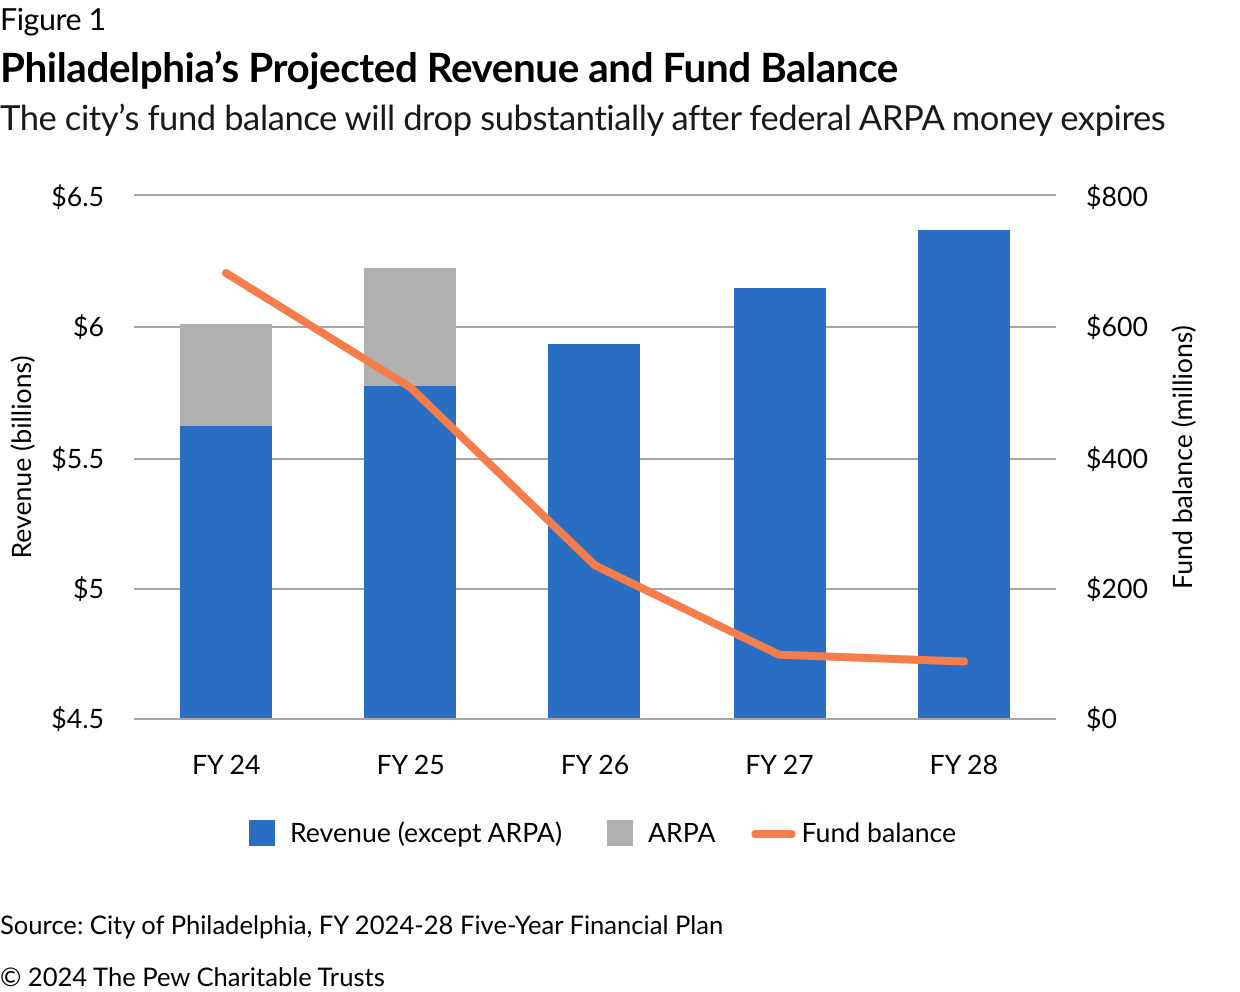
- Under the city’s current five-year financial plan, Philadelphia’s fund balance will drop substantially as the federal ARPA money runs out, falling from a projected figure of roughly $682 million for this fiscal year (which ends in June 2024) to less than $87 million in fiscal year 2028.4
- In each of the years covered by the plan, the city is projected to spend more than the revenue coming in. Assuming these projections are accurate, that balance of revenue and expenditures is ultimately unsustainable, though not in the short run—meaning that policymakers have time to make adjustments.
- In the event of an economic downturn, depending on its nature and magnitude, the city could expect a revenue shortfall of more than $1 billion over five years compared with the current projections included in the five-year financial plan. This would force policymakers to make hard choices, some of which are outlined in this brief.
How would a downturn affect the city’s finances?
The Pennsylvania Intergovernmental Cooperation Authority Act requires the city of Philadelphia to publish a five-year financial plan each year, reflecting the city’s revenue and expenditure projections for that period. The plan and budget must be balanced, and the authority, known as PICA, must approve the plan.5
There are inherent unknowns in any long-range financial plan, as the COVID-19 pandemic demonstrated. Even during times of relative economic stability, it can be difficult to predict revenue and expenditures accurately.6
Philadelphia’s tax structure makes the city’s finances particularly vulnerable to economic downturns, due, in part, to its heavy reliance on the relatively volatile wage tax. A 2021 Pew analysis found that projected revenue shortfalls in the months after the pandemic began were smaller for cities that raised a greater share of their revenue from property taxes—which tend to be more stable.7
The city’s current five-year plan, which PICA approved in June 2023, projects a fiscal 2028 fund balance of $86.6 million—substantially lower than the current fiscal year’s projected $682 million.8 Revenue is generally expected to increase over this period, but so are expenses. Once the ARPA money is gone, the city’s financial cushion shrinks. This is shown in Figure 1, which depicts the city’s projected revenue from fiscal 2024 to fiscal 2028 (the bars), the share that represents ARPA money (shown in gray), and the projected year-end fund balances (the orange line).
The projected fund balance at the end of the period is low but not abnormally so in historical terms: From fiscal 2003 through fiscal 2020, the city’s year-end fund balance averaged $145 million.9 But since the city budget has grown dramatically in recent years, the projected fund balance—in percentage terms—is far below what it was in many previous years. And the number itself is substantially lower than the 17% of city expenditures (roughly $1 billion) that the Government Finance Officers Association (GFOA) has recommended.10 A city’s fund balance can be important both for maintaining sufficient reserves in case of emergency as well as for influencing its credit rating and, thus, its borrowing costs.
Although the five-year plan shows the city ending each year with positive fund balances, the city’s expenditures are projected to exceed revenue in every year. (See Table 1.)
Table 1
Philadelphia’s Revenue, Expenditures, and Operating Surplus/Deficit
The city is projected to operate at a deficit throughout the five-year plan
| Total Revenue | Total Expenditure | Operating surplus/(deficit) | |
|---|---|---|---|
| FY 2024 | $6,012,114,000 | $6,195,414,000 | ($183,300,000) |
| FY 2025 | $6,225,178,000 | $6,276,888,000 | ($51,710,000) |
| FY 2026 | $5,934,535,000 | $6,236,704,000 | ($302,169,000) |
| FY 2027 | $6,148,357,000 | $6,314,819,000 | ($166,462,000) |
| FY 2028 | $6,367,225,000 | $6,406,983,000 | ($39,758,000) |
|
Source: City of Philadelphia, FY 2024-28 Five-Year Financial Plan |
This arrangement cannot go on indefinitely. The ARPA money, used partially to bolster fund balances, has filled budget gaps resulting from the COVID-19 pandemic and has given city officials time to craft longer-term budget policies.
If the economy grows as predicted in the five-year plan, those policy decisions might not arise as soon or be as difficult. But if the economy performs more poorly than projected, the opposite might be the case. With the latter possibility in mind, PFM created two less-rosy revenue scenarios based on the city’s experience during the two recessions before the pandemic. They are:
- A moderate or “cyclical” recession based on the Dot-Com Recession in the early 2000s.
- A severe recession based on the Great Recession from 2007 to 2009.
PFM chose these two downturns, rather than the more recent one caused by COVID-19, as they represent more typical economic patterns. In each case, the scenarios assume that a recession would arrive in fiscal 2025, meaning before July 1 of that calendar year.
To develop the scenarios, PFM used historical revenue and tax data to calculate how much the revenue raised by the city’s major taxes fluctuated during those recessions in percentage terms, controlling for any adjustment to the tax rate. This was done for the taxes on wages and earnings, business income and receipts, sales, and parking—plus the portion of the property tax that pays for city services beyond the school district. Combined, these taxes accounted for roughly 70% of the city’s budgeted revenue in fiscal 2023.11 The analysis also studied how the city’s licensing and permitting fees responded during the two earlier recessions and calculated growth rates based on the overall revenue change.
To create recessionary revenue scenarios, PFM applied the growth rates calculated from those recessions to the later years (fiscal 2025-28) of the city’s five-year plan for each revenue source. The city’s revenue forecasts from the current five-year plan were used for line items for which growth rates could not be calculated. This analysis focused on the revenue collected by the city and did not estimate how expenditures might change under the two scenarios. (For more detailed information on the methodology, see the appendix.)
Under the recessionary revenue scenarios that PFM modeled, Philadelphia could experience a potential cumulative revenue shortfall of $1.3 billion to $1.5 billion over the next five years, relative to the city’s baseline revenue forecast. (See Figure 2 and Table 2.) Although hypothetical, these scenarios shed light on the impact an economic downturn might have on the city’s finances.
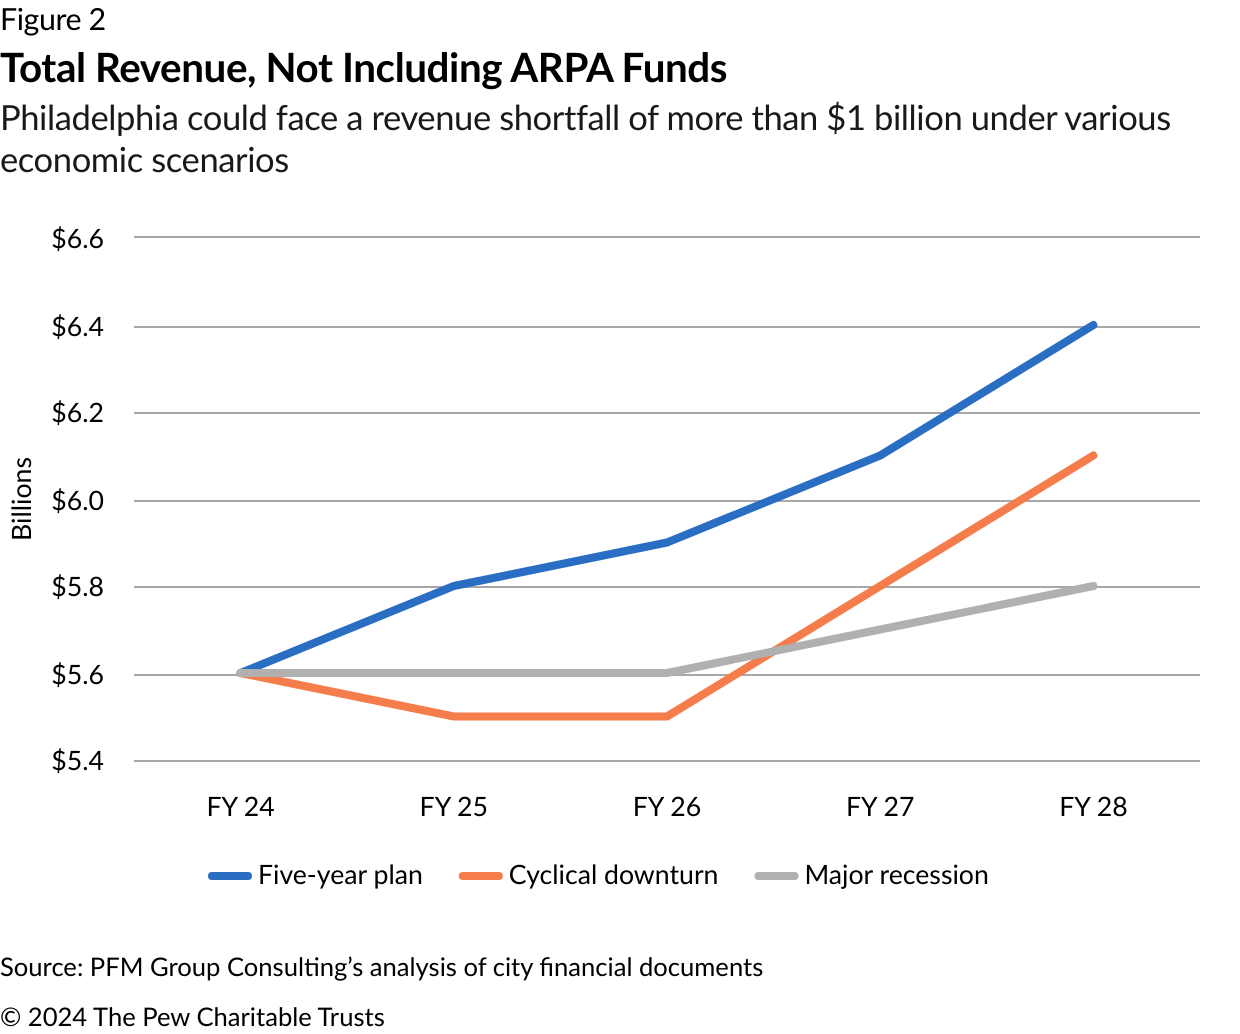
Table 2
Approximate Potential Revenue Shortfall From 5-Year Plan Under Varying Economic Scenarios, by Year
| Cyclical downturn | Major recession | |
|---|---|---|
| FY 2025 | ($295,000,000) | ($190,000,000) |
| FY 2026 | ($420,000,000) | ($380,000,000) |
| FY 2027 | ($395,000,000) | ($450,000,000) |
| FY 2028 | ($255,000,000) | ($520,000,000) |
| Cumulative | ($1,365,000,000) | ($1,540,000,000) |
|
Note: FY 2024 was omitted from the table because the model assumes a recession would occur in FY 2025, leaving FY 2024 revenue unchanged. Source: PFM Group Consulting’s analysis of city financial documents |
These two scenarios also offer an important look into how the nature of an economic downturn may affect the city’s revenue dips and recovery. For example, revenue decreases sharply and rebounds relatively quickly in the cyclical scenario, based on the city’s experience during the Dot-Com Recession; revenue decreases less at first and is relatively slow to recover in a major downturn like the 2007-09 recession, resulting in a greater overall revenue shortfall.
Such shortfalls, regardless of their severity or length, would require fiscal policy responses from the city.
What are some of the city’s potential policy responses?
To identify the range of options available to city officials in these scenarios and others, PFM developed a policy playbook—a series of possible city responses, based on a framework from GFOA, a professional association of state, provincial, and local government finance officers in the United States and Canada.
Discussions about how to address budget deficits often focus on raising taxes or cutting services—and those tools shouldn’t be ruled out. But one aim of the playbook was to widen the aperture of paths to pursue—in good times and bad—to include ways of increasing revenue without raising tax rates, decreasing costs without cutting services, and improving performance.
In 2020, GFOA released a series of reports outlining near-term strategies that local leaders could implement to address budget challenges. The reports focused on strategies that would show results in 12 to 18 months and grouped the responses into four major categories.12 In considering these strategies in a Philadelphia context, PFM collapsed the four categories into three:
- Primary near-term strategies: The lowest-risk fiscal responses that are advisable even during times of fiscal health.
- Cautionary near-term strategies: Options that are not advisable during times of fiscal health but may become necessary during fiscal distress.
- Inadvisable near-term strategies: High-risk approaches that should not be considered except in periods of extraordinary financial distress—and with which the long-term risks may outweigh the immediate benefits.
Of course, these categories are fluid and context-specific, and some policymakers will find options more palatable than others, based on their own political perspectives. The categories are best viewed as an organizing framework to guide budget decisions in times of both financial distress and surplus.
In considering these categories and the options within them, city officials will face additional considerations—including the degree to which city government can implement a policy change on its own, the scale of the change and its fiscal impact, when potential savings might be realized, potential improvements in government efficiency and service delivery, and the equity consequences.
Based on these considerations and others, PFM developed an extensive set of policy responses the city could take. What follows is a selection of these options, included here for their relatively high degree of city control. The timing of impact ranges from immediate (current or next budget cycle) to medium (impact within year two or three of a five-year plan) or long (year three or four of a five-year plan or beyond). In highlighting these strategies, Pew and PFM do not mean to say the city is not already pursuing some parts or components of them, but rather that there could be additional or more targeted efforts.
Primary near-term strategies
Policy option: Evaluate current tax incentives and abatements.
Current base: Tax incentives and abatements cost the city money in the form of forgone revenue. According to the city’s 2022 Annual Comprehensive Financial Report (ACFR), among the most significant amounts forgone in that year were:13
- $90.1 million from the program that gives a 10-year real estate tax abatement to new construction and to the rehabilitation of existing structures.
- $60.8 million from Keystone Opportunity Zones, areas where the state encourages investment by making businesses that locate there exempt from most business taxes.
- $2.2 million from the community development corporation tax credit, a program that gives a credit (to be applied against the business income and receipts tax obligation) to businesses that make a financial contribution to economic development efforts in certain parts of the city.
It should be noted that these figures represent short-term revenue losses; the idea behind at least some of the incentives was that they would boost the local economy and, by extension, the city’s long-term revenue picture. Some recent research has questioned the overall effectiveness of many such programs.14
Estimated fiscal impact: It is difficult to provide precise estimates of the fiscal impact of enacting, revising, or eliminating tax incentives; decisions by businesses and residents shift based on the economic environment and many other factors beyond the availability of tax reduction programs (or the lack thereof). To the extent possible, the city could conduct a comprehensive review of the potential fiscal impact associated with any changes in the programs, while also ensuring that they align with the city’s organizational, strategic, and equity goals.
In 2019, the city reduced the value of the property tax abatement on residential construction. The long-term impact of this policy change remains to be seen.
Equity impact: This varies by program, some of which were created to support or protect low-income residents or other disadvantaged groups. When incentives do not (or no longer) meet the “but for” test—would the intended outcome have happened with no incentives?—the forgone revenue can result in groups that aren’t eligible for the program paying a higher share of the cost of supporting municipal services.
Degree of city control: High
Timing of impact: Medium
Policy option: Improve procurement and vendor management in ways that encourage more local bids on city contracts, generating increased competition and presumably lower prices.
Current base: In fiscal 2024, the city expects to spend just over $1.4 billion to purchase services and $152 million for materials, supplies, and equipment.15
Estimated fiscal impact: There could be substantial savings given how much the city spends on contracts, but the specific amount would be hard to estimate.
Potential changes in the procurement system could include the following:
- Expanding prioritization of local vendors in the bidding process.
- Either increasing the number of contracts under the thresholds of $75,000 (for all businesses) and $100,000 (for certified local business entities)—above which formal requests for proposals or bids are required—or raising those thresholds, to make it less cumbersome for smaller businesses to bid.
- Expanding business development programs for diverse businesses, as well as the Contracts Hub on the Phila.gov website—the centralized location where vendors can access all contracting opportunities.
An increased number of bids could drive down the cost of contracts. And prioritizing local businesses and having them receive more contracts could help them scale, allowing the companies to grow and contribute more revenue to the city’s coffers. Given the amount the city spends, there could be significant potential savings, but the amount is inherently difficult to project.
Equity impact: Reinvesting locally increases access to contracts for Philadelphia-based businesses. Local businesses would have access to more opportunities for contracts if the $75,000 and $100,000 thresholds were raised. This also has the potential to spur economic growth by increasing access to city contracts for local companies and encouraging their expansion and growth.
The Contracts Hub on the city’s website gives residents and potential vendors increased access to information about contracting with the city. Residents might also be able to find Philadelphia minority- and women-owned businesses and disadvantaged business enterprises more easily there.
With greater access to city procurement, competition for contracts would likely increase, which might also improve the level and quality of services the city receives.
Degree of city control: High
Timing of impact: Medium
Policy option: Do a better job of managing overtime costs.
Current base: The city is projected to spend approximately $270 million for employee overtime in fiscal 2024—about $20 million more than in the previous year.16 The increase in overtime spending is being driven by staffing shortages (primarily in the Streets, Police, Prisons, Parks and Recreation, and Fleet Services departments), which require employees to work overtime to provide services, as well as salary increases from new labor contracts. Even before the pandemic-related staffing shortages occurred, PICA, which oversees city finances, had expressed concern about the city’s level of overtime spending.17
Estimated fiscal impact: Overtime spending is projected to represent approximately 4% of the city’s budgeted expenditures in fiscal 2024.18 Under any circumstances, a certain level of overtime is appropriate (e.g., public safety emergencies). And, in some cases, it can be more cost-effective to pay overtime—in which workers receive time and a half—than to hire new employees and pay for their benefits, equipment, and training. The savings from reducing overtime may not be substantial. But the benefits of an overtime review go beyond dollars; reducing the reliance on overtime staffing ensures that the city’s workforce is not spread too thin, which could help improve overall service delivery as well as employee recruitment and retention. Given the current challenges in hiring and retaining staff, overall personnel costs may turn out to be lower than budgeted—even with the overtime spending.
A few initial strategies the city could explore include:
- Making renewed efforts to address the city’s recruitment and staffing challenges. As of Sept. 30, 2023, roughly 19% of city positions were unfilled.19 Identifying the reasons for the recruitment and retention challenges—and acting on them—will reduce the need for current staff to work overtime. It is important to note that staffing challenges are a national issue.
- Revamping the onboarding process and evaluating ways to reduce the time required to fill critical vacancies—an effort Philadelphia’s Office of the Chief Administrative Officer is already leading.
- Continuing to reduce the inmate population in the city’s jails, which should alleviate staffing demands and overtime costs there. As of Sept. 30, 2023, the Department of Prisons had 909 unfilled positions, or 42% of its budgeted workforce.20 This is a somewhat complicated challenge because it requires the cooperation of the court system, which the city administration does not control.
- Exploring opportunities to reduce court-related police overtime costs by leveraging remote technology and operational procedures. A 2019 report by PICA and international accounting firm Baker Tilly, for example, found that the city could save up to $7.6 million annually by letting the officer scheduling system take into account required court dates.21 Currently, officers get paid overtime for appearing in court on one of their days off.
Equity impact: Improving overall staffing and reducing the need to rely on overtime can allow the city to provide better services and explore opportunities to expand them.
Degree of city control: Medium to high
Timing of impact: Medium to long
Cautionary near-term strategies22
Policy option: Explore new or revised taxes and fees to capture revenue from growing and emerging economic activities and technologies, such as short-term rentals and ride-sharing companies.
Current base: Philadelphia can generate revenue by consistently reviewing its taxes and fees and how they align with emerging economic activities and technologies, and by benchmarking peer cities and states.23 For example, the city recently began requiring short-term rentals to be licensed and subject to the hotel tax.24
Estimated fiscal impact: In 2018, the Philadelphia Parking Authority (PPA) called for a 50-cent flat tax on every ride-sharing or taxi trip originating in the city, estimating that it would raise $8 million to $10 million per year for the School District of Philadelphia.25 But the proposal was not authorized by the state legislature. Currently, the PPA collects a 1.4% tax on gross receipts from ride-sharing trips originating in the city.26 Revenue from this tax in fiscal 2023 allowed for a nearly $6 million payment to the school district.27
A comprehensive review would allow the city to estimate the revenue impact of new or revised taxes and fees. Their potential volatility should also be examined.
Equity impact: Uncertain. Any review of how to tax emerging technologies would require an equity impact assessment to identify potential negative impacts and offsets.
Degree of city control: Varies. The city may be able to enact or update certain taxes and fees unilaterally. In other cases, Philadelphia may be constrained by state and federal laws or regulations that limit its autonomy.
Timing of impact: Intermediate to long term, depending on the options pursued.
Policy option: Explore a managed competition process for the delivery of some city services.
Current base: Managed competition is a process used to identify the most cost-effective method for delivering services to city residents. Under managed competition, city departments compete against private contractors in bidding to provide some services. It is not the same as privatization, which often assumes that a private entity is more cost-effective than public delivery. Rather, it evaluates cost and delivery among public and private providers alike.
The city has not used a managed competition process since the 1990s.
Estimated fiscal impact: A managed competition process is meant to produce the highest-quality and most efficient services possible. Through increased efficiency, overall costs for the services should decrease—although opposition is likely from officials who believe public services should generally be delivered by public employees.
Equity impact: Managed competition may result in more cost-efficient services. Through the cost savings, the city could spend additional funds in other areas that may have greater need.
Degree of city control: High
Timing of impact: Long
Inadvisable near-term strategies
Policy option: Make only the minimum required payments to pension funds for city workers and retirees.
Current base: In fiscal 2024, the city budgeted roughly $868 million for its pension funds, roughly 14% of general fund expenditures.28
In fiscal 2023, the city contributed about $842 million to its pension funds. For Philadelphia that year, the state-mandated minimum municipal obligation (MMO) was $664.1 million.29 A municipality must contribute at least the MMO to its employee pension plan.
In recent years, the city has contributed more than the MMO, relying instead on its own revenue recognition policy (RRP), designed to improve the pension fund’s financial status. As part of the RRP approach, the city directs a portion of its sales tax revenue to the pension system (more than $90 million in fiscal 2023), along with a portion of employee contributions added under more recent collective bargaining agreements—and then calculates the balance of its obligation as if these extra payments were not being made.30
Estimated fiscal impact: In fiscal 2022, if the city had paid only the MMO instead of the RRP, it would have lowered that year’s expenditures by $49.2 million. But contributing only the MMO would delay improvements to the city’s weak pension-funded status, lead to higher contributions in the future, and put downward pressure on the city’s bond ratings, which could lead to higher borrowing costs.
Equity impact: Weakening the pension system’s sustainability could affect the retirement security of municipal employees, many of whom are city residents and rely heavily on their pensions.
Degree of city control: Medium
Timing of impact: Immediate to medium
What’s next?
While Philadelphia is in a relatively stable financial position today compared with the past, the expiration of federal ARPA funding will present some challenges. And should the economy perform worse than expected, the city’s prospects would be that much more complicated.
But there are strategies the city could employ today that will help it set itself up for the future, several of which are identified in this brief and many more of which are included in the playbook. One of the key findings of this analysis is that officials have policy options to pursue that go beyond raising taxes or cutting services. Awareness that these paths exist is a key first step to putting the city on stronger fiscal footing before the next downturn arrives—and dealing with it when it does.
About this brief
This brief was written by Jason Hachadorian, an officer with The Pew Charitable Trusts’ Philadelphia research and policy initiative, based on research conducted for Pew by a team at PFM Group Consulting, including Michael Nadol, Matthew Stitt, and Jack Denison. Larry Eichel, a senior adviser to the initiative, edited the brief, along with Jolene Nieves Byzon and Tamara El-Waylly.
Acknowledgments
The brief benefited from the comments of two independent reviewers: Michael A. Pagano, dean emeritus of the College of Urban Planning and Public Affairs and professor emeritus of public policy, management, and analytics at the University of Illinois Chicago; and Folasade Olanipekun-Lewis, vice president of operating and community partnerships at Vantage Airport Group. This analysis does not necessarily reflect the opinions of these reviewers or their institutions.
Appendix
The methodology used to produce the data shown in Figure 2 and Table 2 is based on a simplified approach to revenue forecasting. For Philadelphia, the budgetary impact of any economic downturn would be more varied and complex than simply a decline in its locally generated tax revenue. But focusing on that element is a valuable tool for long-term planning.
To estimate the revenue losses associated with the two recession scenarios, PFM analyzed the annual percentage change in the underlying revenue base for the city’s primary local tax revenue sources, as well as the overall decrease in the city’s licensing and permitting revenue, during two previous recessions. Specifically, PFM looked at the recession in the early 2000s (the Dot-Com Recession) and the Great Recession from 2007 to 2009, calculating alternate growth rates for the following revenue sources:
- Wage tax
- Property tax
- Business income and receipts tax
- Sales tax
- Parking tax
- Licenses and permitting fees
The annual rates of change for each source were then applied to the city’s current five-year plan for each projected year—the years after the adopted budget year—to estimate the magnitude of a potential revenue downturn.
The analysis used the following data sources:
- The city of Philadelphia’s Annual Comprehensive Financial Report (ACFR), fiscal 1998-2022: The ACFR details the city’s financial position for each fiscal year. It also includes revenue data for the current and prior fiscal years. PFM used the ACFR to gather the city’s revenue collection from fiscal 1998 to fiscal 2022.
- Summary schedule of tax rates since 1952: The city publishes a document detailing the tax rates and their effective dates for each tax the city levies and collects. PFM used the historic tax rates to estimate the underlying tax base for the relevant fiscal years in the analysis.
- Wage tax collections by resident and nonresident, 2019-20: A detailed analysis produced by the city’s Department of Revenue showing the total wage tax revenue collected by industry for resident and nonresident workers. The percentage split of wage tax paid by resident and nonresident workers was used in the analysis to estimate the tax base.
- Summary of business income and receipts tax (BIRT) revenue, 2009-19: A detailed breakdown of BIRT revenue from the gross receipts and net income portions of the tax published by the Revenue Department.
- Proposed and adopted five-year plan, fiscal 2024-28; adopted budget detail, fiscal 2024: The various budget documents the city released were used to create the simplified financial model to which the alternate revenue scenarios were applied.
As noted above, the historic revenue data as reported in the city’s ACFR was used as the basis for estimating the underlying base for each tax source. The overall approach to estimating the tax base was to divide the reported revenue for each tax base by the tax rate at that time. However, due to data availability and the characteristics of each tax, slightly varying approaches were used to derive the underlying base for some taxes. The following section outlines the approach used to estimate the base for those taxes.
Wage tax: Philadelphia levies a tax on salaries, wages, commissions, and other compensation on all city residents, regardless of where they work, and on nonresidents who work in the city. The tax rate differs for residents and nonresidents: As of July 1, 2023, residents were taxed at a rate of 3.75% and nonresidents were taxed at 3.44%.
In the ACFR, the wage tax revenue is not divided into resident and nonresident categories. The Revenue Department now provides such data, but it was not available for the years spanning the two recessions used to create the alternate revenue assumptions.
To estimate the overall base, accounting for the different tax rates applied to residents and nonresidents, as well as the variation in wages and employment between residents and nonresidents, PFM used the following approach:
- For each year, analysts calculated a weighted tax rate reflecting tax revenue from residents and nonresidents.
- To get that rate, the resident and nonresident tax rates were multiplied separately by the share of tax revenue collected from residents and nonresidents, using 2019, the last full pre-pandemic year. (In that year, residents accounted for 63% of wage tax revenue; nonresidents accounted for 37% of wage tax revenue.) The two numbers from these calculations were then added together to create a single, weighted tax rate.
- The city also changed the wage tax rates during the study period. In most instances, the change aligned with the fiscal year. However, there were some cases in which the tax rate changed on Jan. 1, halfway through the fiscal year. The revenue data was provided on a fiscal year basis. So, if the tax rate changed during the fiscal year, the average of the blended tax rates over the course of that fiscal year was used to create a single tax rate.
- The tax revenue in each year was then divided by the derived tax rate for that year to estimate the overall tax base.
Property tax: Philadelphia applies a single tax rate to all property classes in the city. However, it did change the property tax rate during the relevant years in this analysis. For example, in 2011, the city increased the portion of the property tax rate that funds city services from 3.305% to 4.123%.
Like the approach taken with the wage tax, if a tax rate changed halfway through a fiscal year (Jan. 1), PFM created a weighted average tax rate for that fiscal year. The average tax rate was then used to estimate the tax base for that year.
Business income and receipts tax (BIRT): The city’s BIRT is composed of two taxes with different rates and bases. But it is shown as a single revenue source in budgets and ACFRs. The BIRT applies to businesses engaged in for-profit activities within the city. In fiscal 2024, the city taxed businesses 1.415 mills (or $1.415 per $1,000) on all gross receipts and 5.99% on taxable net income. Businesses with less than $100,000 in taxable gross receipts were not required to pay the BIRT.
Business tax rates and rules have changed over the years. To account for those fluctuations, PFM followed a similar approach to that used in the wage tax collection:
- For each year, PFM calculated a weighted BIRT tax rate based on the share of total BIRT revenue from the two taxes—the one on gross receipts and the one on net income.
- These weighted rates were calculated from the Revenue Department’s detailed analysis of BIRT collections in 2019. Seventy-five percent of the BIRT revenue was from the net income portion and 25% from gross receipts.
- During the time periods examined, the city reduced the gross receipts tax rates. In fiscal years where the tax rate changed, PFM calculated an average of the two tax rates.
Sales tax: Effective October 2009, the state authorized the city to increase its sales tax rate from 1% to 2% in response to the 2007-09 recession’s fiscal impact. As a result, in fiscal 2010, the sales tax rate was 1% for a quarter of the fiscal year and 2% for the remainder. To estimate the overall tax base during that fiscal year, PFM created a weighted average tax rate to use as the single rate for that year (1.75%).
After calculating the alternate growth rates for each revenue source based on past recessions, PFM applied the annual percentage change to the respective line items to estimate the potential effect on revenue. Using the city’s fiscal 2024 budget figure as the starting point, the growth rates were applied to each later year in the city’s five-year plan.
The first year of projected revenue under the alternate scenarios (fiscal 2025) used the percentage change from the fiscal year in which the economic peak before the recession occurred to the following fiscal year. In practice, the city’s revenue would likely be affected during the fiscal year in which a recession or other economic disruption occurred. However, without a model that estimates revenue by month, it was necessary to create a simple model to apply to each scenario. The table below shows key milestones associated with each earlier recession used for the projected years in the analysis.
Table A.1
Key Milestones for Recessions Used in the Analysis
| Economic peak | Economic peak (fiscal year) | Economic trough | Economic trough (fiscal year) | Projection years | |
|---|---|---|---|---|---|
| Dot-Com Recession | March 2001 | FY 2001 | November 2001 | FY 2002 | FY 2002-05 |
| Great Recession | December 2007 | FY 2008 | June 2009 | FY 2009 | FY 2009-12 |
Endnotes
- City of Philadelphia, FY 2021-25 Five-Year Financial and Strategic Plan, https://www.phila.gov/media/20200501080717/REVISED-FY21-25-Five-Year-Plan-Proposed.pdf.
- The Pew Charitable Trusts, “How Philadelphia Plans to Use Its American Rescue Plan Dollars, Compared With Other Cities” (2022), https://www.pewtrusts.org/en/research-and-analysis/issue-briefs/2022/02/how-philadelphia-plans-to-use-its-american-rescue-plan-dollars-compared-with-other-cities.
- City of Philadelphia, FY 2023-27 Five-Year Financial and Strategic Plan, https://phlcouncil.com/wp-content/uploads/2022/03/FY2023-2027-Five-Year-Financial-and-Strategic-Plan.pdf.
- In November 2023, the city released its Quarterly City Managers Report, which updated its projected fund balance for fiscal 2024 from $529 million to $682 million. See City of Philadelphia Budget Office, “Quarterly City Managers Report for the Period Ending Sept. 30, 2023” (2023), https://www.phila.gov/media/20231115154830/Quarterly-City-Managers-Report-September-30-2023.pdf.
- The Pew Charitable Trusts, “How Philadelphia and Other Cities Work to Achieve Fiscal Stability” (2020), https://www.pewtrusts.org/en/research-and-analysis/issue-briefs/2020/11/how-philadelphia-and-other-cities-work-to-achieve-fiscal-stability.
- City Council of Philadelphia Office of the President-Finance and Budget Team, “City Council Analysis: Examining the City’s Financial Projections, Trends, and Economic Indicators Using Five-Year Plans and Quarterly City Managers Reports” (2017), https://phlcouncil.com/wp-content/uploads/2017/04/City-Financial-Analysis-Examining-Projections-Trend-and-Economic-Indicators.pdf.
- E. Haider and J. Hachadorian, “How the Pandemic Has Affected Municipal Budgets in Philadelphia and Other Cities,” The Pew Charitable Trusts, March 30, 2021, https://www.pewtrusts.org/en/research-and-analysis/articles/2021/03/30/how-the-pandemic-has-affected-municipal-budgets-in-philadelphia-and-other-cities.
- Ibid.; City of Philadelphia, FY 2024-28 Five-Year Financial and Strategic Plan, https://www.phila.gov/media/20230627121854/FY24-28-Five-Year-Plan-per-Council-Approved-Budget.pdf.
- Pew analysis of Philadelphia budget documents.
- Government Finance Officers Association, “Fund Balance Guidelines for the General Fund” (2015), https://www.gfoa.org/materials/fund-balance-guidelines-for-the-general-fund.
- City of Philadelphia, FY 2023-27 Five-Year Financial and Strategic Plan. Note that the parking tax now goes toward a newly created transportation fund, so it will not have an impact on the general fund’s balance moving forward.
- S. Kavanagh, “Balancing the Budget in Bad Times, Part 1: Primary Treatments for Reducing Cost and Enhancing Revenues in the Next 12-18 Months” (Government Finance Officers Association, 2020), https://gfoaorg.cdn.prismic.io/gfoaorg/2d0596e6-3885-4a44-943d-bcb0c02b9d21_BalancingtheBudgetinBadTimes_Part1.pdf; S. Kavanagh and G. Mann, “Balancing the Budget in Bad Times, Part 2: Riskier Treatments for Reducing Cost and Enhancing Revenues in the Next 12-18 Months” (Government Finance Officers Association, 2020), https://gfoaorg.cdn.prismic.io/gfoaorg/dbef6595-190d-49e7-83c8-5c349cac40b1_BalancingtheBudgetinBadTimes_Part2.pdf.
- City of Philadelphia, Annual Comprehensive Financial Report, Fiscal Year Ended June 30, 2022, https://www.phila.gov/media/20230322104950/annual-comp-financial-report-FY-2022.pdf.
- T.J. Bartik and J.C. Austin, “Most Business Incentives Don’t Work. Here’s How to Fix Them,” The Brookings Institution, Nov. 4, 2019, https://www.brookings.edu/articles/most-business-incentives-dont-work-heres-how-to-fix-them/.
- City of Philadelphia Budget Office, “Quarterly City Managers Report, Ending Sept. 30, 2023.”
- Ibid.
- Pennsylvania Intergovernmental Cooperation Authority, “Annual Overtime Report, Fiscal Year 2019” (2019), https://www.picapa.org/wp-content/uploads/2019/10/Annual-Overtime-Report-FY2019-FINAL-.pdf.
- City of Philadelphia Budget Office, “Quarterly City Managers Report for the Period Ending June 30, 2023” (2023), https://www.phila.gov/media/20230815135251/Quarterly-City-Managers-Report-June-30-2023.pdf.
- City of Philadelphia Budget Office, “Quarterly City Managers Report, Ending Sept. 30, 2023.”
- Ibid.
- Pennsylvania Intergovernmental Cooperation Authority, “Review of the City of Philadelphia Police Court Overtime” (2019), https://acrobat.adobe.com/link/track?uri=urn:aaid:scds:US:34f19901-9915-4725-9db0-abe5b2121fd0.
- Another cautionary near-term strategy is to limit the number of government employees through hiring freezes, attrition, vacancy control, and layoffs. We chose not to include that strategy in this brief because of the city’s current staffing and hiring challenges, including high vacancy levels, with nearly 1 in 5 jobs vacant as of June 2023.
- W. Hu, “When Calling an Uber Can Pay Off for Cities and States,” The New York Times, Feb. 18, 2018, https://www.nytimes.com/2018/02/18/nyregion/uber-lyft-public-transit-congestion-tax.html.
- H. Savage, “How to Comply With Philly’s New Airbnb, Limited Lodging Laws,” The Philadelphia Inquirer, Jan. 27, 2023, https://www.inquirer.com/philly-tips/short-term-rental-airbnb-vrbo-regulations-philadelphia.html.
- J. Laughlin, “Uber Revenue Error Prompts Renewed Call for New Philly Tax on Ride-Share Trips,” The Philadelphia Inquirer, May 22, 2018, https://www.inquirer.com/philly/business/transportation/uber-lyft-taxi-philadelphia-50-cent-per-ride-tax-20180522.html.
- M.J. Krauss, “Philadelphia Collects 1.4 Percent on Ride-Sharing, Why Can’t Other Cities?” 90.5 WESA, Nov. 7, 2016, https://www.wesa.fm/national-international-news/2016-11-07/philadelphia-collects-1-4-percent-on-ride-sharing-why-cant-other-cities.
- Philadelphia Parking Authority, “Director’s Report to the Board—May 30, 2023” (2023), https://go.boarddocs.com/pa/philapark/Board.nsf/files/CTHQRE64CF94/$file/230530_Exhibits.pdf.
- City of Philadelphia, FY 2024-28 Five-Year Financial and Strategic Plan.
- City of Philadelphia, “City of Philadelphia Municipal Retirement System, Actuarial Valuation Report” (2023), https://www.phila.gov/media/20230511134924/Actuarial-valuation-report-2022.pdf.
- Ibid.


America’s Overdose Crisis
Sign up for our five-email course explaining the overdose crisis in America, the state of treatment access, and ways to improve care
Sign up


Employment Patterns and Philadelphia's Operating Budget


The Pandemic's Impact on Municipal Budgets in Philadelphia


City Budgeting Priorities Amid Economic Uncertainty

Philadelphia 2024
ADDITIONAL RESOURCES

Podcast

Article