States Pioneer Ways to Mitigate Swings in Personal Income Tax Revenue
Approaches include limiting the use of nonwage collections

This brief on nonwithholding tax revenue is one in a series about state budget strategies.
Overview
Most state governments rely heavily on revenue from state income taxes to fund their operations and services. Currently, 43 states and the District of Columbia (all but Alaska, Florida, Nevada, South Dakota, Texas, Washington, and Wyoming) levy taxes on personal income. Collections from this source can be highly volatile, however, fluctuating widely from year to year. Income taxes closely track the economic cycle, with employment and wages—key components of the income tax base—rising during growth periods and falling during recessions. This volatility can exacerbate financial pressure on state governments, because demand for state services often rises during downturns even as personal income tax revenue declines.
Income tax fluctuations can also create challenges for state officials tasked with forecasting revenue and making appropriations. While the nature of revenue forecasting means estimates will rarely be perfect, accurately predicting changes in revenue sources that swing more drastically is particularly difficult. Some states have responded by establishing policies to help limit the impact on budgets when tax collections miss the mark. Maryland and Virginia stand out with policies that aim to mitigate the uncertainty of nonwithholding income, the most volatile slice of their personal income tax collections.
Nonwage personal income is highly volatile
Most personal income taxes are imposed on wages and paid by employers at regular intervals through withholding, while income subject to tax that is not withheld must be paid directly by an individual in the form of estimated and final payments. This includes income from interest, dividends, partnerships, self-employment taxes, and—critically—capital gains. Capital gains income comprises earnings from the sale of stocks or other capital assets, such as real estate.
Nonwithholding collections make up a smaller, though still significant, share of personal income tax revenue than income from payroll withholding (income from wages). In 2016, nonwithheld individual income tax payments amounted to 28.6 percent of all personal income taxes paid to the Internal Revenue Service.1 In Maryland, they accounted for 22 percent of personal income revenue on average between 1987 and 2016.2
Nonwithholding collections are substantially more volatile than withholding collections on a year-over-year basis, as shown in Figure 1. Revenue from capital gains is especially hard to estimate, as it closely tracks the stock market and can swing wildly based on investment returns and investor behavior.
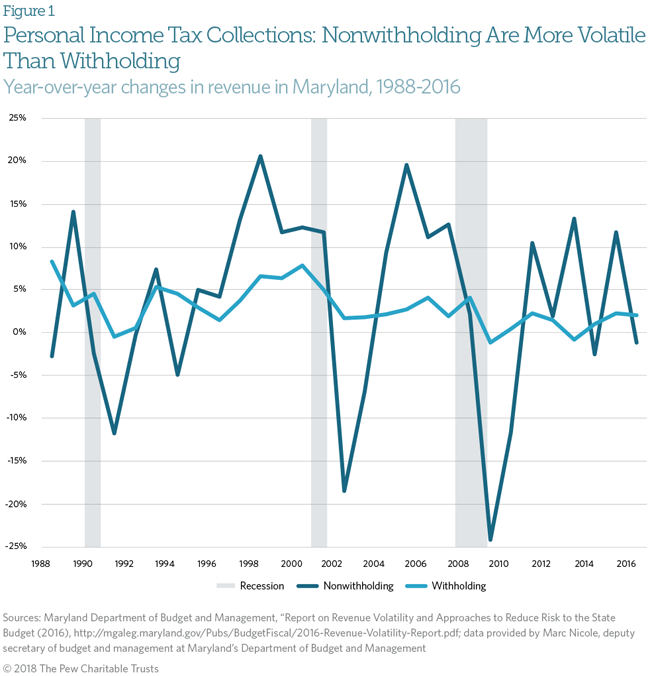
In addition to volatility, the erratic returns from capital gains and other nonwithholding income make forecasting revenue from these streams a difficult process for state governments. Nonwithholding taxes are mostly paid during the second half of the fiscal year (which corresponds with the first half of the calendar year), because three out of four IRS estimated payments deadlines occur between January and June. The deadline for filing individual income tax returns—when final payments on nonwithheld income are due—also occurs during this period. In Virginia, for example, nearly 75 percent of nonwithholding receipts are collected in this period.3 As a result, forecasters have little information about what level of nonwithholding revenue they can expect until late in the fiscal cycle, well after appropriations have been made and adjusted.
States aiming to estimate revenue from the capital gains portion of nonwithholding taxes have an additional forecasting challenge. Most states apply the same rates for capital gains income and regular income, which means taxpayers are not required to report capital gains income separately when they file their returns. As a result, it is difficult to identify which income tax revenue comes from capital gains. States generally rely on data from the Internal Revenue Service that breaks down capital gains claims. This data is typically not available to states until up to 18 months after the returns are filed.4
How Maryland, Virginia cope with capital gains uncertainty
In recent years, several states have put in place policies to limit their budgetary exposure to swings in nonwithholding or capital gains income. Massachusetts and California focus on moderating capital gains fluctuations. Massachusetts, unlike most states, has a distinct tax rate for at least some types of capital gains collections.5 Under a 2010 law, revenue from this source that comes in above a GDP-adjusted threshold is deposited into the state’s rainy day fund. Similarly, California voters in 2014 approved a constitutional amendment requiring that capital gains revenue exceeding 8 percent of total general fund revenue go to the state’s rainy day fund or be used to pay down outstanding debt. Initial transfers of excess capital gains are based on estimates and are adjusted over three years once data on actual receipts becomes available.6
Maryland and Virginia stand out for restricting nonwithholding revenue more broadly. In both states, movement toward these restrictions emerged after huge swings in capital gains revenue in 2013-14. Virginia and Maryland taxpayers, like capital gains taxpayers elsewhere, chose to sell stocks and other assets in 2012 before new rates went into effect in January 2013. This created a temporary spike in this revenue source in fiscal year 2013 and then a substantial drop the next fiscal year. In Virginia, for example, this led to a $483 million shortfall in fiscal 2014.7
As officials in Maryland and Virginia examined the sources of this volatility, nonwithholding receipts stood out.8 David Romans, fiscal policy coordinator for the Maryland Department of Legislative Services, explained that the state found that “the biggest culprit in missing the revenue estimates was nonwithholding income tax revenues, and really driven by capital gains revenues.”9 Because both states tax capital gains at the same rates as other income, isolating and restricting capital gains tax revenue alone would be difficult.
As a result of these analyses, Virginia leaders in 2016 decided to place restrictions on all nonwithholding income, rather than focusing on capital gains. They chose to put in place a budgetary “collar,” structured as an agreement between the Legislature and the office of Governor Terry McAuliffe (D). This rule restricts the estimated amount of nonwithholding income tax revenue the Legislature can appropriate when creating a new fiscal year budget. If nonwithholding collections are projected to exceed their 10-year average share but are less than 1 percent of total general fund revenue, they cannot be appropriated. Estimated revenue from this source that exceeds 1 percent is not subject to these restrictions.
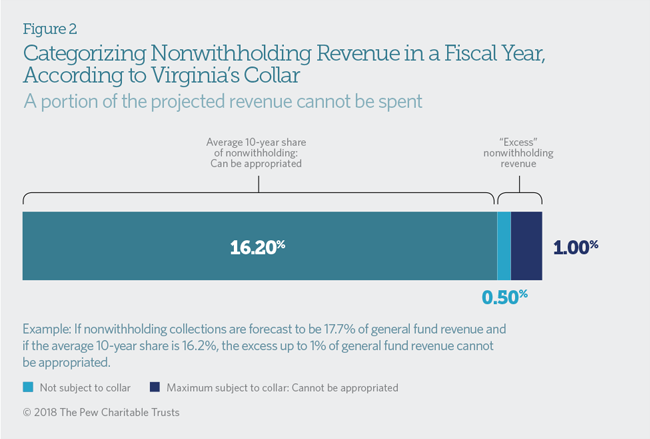
In years of unusually high nonwithholding income, this agreement limits the amount that can be built into the budget and reduces potential shortfalls if revenue comes in under estimates. It also helps create an end-of-year surplus if revenue comes in above the collar, at which point the Legislature can decide how best to use the additional resources.
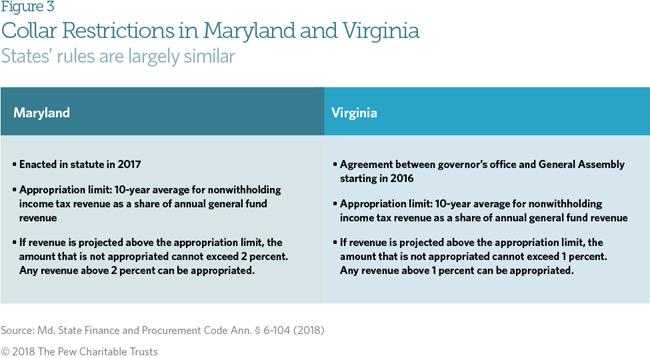
Maryland officials examined the approaches used in California and Massachusetts but ultimately adopted a rule similar to Virginia’s. Maryland and Virginia share important similarities, such as the lack of a separate capital gains tax rate or reporting structure. Unlike in Virginia, Maryland policymakers put the collar restriction into law, which was seen as making it more transparent and harder to circumvent.10 House Bill 503 was signed into law in July 2017, creating a restriction on appropriations from nonwithholding income tax revenue. The governor’s office and legislative leadership supported the measure, allowing it to pass the House and Senate unanimously.11
Starting in fiscal year 2020, appropriators will be limited to the 10-year average share of nonwithholding income tax revenue, as in Virginia. Unlike Virginia’s 1 percent cap on the collar, Maryland opted for a 2 percent cap: The amount of projected revenue from this source that is set aside and not budgeted cannot exceed 2 percent of overall projected general fund revenue for that year. As is true of Virginia’s 1 percent cap, this means that estimated nonwithholding revenue that is more than 2 percent above the 10-year average can be appropriated.
In both states, limiting the amount of estimated nonwithholding receipts that can be budgeted encourages greater year-to-year fiscal stability. “We think by having a little more realistic ongoing revenue estimates, we’ll avoid building budgets and making future commitments that really are assuming an unusually high level of what can sometimes be one-time revenues,” said Romans.12
Maryland also opted to tie excess nonwithholding revenue to building reserves as well as paying down one-time expenses. Under H.B. 503, collections from this source that come in above estimates will be deposited in the state’s rainy day fund, the Revenue Stabilization Account (RSA), unless its balance exceeds 6 percent of the state general fund. In that case, half of the surplus nonwithholding revenue goes to a new capital fund, the Fiscal Responsibility Fund; if the RSA balance exceeds 10 percent, then all of the surplus collections go to the Fiscal Responsibility Fund.
This type of rule in effect directs nonwithholding revenue toward savings or one-time uses if it exceeds an average growth trend. It therefore helps put aside money when revenue is growing at an unsustainable level. This strategy gives states an additional way to help maintain fiscal stability in the face of volatile tax receipts.
Policymakers in other states are also trying to find ways to limit the impact of volatile tax streams on their budgets. Maryland and Virginia’s rules and restrictions on nonwithholding collections can be an effective part of this policy mix, especially in states that rely on personal income taxes or lack a separate capital gains tax rate.
Endnotes
- Individual income tax payments accounted for 15.6 percent of total gross tax collections in 2016. Overall personal income tax gross collections were 54.6 percent of total collections. Internal Revenue Service, “2016 Data Book,” https://www.irs.gov/pub/irs-soi/16databk. pdf, 3.
- Department of Budget and Management, Comptroller of Maryland, and Department of Legislative Services, “Report on Revenue Volatility and Approaches to Reduce Risk to the State Budget” (2016), http://mgaleg.maryland.gov/pubs/budgetfiscal/2016-revenue-volatility- report.pdf, 1.
- John R. Layman, “Individual Nonwithholding Overview: A Briefing for the Senate Finance Committee,” Virginia Department of Taxation (2015), 8, http://sfc.virginia.gov/pdf/committee_meeting_presentations/2015 Interim/062315_No1b_Layman.pdf.
- Ibid., 15.
- Bankrate, “State Taxes: Massachusetts,” accessed February 21, 2018, https://www.bankrate.com/finance/taxes/state-taxes- massachusetts.aspx.
- Maryland Department of Budget and Management, Comptroller of Maryland, and Department of Legislative Services, “Report on Revenue Volatility,” 8.
- Ric Brown (former Virginia secretary of finance), interview with The Pew Charitable Trusts, October 2017.
- Brown, interview; David Romans (fiscal policy coordinator, Maryland Department of Legislative Services), interview with The Pew Charitable Trusts, November 2017.
- Romans, interview.
- Marc Nicole (Maryland deputy secretary of budget and management), interview with The Pew Charitable Trusts, October 2017.
- Romans, interview.
- Ibid.
ADDITIONAL RESOURCES


