Are American Families Becoming More Financially Resilient?
Changing household balance sheets and the effects of financial shocks

Overview
Financial shocks—lost income or expenses that families do not plan for, such as from job loss, illness, injury, death, or a major home or vehicle repair—represent one of the core challenges American families face as they strive to achieve and maintain financial security.1 In 2014, almost 60 percent of U.S. households experienced at least one such shock and over half of them struggled to make ends meet after the most expensive event.
This analysis is a continuation of research by The Pew Charitable Trusts on the links between financial shocks and the state of family balance sheets. Data from two years—2014 and 2015—from Pew’s nationally representative Survey of American Family Finances reveal the state of U.S. households’ finances and the role that savings can play in managing unexpected economic obstacles. Adding the second year of survey data provided a unique opportunity to examine the same households across an extended period to investigate whether the incidence and severity of shocks changed over time. It also enabled the identification of associations between families’ financial situations in 2014 and their likelihood of experiencing and ability to withstand the repercussions of economic shocks in 2015.
The study finds that financial shocks continue to be a frequent and burdensome challenge for households of all types and that although savings are not a panacea, they can reduce the risk of financial instability:
- Households that suffered financial shocks in 2015 tended to have difficulty making ends meet, but overall they reported less trouble meeting regular obligations than in 2014. Improvement was especially evident among Hispanic, black, and millennial households.
- Experiencing a financial shock in 2014 was associated with an increased likelihood of another one in 2015. Seven in 10 families that had a shock in 2014 also had one in 2015. By comparison, fewer than 4 in 10 of those that did not have such a setback in 2014 had one the next year.
- Other household characteristics from 2014 also were associated with financial shocks in 2015, particularly owning a car. In addition, 2014 families’ debt levels were closely correlated with the extent of their risk of shock the following year.
- Respondents who rated their household financial situations as fair or poor in 2014 were more likely to experience a shock a year later. This suggests that they may have been aware of factors not captured by the survey that made them more susceptible to shocks.
- Having savings in 2014 reduced families’ risk in 2015 of being financially destabilized—that is, struggling to make ends meet after their most expensive shocks—but even many with ample resources faced financial hardships. Regardless of income, half of the survey respondents who had adequate resources to cover the cost of a typical family’s most expensive shock ($2,000) still experienced financial difficulty after a shock. Even among households that had $4,000 available, 43 percent struggled after their most expensive shock.
These findings have implications for public policy: Decision-makers will need to take financial instability and the relationship between shocks and savings into account when designing policies and programs.
About the data
The analysis presented here uses new data from Pew’s Survey of American Family Finances, first conducted in 2014 with a follow-up conducted with the same respondents a year later. This is the second in a series of papers to draw on both editions of survey data.
Key terms
- Financial shock refers to any expense or loss of income that households do not budget for, regardless of the extent to which the shock may harm families financially. (See “What Is a Financial Shock?” below.)
- Destabilization refers to reduced financial well-being as the result of a shock.
- Liquid savings includes what participants reported having in savings or checking accounts, cash saved at home, and the value of unused prepaid cards—all assets households can access quickly and at very low cost.
Generations are defined as follows:
- Silent generation: Born between 1928 and 1945.
- Baby boomers: Born between 1946 and 1964.
- Generation Xers: Born between 1965 and 1980.
- Millennials: Born between 1981 and 1997.2
What Is a Financial Shock?
Most households have a set of relatively fixed expenses they expect to pay each month. Although regular expenditures can and do fluctuate, people tend to have at least a rough budget for housing, food, transportation, and other needs and wants. Certain other expenses and losses—what Pew defines as financial shocks—are irregular, such as car repairs or reduced income resulting from fluctuating work hours, a pay cut, or other factors. They arise infrequently, and the likelihood of their occurrence at any particular time is low. Although this brief does not capture the causal impact of shocks on household finances broadly, some respondents reported that shocks reduced their financial well-being, while others said their shock did not harm balance sheets much at all, indicating that the experience of financial shocks differs dramatically across households.
To better understand the types of financial shocks that American households encounter most, Pew asked survey respondents whether, in the past 12 months:
- “A person in the household brought in less income than expected due to unemployment, a pay cut, or reduced hours.”
- “Someone in the household suffered an illness or injury requiring a trip to the hospital.”
- “Someone in the household divorced, separated, or was widowed from a spouse or partner.”
- “A car, truck, or SUV needed a major repair or replacement.”
- “The place you live or appliances needed major repair or replacement.”
- “… Your household had some other large, unexpected expense in the past year.” Respondents who selected this option were asked to specify the nature of this expense.
Participants were then asked detailed questions about the most expensive shock they reported.
Overall, households reported less difficulty meeting regular obligations in 2015 than in 2014
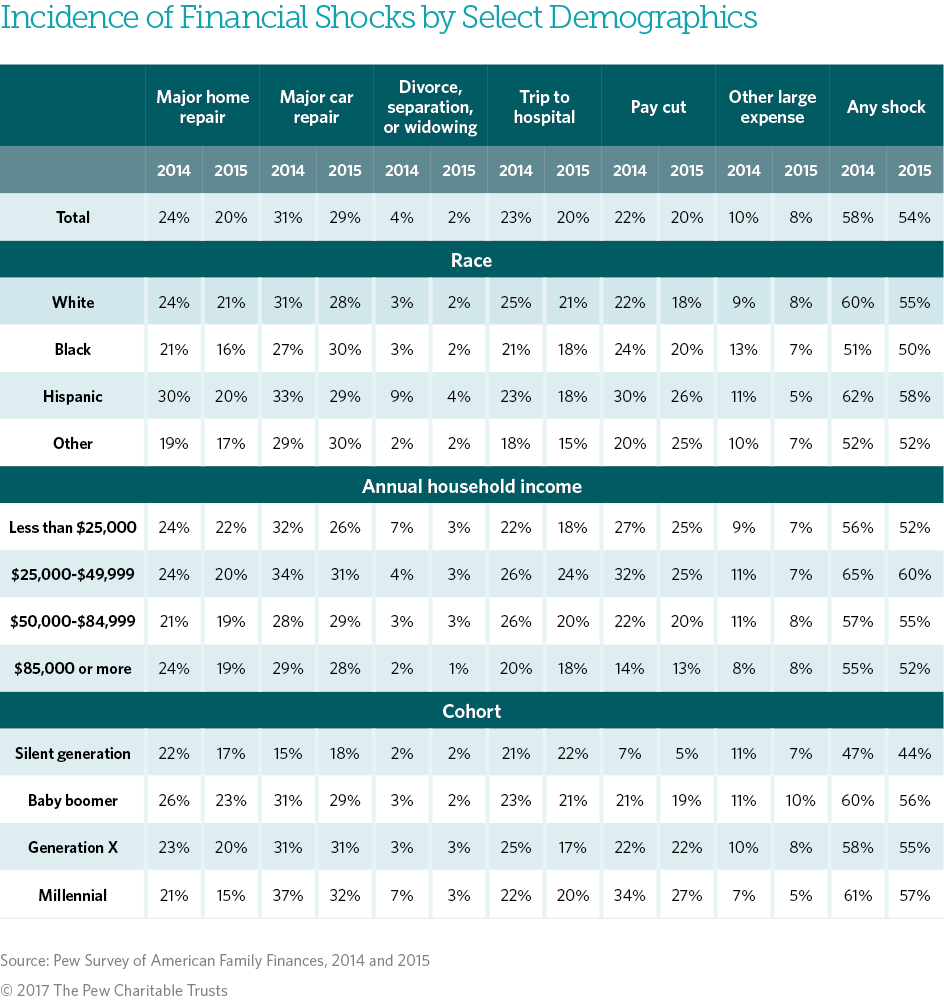
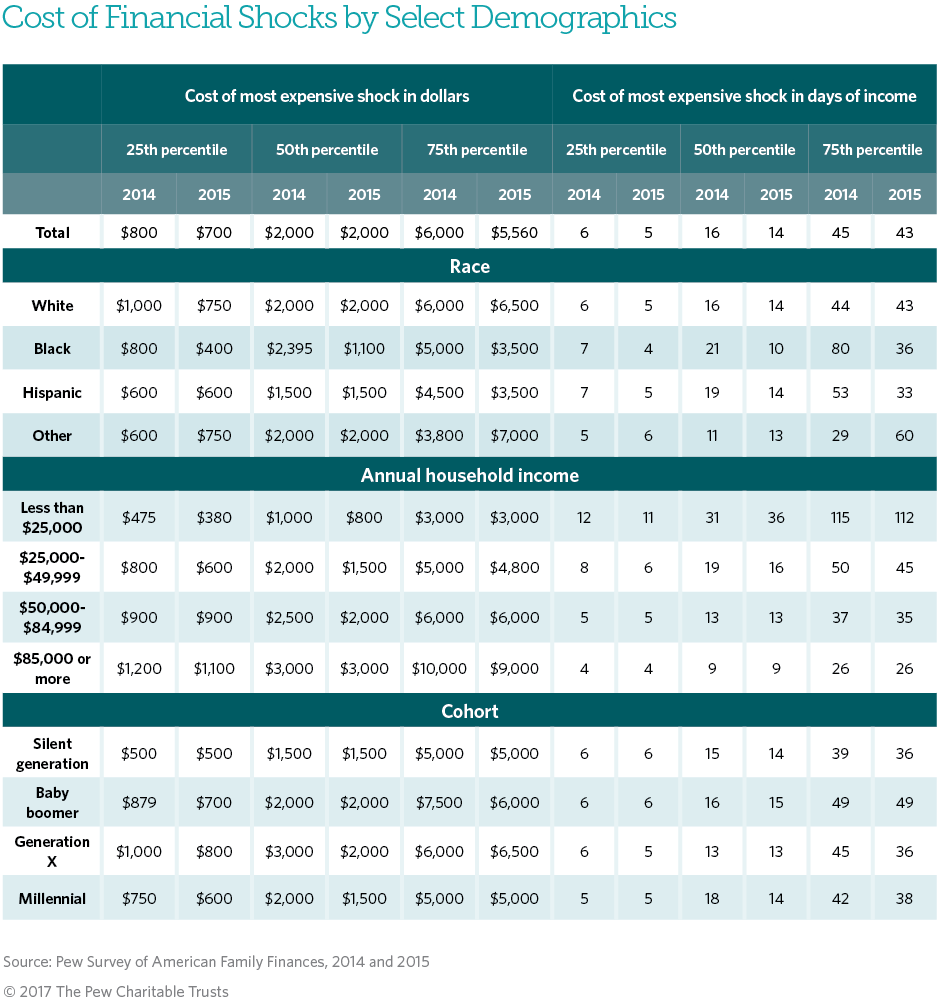
Just as in 2014, more than half of households experienced a financial shock in 2015, with the most common being repairing or replacing a vehicle (a third of respondents), followed by a major home repair, an illness or injury requiring a trip to the hospital, and a loss of income (1 in 5 respondents each).
In both years, the typical family spent almost half-a-month’s income to cover its most expensive shock, with a median cost of $2,000. In 2015, half of respondents said their most expensive shocks made it hard to cover regular expenses. Only 46 percent of respondents who suffered shocks in 2015 said they felt financially secure, compared with nearly 66 percent of those who did not have such setbacks.
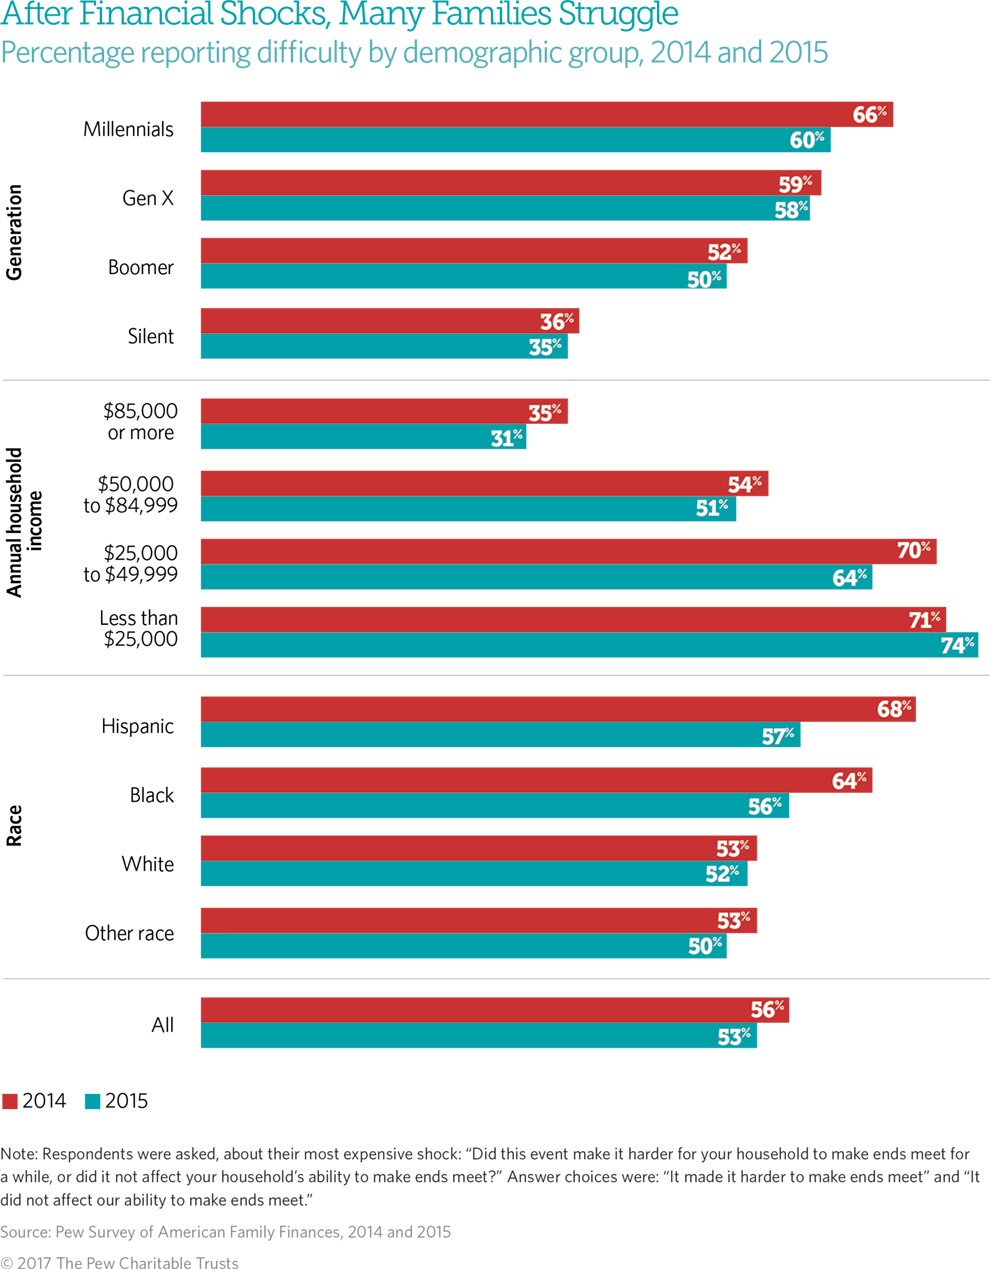
Coping with unexpected expenses is still a struggle for many, but in 2015 fewer families reported difficulty meeting regular obligations after their most expensive shock than in 2014. This change was especially evident among Hispanic (68 percent in 2014 vs. 57 percent in 2015), black (64 vs. 56 percent), and millennial (66 vs. 60 percent) households. These groups did not experience any noteworthy gains in employment rates, hours worked, or income between 2014 and 2015, which would seem to suggest that other factors explain their improved ability to handle financial shocks.3
Despite this progress, however, Hispanics, blacks, and millennials are still more likely to struggle after their most expensive shock than other demographic groups. In addition, respondents with annual incomes of less than $25,000 were the only ones to have an increase in destabilization as a result of their most expensive shocks in 2015 compared with 2014, indicating that minority, young, and low-income households are especially vulnerable to the consequences of unplanned expenses or income losses.
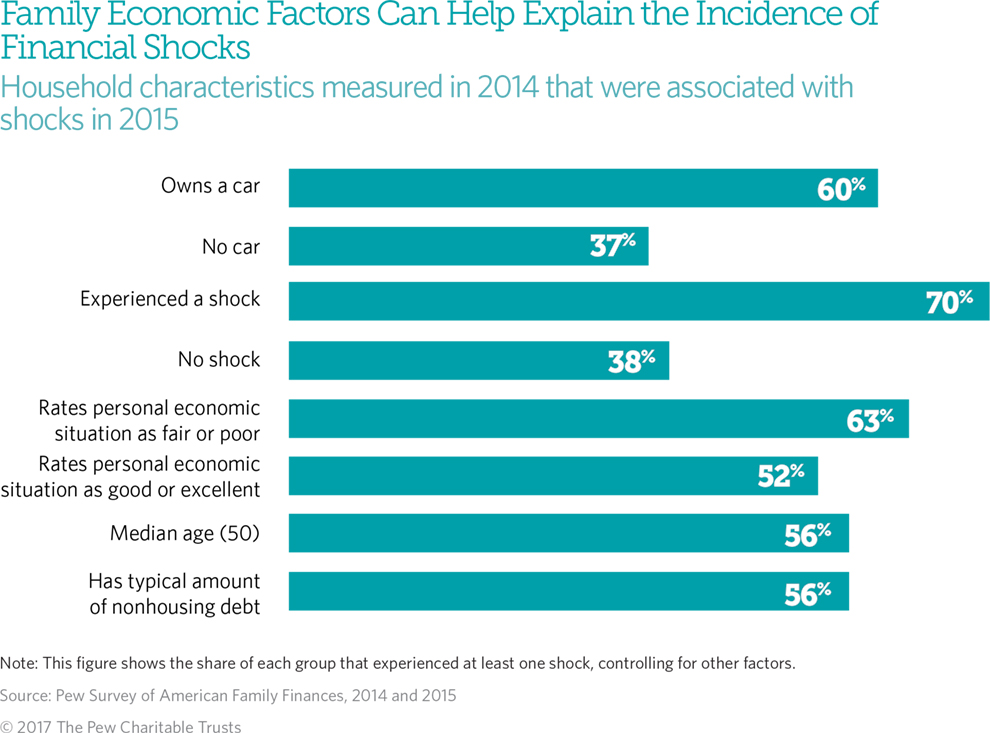
Certain 2014 household financial characteristics increased the likelihood of having a 2015 shock
Pew used demographic and economic household characteristics captured in the 2014 survey to identify factors associated with occurrence of financial shocks in 2015.4 Demographics such as race, education level, household composition, the presence of children, homeownership, or income measured in 2014 did not influence families’ chances of experiencing a shock in 2015. However, certain 2014 financial factors—particularly having a car or a shock—were associated with increased risk of an unexpected expense or income loss in 2015. And the amount of debt a family held in 2014 was closely correlated to its level of risk for a 2015 shock.
Further, respondents who rated their financial situations as fair or poor in 2014 were more likely to experience a shock the following year (63 percent) than those who rated their situations as good or excellent (52 percent).5 This indicates that respondents may be aware of some other reasons that the survey did not capture that make them more susceptible to shocks. After controlling for other factors, such as age, race, and income,6 the survey found that 7 in 10 families that suffered a financial shock in 2014 had one in 2015, compared with fewer than 4 in 10 of those that did not experience a 2014 shock but had one in 2015.
One way that families, regardless of income, can be more resilient is having a financial cushion to fall back on in case of a shock. However, the finding that households experience repeated shocks highlights a fundamental challenge that such crises pose for both families and policymakers: Not only do families have to build emergency savings, they also need to know when to spend those savings and how to repeatedly rebuild them. Research has shown that having a habit of saving is the strongest determinant of whether someone is financially healthy, regardless of income.7 In fact, low-income families that have some savings have more financial resiliency than middle-income households with no savings.8
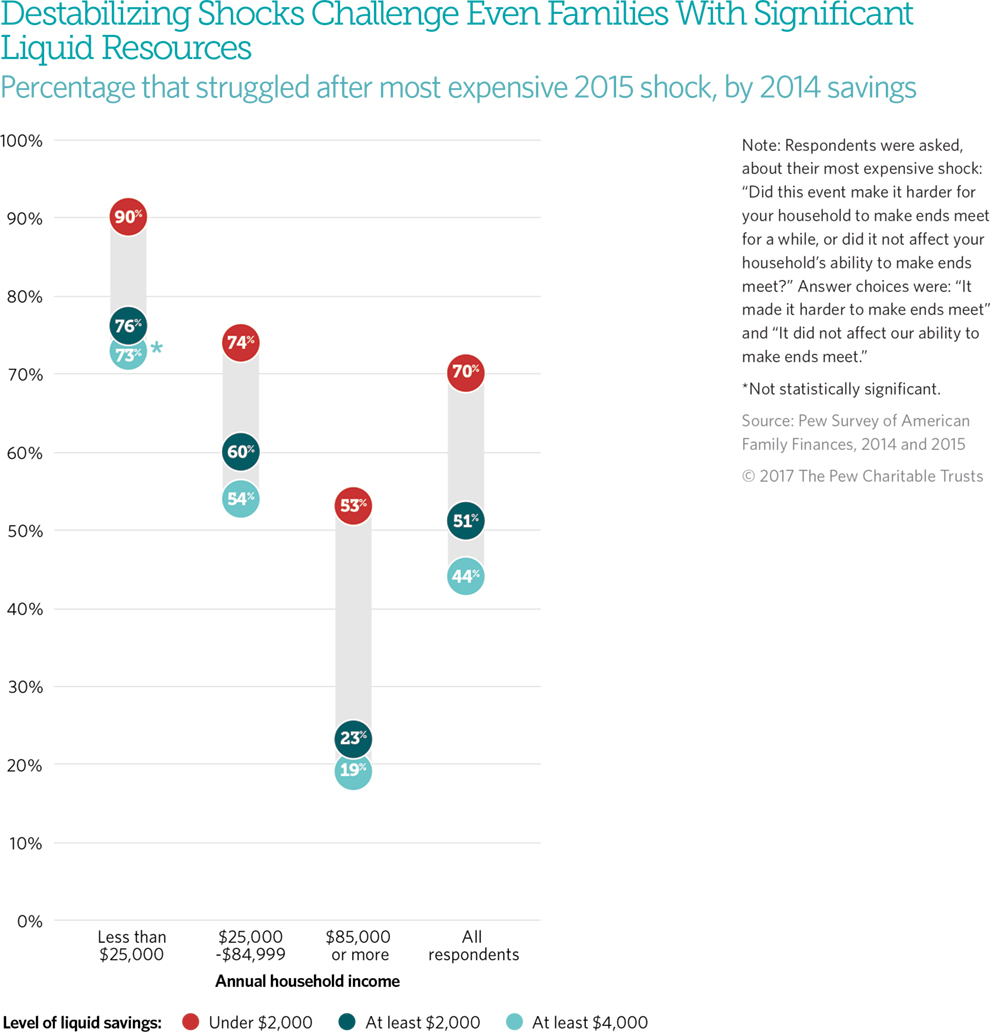
Having savings in 2014 reduced but did not eliminate families’ 2015 risk of destabilization
In both years, about 60 percent of households had sufficient liquid savings to cover a $2,000 expense—the cost of the typical household’s most expensive shock—and about half of households had at least $4,000.
Not surprisingly, families with higher levels of savings in 2014 were more resilient to financial shocks in 2015 than other households. What is surprising, however, is that about half of respondents who had at least $2,000 in liquid savings in 2014—enough to cover a typical most expensive shock—still reported struggling to make ends meet after their most expensive 2015 shocks.9 This is true across all income levels: The most expensive shock was destabilizing for 76 percent of low-income households, 60 percent of middle-income families, and 23 percent of high-income ones. Notably, households that had income below $25,000 but at least $2,000 in liquid assets in 2014 were as financially resilient as those with middle income that had less than $2,000 in liquid savings.
Even among households with twice that—$4,000—in liquid savings, destabilization was common across income groups. Overall, 44 percent of families reported having difficulty covering regular expenses after their most expensive shocks, with the figure jumping to 54 percent for middle-income households with this level of savings. And 19 percent of families making $85,000 or more a year and having at least $4,000 in savings reported financial instability after the most expensive shock. Although savings can have a protective effect, American families face significant vulnerability to unbudgeted expenses or income losses, regardless of their income and demographic characteristics.
Despite these findings, the savings households accumulate are important to their financial security. In 2014, about 9 percent of families reported having no liquid savings. Among this group, 79 percent of those that experienced a shock in 2015 were destabilized by it. Across the whole sample, 53 percent of families with at least $1,000 in available resources struggled after their most expensive shock, but this figure declined with each additional $1,000 families had available: 50 percent of those with at least $2,000, 47 percent of those with at least $3,000, and 44 percent of those with at least $4,000.
What Resources Do Families Use to Cope With Financial Shocks?
A household’s success in weathering a shock is a function both of the resources on hand and the cost of the shock. In 2014, 78 percent of respondents said they would use money from their checking and savings accounts to cover an unexpected expense.* Consistent with those predictions, checking and savings accounts were the most common source of funds that families used to respond to a shock in 2015 (65 percent of respondents) and the only one used by half (48 percent) of respondents. About 35 percent said they used a credit card, and of those, roughly 57 percent reported still owing at least part of that balance at the time of the survey; about 24 percent of users paid off the balance in a month or less.† Smaller groups of respondents borrowed from friends or family, sold goods or investments, received funds as a gift, or used retirement funds or alternative financial services. About a third reported using two or more sources to pay for their most expensive shock.
For 46 percent of households, the most expensive shock in 2015 cost more than they had reported having in liquid savings the year before. Higher savings make households more resilient, but the high cost of the shocks nevertheless leaves many families vulnerable to destabilization.
* The Pew Charitable Trusts, “What Resources Do Families Have for Financial Emergencies?” (November 2015), http://www.pewtrusts.org/en/research-and-analysis/issue-briefs/2015/11/emergency-savings-what-resources-do-families-have-for-financial-emergencies.
† Among respondents who used a credit card to pay for their most expensive shock and still owed at least part of that balance at the time of the survey, 12 percent experienced their shocks a year before the survey, 11 percent had their shocks six months before, and 14 percent said their shocks had occurred within a month or less.
Although savings matter for American families, more than 2 in 5 households still report financial insecurity after experiencing their most expensive shock, even if they have a savings cushion.
Policy implications
These and previous Pew findings have clear policy implications. Policymakers and providers of financial services and products can help families better weather financial shocks by creating programs that promote near-term financial stability and longer-term savings. Such short-term, security-focused initiatives encourage families to build savings, spend them judiciously, then rebuild the cushion repeatedly. Thoughtfully designed automatic mechanisms, tools, and policies can help families generate savings and manage immediate consumption needs while building and maintaining reserves. Further, support for products that help families better predict and understand the nature of their balance sheets can encourage them to save more when they can afford to do so. Incentives could also be structured to reward savings in any type of account, and programs should be evaluated based on their impact on all household savings and on financial well-being holistically.10
Conclusion
Although financial shocks occurred at slightly lower rates in 2015 than in 2014 and the related economic strain was lessened a bit, data from the 2015 iteration of the Survey of American Family Finances indicate that most American families still experience some type of shock in the course of a year and that these events frequently destabilize household finances at all levels of the income ladder. Further, the findings show that just one shock can disrupt family financial well-being even among households with high incomes and substantial financial resources on which to draw, in part because those resources may be earmarked for other purposes, such as prearranged purchases, savings, or living expenses. Spending those funds instead on an unanticipated obligation leaves many families exposed to financial instability.
Financial institutions and governments can help households better weather these destabilizing events by developing programs and market options that encourage families to achieve financial security and become better prepared for the unexpected.
Appendix: Data and methods
This analysis draws from the Survey of American Family Finances, commissioned by Pew. The first iteration of the survey was administered to a nationally representative panel between Nov. 6 and Dec. 3, 2014. The second iteration was administered to the same panel between Oct. 27 and Dec. 1, 2015. Including only respondents who answered both years and oversamples of black and Hispanic respondents, the total sample size was 5,661. Survey firm GfK collected the data on behalf of Pew and administered the computer-based questionnaire in English and Spanish. All reported data were weighted. For clarity of analysis, respondents who chose not to answer a question were excluded from the statistics generated for that item. As is frequently the case for computer-based surveys, missing data were most common when respondents failed to answer something they felt did not apply to them, such as “other” in a list of questions. Overall, item nonresponse for the 2014 survey was 2.2 percent and 1.5 percent for the one in 2015. Additional details about the survey and its methodology are available at www.pewtrusts.org/Survey-of-American-Family-Finances-Methodology.
The statistics presented in this issue brief include frequencies, cross tabulations, and medians. Logistic regressions were conducted to analyze the association between household characteristics and incidence of shocks and between household characteristics and resistance to shocks. The dependent variables used in the models were measured as of 2015 and included a binary variable for the occurrence of any financial shock in the previous 12 months and one for the ability to make ends meet after the most expensive shock. The independent variables measured in 2014 included age squared, race, education, household composition, presence of children, homeownership, car ownership, occurrence of any shock in the previous 12 months, rating of own financial situation, spending habits (whether respondents spend more, the same as, or less than they make), level of available resources, income (logged), nonhousing liabilities (trimmed at 95th percentile and logged), and day of the month when the survey was taken (in 2014 and in 2015). The models were conducted for the total of the respondents and by three income categories: under $25,000, $25,000 to $84,999, and $85,000 or more.
External reviewers
This brief benefited from the insights and expertise of Rachel Schneider, senior vice president of the Center for Financial Services Innovation, and Drew M. Anderson, postdoctoral researcher at the Center for Financial Security at the University of Wisconsin, Madison, who commented on earlier drafts. Neither they nor their organizations necessarily endorse its conclusions.
Acknowledgments
The project team, Joanna Biernacka-Lievestro, Clinton Key, and Erin Currier, would like to thank Pew staff members Joy Hackenbracht, David Merchant, and Mark Wolff for providing valuable feedback on this report. We also thank Dan Benderly, Kristin Centrella, Jennifer V. Doctors, Carol Hutchinson, Molly Mathews, Bernard Ohanian, Sandra Nwogu, and Liz Visser for their thoughtful suggestions and production assistance. Many thanks also to other current and former colleagues who made this work possible. This research is funded in part by Pew, with additional support from the W.K. Kellogg Foundation.
Endnotes
- The Pew Charitable Trusts, “How Do Families Cope With Financial Shocks?” (October 2015), http://www.pewtrusts.org/en/research-and-analysis/issue-briefs/2015/10/the-role-of-emergency-savings-in-family-financial-security-how-do-families.
- Age cohorts are defined using thresholds from the Pew Research Center. At the time of the 2014 survey, millennials were ages 18 to 33, Gen Xers were 34 to 49, baby boomers were 50 to 68, and members of the silent generation were 69 to 86.
- These conclusions are based on the answers of Hispanic, black, and millennial respondents to the 2014 and 2015 iterations of the Survey of American Family Finances.
- For additional information about the model used to draw these conclusions, see the methodology.
- Respondents to the Survey of American Family Finances were asked: “How would you rate your household’s financial situation today?” Answer choices were: “excellent,” “good,” “only fair,” or “poor.”
- For details, see the methodology.
- Aliza Gutman et al., “Understanding and Improving Consumer Financial Health in America,” Center for Financial Services Innovation (March 2015), https://www.metlife.com/assets/cao/foundation/understanding-and-improving-consumer-financial-health-in-america.pdf.
- Signe-Mary McKernan et al., “Thriving Residents, Thriving Cities,” Urban Institute (April 2016), http://www.urban.org/sites/default/files/alfresco/publication-pdfs/2000747-Thriving-Residents-Thriving-Cities-Family-Financial-Security-Matters-for-Cities.pdf.
- By comparison, 65 percent of those who had less than $2,000 in savings in 2014 struggled to make ends meet after having a shock in 2015.
- For more information on possible solutions, see The Pew Charitable Trusts, “Barriers to Saving and Policy Opportunities” (January 2016), http://www.pewtrusts.org/~/media/assets/2016/01/emergency-savings-report-3_011116_update.pdf.

The Precarious State of Family Balance Sheets

The Role of Emergency Savings in Family Financial Security

Income Volatility and Financial Security
An examination of gains, losses, and household economic experiences
ADDITIONAL RESOURCES


