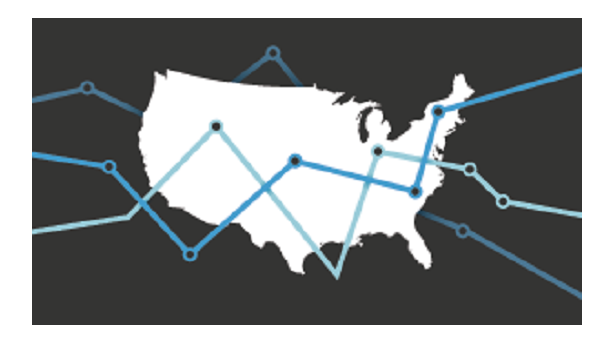
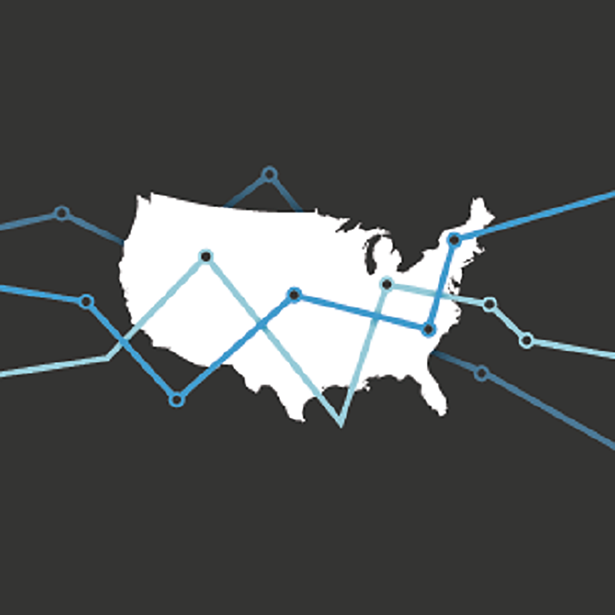
States’ 2020 Personal Income Growth Was Highest in 20 Years

Note: This data has been updated. To see the most recent data and analysis, visit Fiscal 50.
Every state experienced an uptick in total personal income last year as historic gains in unemployment benefits, federal aid, and other public assistance drove the sharpest annual growth in two decades. Without government support, most states would have sustained declines in personal income—a key economic indicator—as the COVID-19 pandemic took a toll on business activity.
Government assistance swelled in 2020 compared with a year earlier as policymakers pumped money into the economy to help Americans weather the pandemic, which upended normal economic patterns and left millions unemployed for much of the year. The sharp increase in government transfer payments more than offset a slight decline in inflation-adjusted earnings, which include wages from work plus extra compensation such as employer-sponsored health benefits, as well as business profits. Nationally, the sum of residents’ personal income from all sources rose 4.9% in 2020, the largest annual increase since 2000, after adjusting for inflation.
Arizona and Montana recorded the top personal income growth for the year, 7.1%. Both states benefited not only from a surge in government transfers but also from an increase in their workers’ aggregate earnings, unlike most other states. By comparison, Wyoming and several other states with economies more reliant on the energy sector experienced some of the weakest personal income growth as oil production dropped. These statewide sums are aggregates and should not be used to describe trends for individuals and households.
After the initial outbreak, additional unemployment benefits and federal economic impact payments of up to $1,200 per adult boosted many Americans’ incomes. Government assistance subsided following the disbursement of payments and the decline in supplemental unemployment benefits in the second half of the year, but it remained abnormally high. By the end of 2020, combined state and federal government assistance had climbed 35%, representing the largest annual increase since the 1940s. Every state experienced growth of at least 22%, which also reflected payments from Medicare, Medicaid, Social Security, and other programs.
States would have fared much worse if not for the unprecedented government support. In fact, when government assistance is excluded, 41 states experienced losses in total personal income last year.
That’s because wages and other earnings, which make up the bulk of personal income, plummeted as businesses across the country shut down or scaled back operations in the first few months of the pandemic. As unemployment started to recover from record highs, earnings began to stabilize, returning to pre-pandemic levels nationally in the fourth quarter. Still, combined earnings for all states fell 0.9% in 2020 after adjusting for inflation, the largest decline since the depths of the Great Recession in 2009.
Losses weren’t confined to select regions as earnings fell in 33 states. The severity of the declines largely reflected the makeup of states’ industries. Accommodation and food services along with arts and entertainment sustained the sharpest annual decreases in earnings as consumers hunkered down at home, driving significant losses in states such as Hawaii and Nevada. Sectors such as farming, forestry, information, finance and insurance, and real estate were much less affected by the pandemic, helping to prop up states relying more on those industries.
State personal income—a measure used to assess economic trends—matters to state governments because tax revenue and spending demands may rise or fall along with residents’ incomes. It sums up all the money and benefits that residents receive from work, certain investments, and income from owning a business and property, as well as benefits provided by employers or the government, including the extra federal aid in response to the COVID-19 pandemic.
A number of issues influence state personal income, many of which are beyond policymakers’ immediate control. Some of the more critical factors include national and global economic conditions, business cycles for a state’s major industries, demographic trends, and investments made over several decades.
State highlights in 2020
Last year, the economy endured the devastating effects of the COVID-19 pandemic and ensuing recession, which led to widespread business closures and layoffs early in the year. A spike in government assistance propelled personal income gains across the states but tapered off later in the year. A comparison of inflation-adjusted personal income between calendar years 2020 and 2019 (subject to data revisions) shows:
- Arizona and Montana led all states with total personal income growth rates of 7.1%, followed by Utah (6.9%), Idaho (6.8%), Rhode Island (6.4%), and Maine (6.3%).
- Only Alaska (1.9%), Connecticut (1.7%), and Wyoming (1.1%) registered personal income growth rates below 3%.
- Combined state and federal government assistance skyrocketed in every state, led by a 62.2% annual increase in Hawaii. Gains also exceeded 50% in Massachusetts, Nevada, and New Jersey.
- If government assistance is excluded, total U.S. personal income would have dipped 1.2% for the year. Absent government transfers, Hawaii (-6.2%), Nevada (-3.5%), and Wyoming (-3.4%) recorded the steepest losses for all other income, while nine states had gains: Utah (2.3%), South Dakota (1.9%), Idaho (1.8%), Arizona and Montana (both 1.2%), Nebraska (0.9%), Florida and Washington (both 0.6%), and Georgia (0.4%).
- Earnings, which mostly reflects wages and other employee compensation, fell in 33 states. Hawaii, (-7.7%), Wyoming (-4.0%), Nevada (-3.8%), and West Virginia (-3.5%) experienced the largest declines.
- A few states still recorded strong aggregate earnings growth, with the top increases in Utah and South Dakota (both 3.9%) and Idaho (3.4%).
- By comparison, every state had at least one calendar-year drop in total personal income during the Great Recession, which devastated the economy more than 10 years ago. The recovery that followed—the longest on record—ended on a high note with every state reporting increases in personal income in 2018 and 2019.

State highlights in the fourth quarter of 2020
The fourth quarter of 2020 reflected both a recovering economy and waning federal aid to bolster residents’ finances. Comparison of annualized growth rates in each state’s total inflation-adjusted personal income between the fourth quarter of 2020 and the same quarter a year earlier shows:
- South Dakota (6.3%) had the highest growth rate in the sum of all its residents’ personal income, followed by Montana (5.7%), Idaho (5.6%), and Nebraska (5.3%). Year-over-year growth was largely driven by recovering farm earnings due to COVID-19 relief funds to farmers and ranchers, increased international demand for agricultural products, and higher crop prices.
- Personal income declined in four states over the year: Alaska (-1.2%), Wyoming (-0.9%), Hawaii (-0.4%), and New York (-0.1%). These states experienced some of the biggest declines in total earnings, and in all but Hawaii the boost in government assistance was lower than it was nationwide.
- In nine states—California, Colorado, Hawaii, Illinois, Massachusetts, Nevada, New Jersey, Pennsylvania, and Texas—government transfer payments increased by at least 20% from the fourth quarter a year ago.
- Among the 30 states with higher earnings than a year earlier, the strongest gains were in South Dakota (9.1%), Montana (5.9%), and Nebraska (5.6%). The sharpest losses were registered in Hawaii (-9.8%), Wyoming (-3.9%), and Nevada (-3.8%).
Results for the fourth quarter of 2020 are based on estimates and are subject to revision, as is Pew’s ranking of growth rates for state personal income.
States recovered unevenly from the Great Recession
States entered the new recession from vastly different starting points in terms of personal income growth over the longest economic recovery in U.S. history. Inflation-adjusted personal income eventually bounced back in all states from the Great Recession, but at different paces. From the start of the 2007-09 downturn through the fourth quarter of 2019—the last quarter before the coronavirus pandemic started to derail the economy—Utah and North Dakota led all states with long-term compound annual growth rates equivalent to 3.4% and 3.3% a year, respectively, followed by a group of mostly Western states. Connecticut and Mississippi lagged all other states with pre-pandemic growth rates equivalent to 0.9% a year, less than half of the U.S. rate of 2%. These compound annual growth rates represent the pace at which state personal income dollars would need to grow each year to reach their current level, after accounting for inflation, and are one way of tracking a state’s economic trends.

What is personal income?
Personal income sums up residents’ paychecks, Social Security benefits, employers’ contributions to retirement plans and health insurance, income from rent and other property, and benefits from public assistance programs such as Medicare and Medicaid, among other items. Personal income excludes realized or unrealized capital gains, such as those from stock market investments.
Federal officials use state personal income to determine how to allocate support to states for certain programs, including funds for Medicaid. State governments use personal income statistics to project tax revenue for budget planning, set spending limits, and estimate the need for public services.
Growth in personal income should not be interpreted solely as wage growth; wages and salaries account for about half of U.S. personal income. Likewise, growth in total state personal income should not be seen as a measure of how much the income of average residents has changed. Other measures should be used to approximate income growth for individuals, such as state personal income per capita or household income.
Looking at state gross domestic product, which measures the value of all goods and services produced within a state, would yield different insights on state economies.
Download the data to see state-by-state growth rates for personal income from 2007 through the fourth quarter of 2020. Visit Pew’s interactive resource “Fiscal 50: State Trends and Analysis” to sort and analyze data for other indicators of state fiscal health.
Analysis by Barb Rosewicz, Mike Maciag, and Joe Fleming.


America’s Overdose Crisis
Sign up for our five-email course explaining the overdose crisis in America, the state of treatment access, and ways to improve care
Sign up
Fiscal 50: State Trends and Analysis

Economic Downturns: Protecting State and Local Budgets
Where States Get Their Money, FY 2021
ADDITIONAL RESOURCES

Fact Sheet

Podcast