The Shrinking Tax Gap Between Philadelphia and Its Suburbs

© Getty Images
Overview
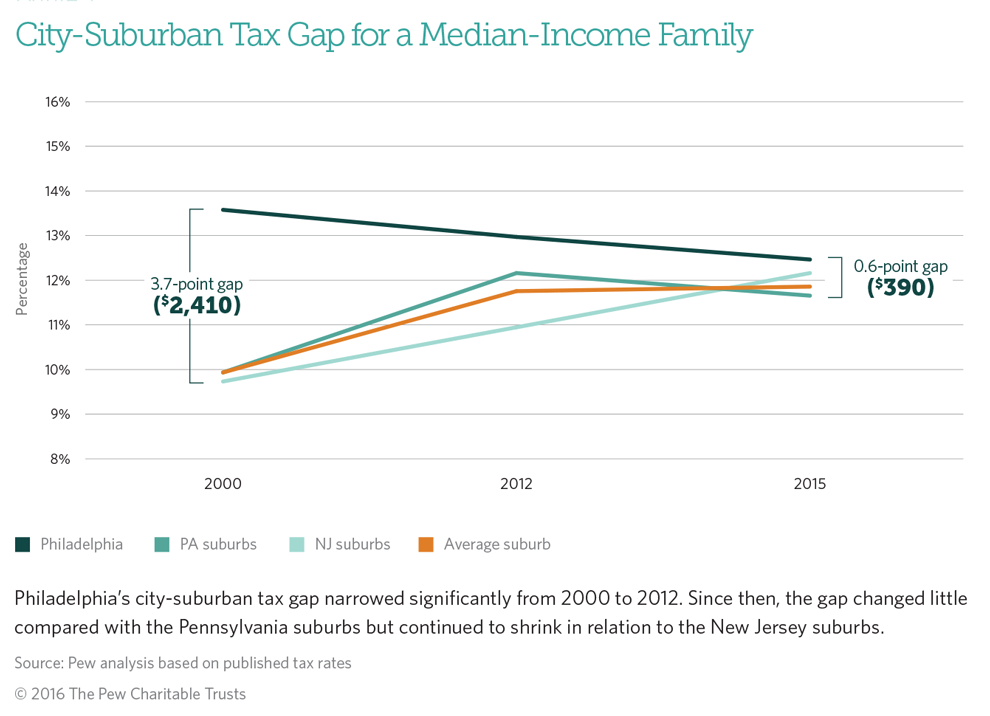
For a homeowning family, the tax disadvantage of living in Philadelphia instead of the suburbs has dipped to its lowest point in at least 15 years, making the city more affordable in terms of taxes than many surrounding towns, particularly other communities with relatively low median household incomes.
Research by The Pew Charitable Trusts shows that a middle-income family with a home in the city spent 12.4 percent of its income in 2015 on local property tax, state and local sales tax, and state and local income tax, the biggest nonfederal levies. The same family living and working in the suburbs of Pennsylvania and New Jersey had an average tax burden of 11.8 percent, or just 0.6 percentage points less. In 2000, the average gap between the city and suburbs was 3.7 percentage points. In dollar terms, adjusted for inflation, the family went from saving an average $2,410 in taxes in 2000 by living and working in the suburbs to saving just $390 in 2015.
This difference in state and local taxes between Philadelphia and its neighboring towns is a financial barometer of the city’s attractiveness as a place to live or work, compared with the 354 communities surrounding it.
The research, which focused on taxes that a hypothetical family would pay in the city versus the suburbs, updates a 2012 Pew report, Residential Taxes: A Narrowing Gap Between Philadelphia and Its Suburbs. At that time, the average city-suburban tax gap was 1.2 percentage points, or about $750 in taxes per year. Since that report, the landscape has changed mainly because of changes in property taxes—most significantly in New Jersey.
In the city, the biggest single factor in narrowing the tax gap is the homestead relief program enacted in 2013 as part of a property tax overhaul. Without this program, which delivered a break that was particularly significant for families owning modestly priced homes, Philadelphia’s tax burden would have risen and its disadvantage would have grown.
Philadelphia’s tax burden shrank the most in comparison with suburbs that have relatively low median household incomes, like the city itself. Among the 100 poorest communities in the area, Philadelphia’s tax burden declined from third-heaviest in 2000 to 59th-heaviest in 2015. In relation to the 100 wealthiest towns, Philadelphia had the 10th-heaviest tax burden—meaning it still had a significant tax disadvantage compared with places that attract higher-earning families. The analysis also found that:
- Philadelphia in 2015 still was more heavily taxed than a large majority of its suburbs, with the 97th-heaviest tax burden out of 355 municipalities studied in nine counties in southeastern Pennsylvania and southern New Jersey.
- Suburban residents who work in Philadelphia had the worst tax situation. A family earning its income in the city and owning a home in the suburbs instead of Philadelphia saved about $300 in 2000 but lost $1,210 in 2015. (All amounts are inflation-adjusted to 2015 dollars.) During that period, the family’s suburban property taxes rose substantially while its city wage taxes fell slightly.
- The most heavily taxed suburb in New Jersey in 2015 was Woodlynne Borough in Camden County. In Pennsylvania, it was Colwyn Borough in Delaware County.
- Lower Alloways Creek Township in Salem County had the lightest tax burden in New Jersey, while Bryn Athyn Borough in Montgomery County had the lightest in Pennsylvania.
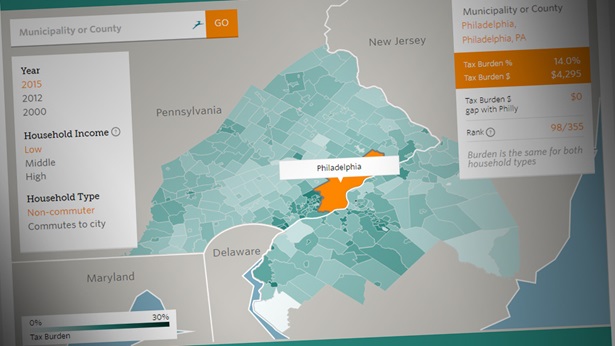
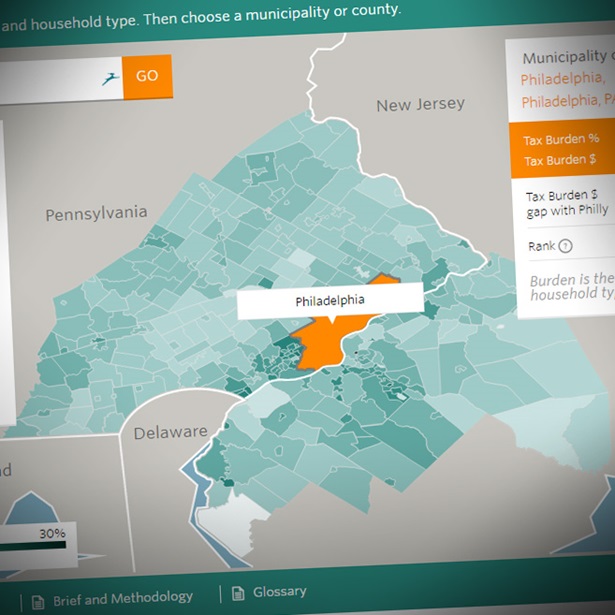
Interactive map
Tax burdens and tax gaps for every municipality in this study can be found in an interactive map at pewtrusts.org/compare-philly-suburban-tax-burden. The interactive map allows users to view findings by town, county, income level, year, and residence or work location.
The tax burden on the hypothetical family may not match the reality for many residents, especially on the property tax, which is the most complicated element to compare across jurisdictions. In addition, the tax burden calculation does not include any other taxes and fees beyond wage, property, and sales taxes. Nor does the analysis reflect residents’ level of satisfaction with the municipal services they are funding, especially schools and public safety, which often outweighs the level of taxation in families’ decisions about where to live.
The impact of these tax trends within the region is hard to pin down. During the 15-year period examined in this study, Philadelphia’s population hit a 100-year low, then grew for the first time in decades. The extent to which these trends or others were directly affected by local tax changes is unclear and was beyond the scope of this research.
Still, economists say the tax gap is a useful measure of tax competitiveness and potentially a factor in issues ranging from suburban flight to the funding of public services—and can help local officials gauge their tax decisions in relation to other municipalities in the region.


America’s Overdose Crisis
Sign up for our five-email course explaining the overdose crisis in America, the state of treatment access, and ways to improve care
Sign up
Interactive Map: Compare Tax Burdens in the Philly Region


Infographic: Philly Tax Burden
Understanding how it has changed in the city and suburbs
ADDITIONAL RESOURCES

Article

Article