Updated: State Impact of Expired State and Local Sales Tax Deduction
NOTE: Pew issued a related brief in December 2013, using 2011 IRS data. This update incorporates 2012 IRS data and notes that the state and local sales tax deduction expired at the end of 2013.
Many temporary federal tax provisions expired at the end of 2013. Policymakers have routinely extended many of these provisions over the past decade, but action on a package of “extenders” in 2014 remains uncertain. Among the expired provisions is the deduction for state and local sales taxes. If it is not retroactively extended, states with the highest claim rates would be likely to feel the biggest effects.
What is the state and local sales tax deduction?
Tax filers who itemize deductions on their federal returns may deduct certain taxes paid to state and local governments, such as real estate, personal property, and income taxes. Under this provision, filers could choose to deduct state and local sales taxes instead of state income taxes, but that option expired at the end of 2013. The sales tax deduction was most often claimed in states that have no or limited income tax. About 11 million filers claimed a total of $16 billion in state and local sales tax deductions in 2012.
What is the geographic distribution of the state and local sales tax deduction?
| State | Claim rate | State | Average deduction per filer |
| Washington * | 27.7 % | Washington * | $602 |
| Nevada * | 21.7 % | Tennessee * | $404 |
| Texas * | 19.7 % | Texas * | $376 |
| Florida * | 19.7 % | Nevada * | $332 |
| Tennessee * | 18.4 % | Florida * | $279 |
| Wyoming * | 17.4 % | South Dakota * | $224 |
| South Dakota * | 15.3 % | Wyoming * | $221 |
| Arizona | 8.4 % | Arizona | $139 |
| Alaska * | 7.1 % | Kansas | $92 |
| New Jersey | 7.0 % | Mississippi | $91 |
| U.S. Average | 7.3 % | U.S. Average | $113 |
| *State has limited or no income tax. Source: Pew's analysis of IRS statistics of income, historic table 2, tax year 2012. |
|||
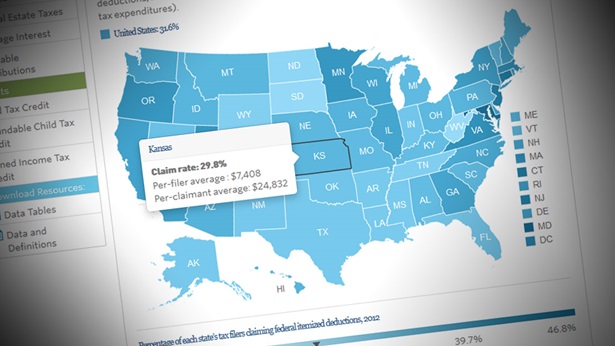
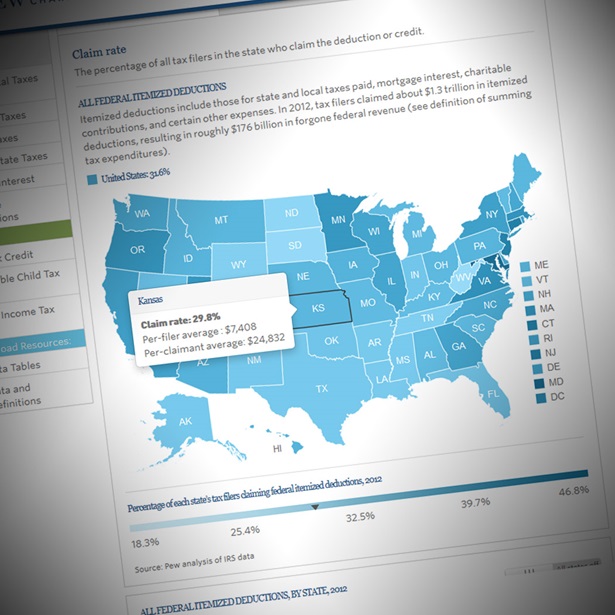
Mapping the sales tax deduction shows that the average deduction and the rate at which it was claimed vary widely across the states. A number of factors influenced this variation; the most significant in determining which states were at the top and bottom of the distribution was whether a state has no income tax or no sales tax. Generally, states with the highest proportion of filers claiming the sales tax deduction and the highest average deductions per filer have no or limited income tax. Conversely, states with the lowest claim rates and average per-filer deductions have no state sales tax. In Washington state, for example, which has a sales tax and no income tax, nearly 28 percent of federal filers claimed the deduction in 2012, compared with fewer than 1 percent in Delaware, which has an income tax but no sales tax (see table showing the top 10 states).1 Washington’s average sales tax deduction per filer was $602, compared with $4 in Delaware.2
How do the deductions for state and local taxes affect states?
Federal deductions for state and local taxes—including real estate, personal property, and income or sales taxes—lower the tax liability for individuals who claim them, resulting in additional disposable income for the filers. Higher disposable income generally boosts economic activity, so changes to deductions for state and local taxes could affect state economies and have an indirect impact on revenue. In addition, these deductions reduce any economic disincentives created by state and local taxes. On the other hand, lower tax collections at the federal level lead to higher budget deficits or reduced spending, which can have an offsetting negative economic effect nationally. If these deductions were reduced or eliminated, states with the highest claim rates and average per-filer deductions would probably be most affected.3
Deductions for state and local taxes also reduce the overall cost to taxpayers of state and local spending. Effectively, the federal government covers a share of the cost of state and local services. According to the Congressional Budget Office, this could encourage state and local governments to impose higher taxes that are deductible at the federal level and to provide more services. Research indicates that changes to these deductions, such as the expiration of the deduction for sales taxes, could affect states’ decisions about their own tax policies, including the level and mix of taxes they use to finance spending priorities.4
Pew has developed a Web interactive with more detail on the state-by-state distributions of the deductions for state and local taxes and other federal tax provisions. Please visit the Fiscal Federalism Initiative Web page for more information.
Endnotes
1 Residents of the five states with no state sales tax (Alaska, Delaware, Montana, New Hampshire, and Oregon) may claim the federal deduction for sales taxes if, for example, they make purchases in states with sales taxes and the sales taxes they pay exceed the income taxes they pay. Additionally, some residents of Alaska, which has no state sales tax, may pay sales taxes levied at the local level (as well as in other states).
2 The average deduction per tax filer is the total amount of deductions claimed in a state divided by the total number of federal tax filers in the state, including those who do not actually claim the deduction. Similar to a per-capita measure, the per-filer average controls for the size of the tax-filing population in each state.
3 It is also worth noting that six states (Alabama, Iowa, Louisiana, Missouri, Montana, and Oregon) allow residents to deduct federal income taxes from their state income tax returns. Eliminating or reducing federal deductions generally—including those for state and local taxes—would increase federal taxes. Higher federal taxes would result in larger deductions on the state tax returns in these six states and thereby reduce state revenue.
4 Frank Sammartino, “Federal Support for State and Local Governments Through the Tax Code,” Congressional Budget Office (April 25, 2012), http://www.cbo.gov/publication/43047; and Steven Maguire, “Federal Deductibility of State and Local Taxes,” Congressional Research Service (Sept. 20, 2012), http://www.fas.org/sgp/crs/misc/RL32781.pdf.


ADDITIONAL RESOURCES

Podcast