States Add to Reserves, Especially Rainy Day Funds
Note: These data have been updated. To see the most recent data and analysis, visit Fiscal 50
States have made strides in rebuilding their rainy day funds since the Great Recession, but most still have smaller total balances on hand than they did before the downturn. At the close of fiscal year 2016, total balances in states’ general fund budgets—including rainy day funds—could run government operations for a median of 36.2 days, still less than the median of 41.3 days in fiscal 2007. Estimated results for fiscal 2017 show the median declining to 27.5 days.
For the first time, more than half of the states—26—ended fiscal 2016 with larger rainy day funds as a share of operating costs than before the recession. But most states’ budgets still had a smaller financial cushion. Only 18 states could cover more days’ worth of operating costs than in fiscal 2007 with their total balances, counting money saved in rainy day reserves plus general fund ending balances, which are the amounts left at the end of the budget year in what functions as a state’s main checking account.
After tax revenue plunged in the 2007-09 downturn, states tapped both their savings and ending balances to help plug huge gaps that opened in their budgets. As state revenue has slowly recovered, so have reserves and balances—largely because most states have made efforts to rebuild their rainy day funds over the past eight years of economic recovery.
This analysis and Fiscal 50’s ranking of states by reserve fund levels are based on fiscal 2016 results, because fiscal 2017 data are likely to change once states officially close their books. It is difficult for states to pinpoint ending balances before all of their bills are paid and revenue is collected. In recent years, final figures have been higher than estimates.
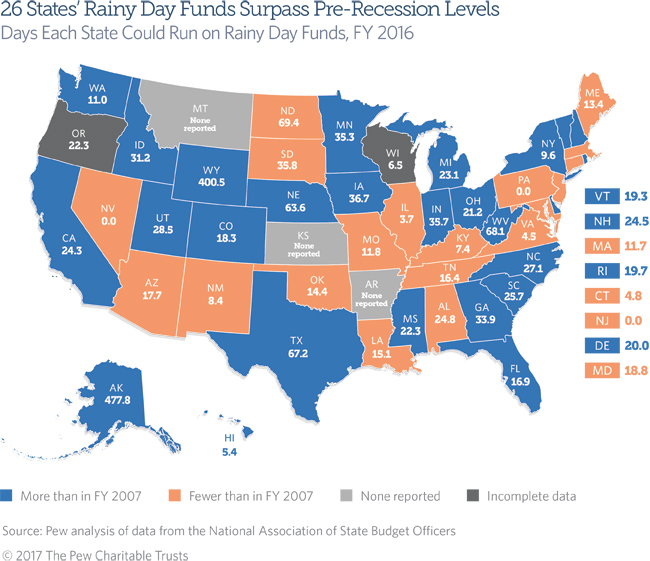
Rainy day funds
Reserves in rainy day funds—also called budget stabilization funds—were the largest component of states’ financial cushions in fiscal 2016, accounting for nearly $2 of every $3 of total balances. The importance of rainy day funds in helping to gird against budget uncertainties has grown since the recession. Slow and uneven tax revenue growth has limited most states’ ability to match their large ending balances in the year before the downturn. Rainy day funds typically provide a stable cushion from year to year, while ending balances are more volatile and harder to predict.
Nationally, rainy day funds held $51.9 billion in fiscal 2016—more than before the recession in both nominal dollars and as a share of government expenditures, according to data collected by the National Association of State Budget Officers (NASBO). States had set aside enough in these funds to run operations for a median of 19.1 days in fiscal 2016, or 5.2 percent of general fund spending—more than a median of 16.6 days, or 4.6 percent of spending in fiscal 2007. Early estimates indicate a slight decline in the median amount held by states in fiscal 2017, to 18.6 days, or 5.1 percent of expenditures.
Since the Great Recession, most states have been rebuilding their rainy day funds, as they did after the 2001 recession. However, a number have struggled to save given sluggish tax revenue growth. For example, New Jersey drained its rainy day fund in fiscal 2009 to help ease the budget crunch it faced as a result of the recession and has not managed to replenish it at all since then.
Other states have had to make more recent withdrawals. Nine states tapped their rainy day funds in fiscal 2016, according to NASBO, while 16 anticipated withdrawing from savings in fiscal 2017. Alaska, which has one of the largest rainy day funds in the country, made the biggest withdrawal in fiscal 2016. The state depends on revenue from oil production to fund much of its operations and drew down almost a third of its savings to cover a significant budget gap caused by low oil prices.
Rainy day fund highlights
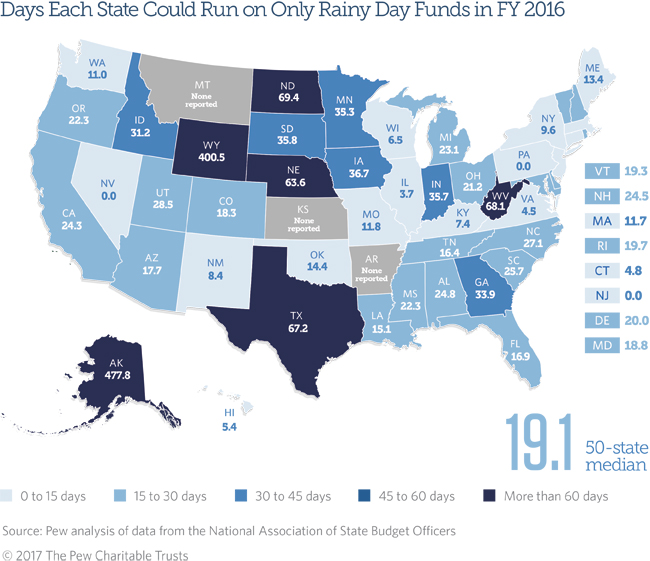
Days Each State Could Run on Only Rainy Day Funds in FY 2016
Click the map to expand.
States’ results for fiscal 2016 show:
- Alaska could cover the most days’ worth of spending (477.8 days) despite drawing down more than $3.3 billion in fiscal 2016 to cover ongoing budget shortfalls stemming from a decline in oil-related revenue. This was the second year in a row that the state withdrew from its rainy day reserves, which shrank to their lowest level as a share of operating costs since 2008.
- Wyoming (400.5 days) was the only other state with more than a year’s worth of operating costs in its rainy day fund. Although the state has added to its savings in recent years, its reserves show a substantial increase since 2014 largely because it updated how it reports its data to NASBO. As a result, current figures are not directly comparable to earlier totals.
- Nine states’ rainy day funds could cover more days’ worth of operating costs than at any point since at least 2000: Georgia (33.9 days), Hawaii (5.4), Idaho (31.2), Indiana (35.7), New Hampshire (24.5), North Carolina (27.1), Ohio (21.2), Rhode Island (19.7), and Wyoming (400.5).
- Pennsylvania had so little stowed away that it could fund operations for less than a 10th of a day. Five additional states also held less than a week’s worth of operating costs: Connecticut (4.8 days), Hawaii (5.4), Illinois (3.7), Virginia (4.5), and Wisconsin (6.5).
- Two states had nothing in their savings accounts: Nevada and New Jersey.
- Arkansas, Kansas, and Montana did not report rainy day fund totals to NASBO.
- According to NASBO, the nine states that tapped their rainy day funds to manage their budgets in fiscal 2016 were Alaska, Connecticut, Louisiana, Mississippi, New Mexico, Oklahoma, South Dakota, Washington, and West Virginia.
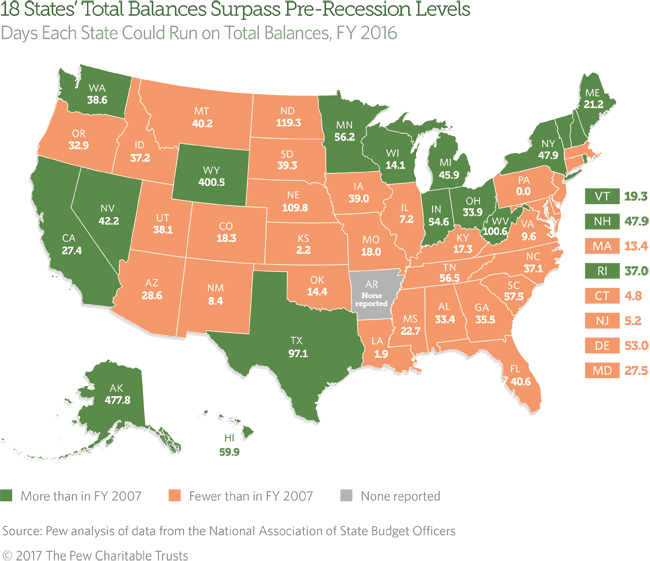
Total balances
States’ total balances stood at $80.8 billion in fiscal 2016, and they held enough funds to cover operating expenditures for a median of 36.2 days. This amounted to 9.9 percent of spending, less than the fiscal 2007 median of 41.3 days, or 11.3 percent. But for many states, even pre-recession total balances were inadequate to plug budget gaps that opened as a result of the Great Recession.
Although just 18 states’ total balances provided a larger financial cushion than before the recession, reserves and balances continued to grow nationally as the median number of days that states could operate on these balances reached the highest level since 2007. Growth in rainy day funds helped spur the increase as ending balances in most states were lower than in previous years. For example, Texas has one of the largest rainy day funds but experienced especially large declines in ending balances amid a revenue slowdown.
Since ending balances vary from year to year, they do not necessarily represent how much a state has stowed away but can serve as an indicator of budget stress. Often these funds can be available for a state to use in a budget crunch and provide an additional source of fiscal flexibility. According to NASBO, Alaska, Connecticut, and Louisiana reported negative ending balances for fiscal 2016, an indication that each faced revenue shortfalls at the close of the budget year. Only Louisiana had not resolved its shortfall by the end of the year, which subsequently could lower the total reported in its rainy day fund.
Although final numbers have not yet been tallied for fiscal 2017, at least 32 states estimated that their total balances relative to operating expenditures would drop from a year earlier, as many states struggled to meet revenue projections. North Dakota expected the biggest decline—from 119 days’ worth of spending on hand to just over one day.
Total balance highlights
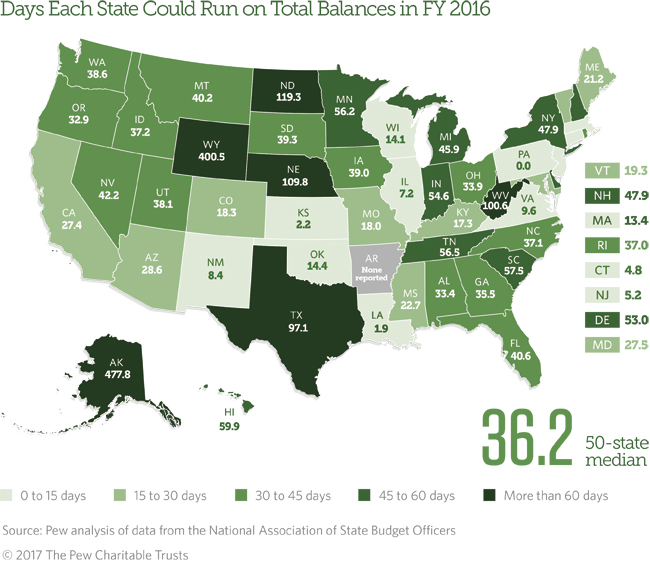
Days Each State Could Run on Total Balances in FY 2016
Click the map to expand.
States’ results for fiscal 2016 show:
- Five states had total balances that could cover more than 100 days of operating costs: Alaska (477.8 days), Wyoming (400.5), North Dakota (119.3), Nebraska (109.8), and West Virginia (100.6).
- Less than a week’s worth of operating costs were held by New Jersey (5.2 days), Connecticut (4.8), Kansas (2.2), Louisiana (1.9), and Pennsylvania (less than a 10th of a day).
- New Mexico (8.4 days) saw its financial cushion shrink to its lowest level since at least 2000.
- Three states’ total balances could cover more days’ worth of operating costs than at any point since at least 2000: New Hampshire and New York (both 47.9 days), and Wyoming (400.5 days). New York’s total spiked in recent years because of one-time payments it collected from legal settlements reached with financial institutions.
Why reserves matter
States use reserves and balances to manage budgetary uncertainty, deal with revenue forecasting errors, prevent severe spending cuts or tax increases when there are unexpected revenue shortfalls, and cope with unforeseen emergencies. Because reserves and balances are vital to managing unexpected changes and maintaining fiscal health, their levels are tracked closely by bond rating agencies. For example, S&P Global Ratings downgraded Massachusetts’ debt rating in June 2017, citing its “failure to follow through on rebuilding its reserves.
Building up reserves is a sign of fiscal recovery, but there is no one-size-fits-all rule on when, how, and how much to save. States with a history of significant revenue or economic volatility may desire larger cushions. According to a December 2015 report by The Pew Charitable Trusts, the optimal savings target of state rainy day funds depends on three factors: the defined purpose of funds, the volatility of a state’s tax revenue, and the level of coverage—similar to an insurance policy—that the state seeks to provide for its budget.
General fund reserves and balances may not reflect a state’s complete fiscal cushion. States may have additional resources to soften downturns, such as dedicated reserves outside of their general funds or rainy day accounts. In addition, some states undertake considerable spending outside of the general fund, so comparisons across states should be made with caution. One way to standardize the size of reserves and balances is to calculate how many days a state could run solely on those funds, even though it is highly unlikely that would ever happen.
Download the data to see individual state trends. Visit Pew’s interactive resource Fiscal 50: State Trends and Analysis to sort and analyze data for other indicators of state fiscal health.

Fiscal 50: State Trends and Analysis
Sort and chart data about key fiscal and economic trends in the 50 states, and read Pew's insights.
ADDITIONAL RESOURCES

Fact Sheet

Podcast


